/
 Arthritis Rheumatoid Osteo  Arthritis Rheumatoid Osteo

Arthritis Rheumatoid Osteo - PowerPoint Presentation

stefany-barnette
stefany-barnette . @stefany-barnette
Follow
344 views
Uploaded On 2020-04-04

Arthritis Rheumatoid Osteo - PPT Presentation

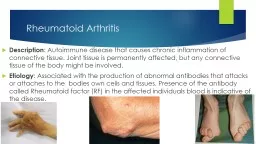
Traumatic Clara Bergeron What is it Means joint inflammation Describes more than 100 rheumatic diseases and conditions that affect joints tissues surrounding the joints and other connective tissue ID: 775428

arthritis prevalence risk adults arthritis prevalence risk adults incidence people million osteoarthritis physical years 000 100 factors age aorc

Share:

Link:

Embed:

Download Presentation from below link

Download Presentation The PPT/PDF document " Arthritis Rheumatoid Osteo" is the property of its rightful owner. Permission is granted to download and print the materials on this web site for personal, non-commercial use only, and to display it on your personal computer provided you do not modify the materials and that you retain all copyright notices contained in the materials. By downloading content from our website, you accept the terms of this agreement.


Presentation Transcript

Slide1

Arthritis

RheumatoidOsteoTraumatic

Clara Bergeron

Slide2

What is it?

Means “joint inflammation”Describes more than 100 rheumatic diseases and conditions that affect joints, tissues surrounding the joints, and other connective tissueCharacterized by pain and stiffness in and around one or more jointsCan also involve immune system or various internal organs#1 cause of disability among US adults

Slide3

Why is it a public health problem?

High prevalence

High lifetime risk

Common disability

Occurs with other chronic conditions

Discourages physical activity

Slide4

Arthritis Risk Factors

Physical InactivityBeing a womanOverweight/obesity

Slide5

More Potential Risk Factors

Risk factors for OTHER chronic conditions are also common in U.S. adults with arthritisHigh blood pressureHigh cholesterolCorrelation, not causation at this point

Slide6

Prevalence

An estimated 50 million U.S. adults (22%) report having doctor-diagnosed arthritis

Number expected to increase to 67 million by 2030

By Age:

Ages 18-44: 7.6%

Ages 45-64: 29.8%

Ages 65+: 50.0% (1 in 2 people over 65)

2/3 of people with AORC are under 65 years

old

300,000

children affected by AORC

Slide7

Prevalence

By sex:Women: 24.3% affectedMen: 18.7% affected

Slide8

Prevalence

By race/ethnicity:Highest prevalence among non-Hispanic whitesLow prevalence among HispanicsHigh work limitation among Hispanics

Slide9

Arthritis Prevalence by Sex

Sex-specific prevalence of doctor-diagnosed arthritis

(includes all types of arthritis)

Slide10

Arthritis Prevalence by Relative Weight

Higher prevalence in overweight people (by 3%)Even higher prevalence in obese people (by 13%)Especially relevant to arthritis in the knees

Slide11

Global Arthritis Prevalence

Not possible to estimate incidence, prevalence, or outcomes of arthritis in most countries

Slide12

What types are there?

Rheumatic Arthritis

Osteoarthritis

Traumatic Arthritis

Childhood Arthritis

Fibromyalgia

Gout

Systemic Lupus Erythematosus

Reactive arthritis

Slide13

Rheumatic Arthritis (RA)-What is it?

An autoimmune condition, causing chronic inflammation of the synovial membraneInflamed synovium leads to erosions of cartilage and bone, and sometimes joint deformityPolyarthritis: affects 5 or more joints in the bodyCan begin at any ageNo cure

Slide14

RA: Risk Factors

Genetic

Strongest candidate so far is PTPN22 gene, which has been linked to several autoimmune conditions

Modifiable Environmental

Smoking: 1.3-2.4x higher risk

Reproductive and breastfeeding history

Oral contraceptives: decreased risk?

Live birth history: no live births=increased risk

Breastfeeding: decreased risk

Menstrual history: irregular menses or early menopause=increased risk

Low Socioeconomic Status

Excess disability and increases mortality

Slide15

RA: Prevalence

0.5-1.0% of general population

1.5 million US adults

(2007)

Decrease from 1990 estimate of 2.1 million

Rochester Epidemiology Project in Minnesota (age adjusted prevalence)

1995 2005

Women: 7.7 per 1000 9.8 per 1000

Men: 4.4 per 1000 4.1 per 1000

Slide16

RA: Incidence

41 per 100,000 people diagnosed with Rheumatoid Arthritis each year

(1995-2007)

Increases with age

8.7 per 100,000 in ages 18-34

89 per 100,000 in ages 65-74

54 per 100,000 in ages >85

Slide17

RA: Morbidity

People with RA have worse functional status than those with osteoarthritis and those without arthritis

RA was the 19

th

most common cause for years lost to disability in the U.S.

(1996)

Notable given that RA is a low prevalence condition

Slide18

RA: Mortality and Co-morbidities

Associated with excess mortality

Most common causes: respiratory and infectious diseases, gastrointestinal disorders

Accounted for 22% of all deaths due to AORC

(1997)

Standardized mortality ratio of 2.3 compared with general population

(1990)

Co-morbidities

Cardiovascular disease: not sure if RA or CVD occurs first

Infections: especially tuberculosis

Mental health conditions: decreased physical function

Malignancies: especially leukemia and multiple myeloma. Cause unknown.

Slide19

Osteoarthritis (OA)-What is it?

Degeneration of cartilage and its underlying bone within a joint, as well as bony overgrowthResult of mechanical and molecular events in affected jointCommonly affects: knees, hips hands, spineGradual onset after age 40No cure

Slide20

OA: Risk Factors

Estrogen deficiency

Estrogen replacement therapy may reduce risk of knee/hip OA

Osteoporosis

Vitamins C, D, and E

C-reactive protein (increased risk with higher levels)

Smoking has been shown to be PROTECTIVE

Possibly due to physiological effects of smoking on bone, collagen, and cartilage tissue

Or some unmeasured surrogate factor

Slide21

OA: Prevalence

Total U.S. adults with clinical osteoarthritis in at least one joint: 26.9

million

(up from 21 million in 1990)

Symptomatic hand osteoarthritis: 13.1 million U.S. adults

Symptomatic knee osteoarthritis: 9.3 million U.S. adults

By age:

25 and older: 13.9%

65+ years: 33.6% (12.4 million)

Slide22

OA: Incidence

Increases with age, and levels off around 80 years

Age and sex standardized incidence of symptomatic OA:

Hand OA: 100 per 100,000 person years

Hip OA: 88 per 100,000 person years

Knee OA: 240 per 100,000 person years

By sex:

Women: 45% higher incidence risk of knee OA and 36% higher risk of hip OA than men

Slide23

OA: Morbidity

OA of the knee: one of the top five causes of disability among non-institutionalized adults

80% of patients with OA have some degree of movement limitation

25% cannot perform major activities of daily living

11% need help with personal care

14% require help with routine needs

Slide24

Traumatic Arthritis (TA)-What is it?

Arthritis caused by blunt, penetrating, or repeated trauma , or from forced inappropriate motion of a joint or ligament, generally leading to “bruised” cartilage

Defects in cartilage tissue are refilled with scar tissue, which doesn’t support weight well and isn’t as smooth as normal articular cartilage

Symptoms: swelling, pain, tenderness, joint instability, internal bleeding

Often lumped in as another form of osteoarthritis

Slide25

Gout

Rheumatic disease caused by deposition of uric acid crystals in tissues and fluids in the body

Caused by overproduction or under excretion of uric acid

Acute Symptoms (typical): red, hot, swollen joints associated with excruciating pain

Chronic Gout: can lead to a degenerative form of chronic arthritis-“Gouty Arthritis”

Affects about 6 million people in the U.S.

Incidence increases with age

More prevalent in men than women

Treatment with medication and altered diet

Slide26

Reactive Arthritis

“Reiter’s Syndrome” autoimmune disorder that develops as a response to an infection elsewhere in the body

Commonly due to Chlamydia trachomatis bacteria (the STD

)

Often misdiagnosed, incidence may rival or surpass that of rheumatoid arthritis (~125,000 new cases per year in U.S.)

Effectively

treated by combination antibiotics

Slide27

Comorbidities Associated with Arthritis

Medical expenses associated with these four conditions make up a significant portion of the estimated $353 billion in medical expenditures of U.S adults who have AORC

Slide28

Arthritis-Attributable Limitations

~21 million U.S. adults with doctor-diagnosed arthritis reported limitations in their general activities due to the conditionWork limitation group only considered population between ages 18 and 64

Slide29

Screening and Treatment

Rheumatoid:

No screening or primary prevention per se

But can manage other risk factors: smoking cessation, influenza vaccination, moderate exercise

Medications: tumor necrosis factor blockers, interleukin 1 receptor antagonists

Early aggressive treatment with medication, followed by drug step-down

Osteo

:

No screening or early detection

Multidisciplinary treatment: low-impact exercise, physical & occupational therapy, over the counter analgesics, non-steroidal anti-inflammatory drugs

Possible joint replacement if moderate/severe pain and limitation

Slide30

Annual Cost of Arthritis in the U.S.

Total costs attributable to AORC in 2003: $128 billion

Equal to 1.2% of the 2003 U.S. gross domestic product

Direct costs: $80.8 billion

Indirect costs: $47 billion

24% growth between 1997 and 2003

Slide31

Cost: Percentage of GDP by State

Concentrated in the Eastern U.S.Cost is well aligned with prevalence

Slide32

Total Cost of U.S. Adults with Arthritis

Total medical expenditures of people with AORC in 1997: $252 billion

Total medical expenditures of people with AORC in 2005: $353 billion

Increased by 22% in 8 years

Due to 22% increase in the number of people diagnosed with arthritis

And a 15% increase in the medical expenditures for each person with arthritis

Prescription drugs accounted for the main portion of this increase

Ambulatory care costs also increased

Hospital care costs decreased

Slide33

Efforts to Reduce Incidence and Prevalence

4 self-management education programs

Teach people with arthritis techniques to manage it on a day-to-day basis

2 of these programs are specifically designed for

S

panish speakers

6 physical activity programs

Appropriate physical activity can decrease arthritis pain and disability

2 health communications campaigns promoting physical activity

1 designed for Caucasians and African Americans

1 designed for Spanish-speaking Hispanics

Slide34

National Public Health Agenda for Osteoarthritis

Set in 2010, following a call to action by the Arthritis Foundation and the CDC

Three overall goals to be reached in 3-5 years (aka now…)

Availability of evidence-based intervention strategies to all Americans with OA

Establish supportive policies communication initiatives, and strategic alliances for OA prevention and maintenance

Initiate needed research to better understand the burden of OA, its risk factors and effective intervention strategies

Slide35

Are we meeting our goals?

Slide36

Current CDC Projects

First Step to Active Health

4 part program including strategies for participating in aerobic, flexibility, strength and balance exercise

Evaluating effectiveness of program using outcomes of symptoms, physical activity level, functional performance, and strength

Choosing Arthritis-appropriate Physical Activity

Develop, implement, and evaluate the efficacy of brief psycho-educational intervention to select appropriate physical activity, and to modify it as necessary for their particular circumstances

Slide37

Current CDC projects cont’d.

Johnston County Osteoarthritis Project: Arthritis & Disability

Community-based, longitudinal study of 3200 rural white and black residents aged 45 and older

Determine prevalence, incidence, and risk factors of hip and knee osteoarthritis

Has been conducted since 1991, with reports every 7 years

Lupus Registries

Developing population-based registries to better define the incidence and prevalence of lupus

Existing registries in GA and MI: white and black populations

Newer registries in CA and NYC: Hispanic and Asian populations

Slide38

Other questions

More current cost estimates broken down by type of arthritis

Gauge whether cost is aligned with prevalence

Global data for incidence, prevalence, morbidity, mortality

Especially in areas where there is a lot of farming or factory work (repetitive motions)

Developing earlier detection strategies

Especially for Rheumatoid Arthritis, where early aggressive treatment is most beneficial