/
Evaluating the Impacts of the Evaluating the Impacts of the

Evaluating the Impacts of the - PowerPoint Presentation

stefany-barnette
stefany-barnette . @stefany-barnette
Follow
370 views
Uploaded On 2018-03-16

Evaluating the Impacts of the - PPT Presentation

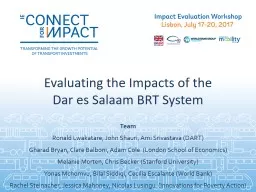
Dar es Salaam BRT System Team Ronald Lwakatare John Shauri Ami Srivastava DART Gharad Bryan Clare Balboni Adam Cole London School of Economics Melanie Morten Chris Becker Stanford University ID: 653552

baseline brt survey phase brt baseline phase survey impacts understand rct results respondents compare sample 2016 fare 2017 tracking jan income housing

Share:

Link:

Embed:

Download Presentation from below link

Download Presentation The PPT/PDF document "Evaluating the Impacts of the" is the property of its rightful owner. Permission is granted to download and print the materials on this web site for personal, non-commercial use only, and to display it on your personal computer provided you do not modify the materials and that you retain all copyright notices contained in the materials. By downloading content from our website, you accept the terms of this agreement.


Presentation Transcript

Slide1

Evaluating the Impacts of the Dar es Salaam BRT System

Team

Ronald Lwakatare, John

Shauri

, Ami Srivastava (DART)

Gharad Bryan, Clare

Balboni

, Adam Cole (London School of Economics)

Melanie Morten, Chris Becker (Stanford University)

Yonas Mchomvu, Bilal Siddiqi, Cecilia Escalante (World Bank)

Rachel Steinacher, Jessica Mahoney, Nicolas

Lusingu

(Innovations for Poverty Action)Slide2

Dar es

Salaam Bus Rapid Transit System

Phase 1 of (6 phase) Dar

es

Salaam BRT

Opened May 2016

21km of bus ways, 5 terminals, 2 depots, 27 bus stations

Connects high-income CBD with middle/low-income residential areas

First operational BRT in East AfricaSlide3

We would like to know: does the Dar BRT…

Reduce travel times?

Create jobs and boost income?

Encourage firm productivity, trade and growth?

Improve property values?

Make roads safer?Increase the health, wealth and happiness of Dar residents – especially the poorest?Slide4

Evaluation approach aims to…

…estimate the impacts of BRT Phase 1

Understand how the BRT has affected the lives and welfare of residents

As well as the impacts on urban neighborhoods, development and growth

… and understand the mechanisms through which impacts happen

e.g. through greater mobility? Relocation of people/firms? …while laying the groundwork to evaluate future phases

Phases 2, 3 planned in the near future, 4-6 later on

Don’t want to reinvent the wheel for future evaluations!

…and providing information relevant to for other contexts!

Should inform BRTs planned in other African cities, elsewhere in the worldSlide5

Combination of methods used to achieve this

Spatial “triple-differences” approach

Compare places (

i

)

near and far from Phase 1 with places (ii) near and far from planned Phase 2, (iii) before and after Phase 1

.

Mechanism experiments (randomized controlled trials)

Temporary fare subsidies to encourage (some) commuters to use BRT – compare to control group to understand impacts of using the BRT

“Spatially conditional” cash transfers to encourage (some) residents to stay where they are, or relocate – to understand BRT’s impacts on relocation and urban development

Structural modeling to estimate general equilibrium impacts

Mechanism experiments will produce key elasticities for model

Allow findings to be applied to other contextsSlide6

What we have been up to so far

Jan 2016: Baseline surveys

Travel time survey

Household survey

May 2016: BRT Phase 1 Opens

Mar 2017: Tracking baseline sample

Household tracking survey

Mobile survey enrolment

May 2017 (onwards): Mobile survey

SMS- and call-based

Semi-monthly to panel of respondentsSlide7

Spatial triple differences approach

We are trying to understand if the BRT

caused

changes in outcomes of interest

Want to make sure that changes were not caused by other things

If BRT went to neighborhoods that were richer, we would see more jobs, higher income – but not caused by BRT!If rich people moved away from BRT areas, we would see less income – but not caused by BRT either!

Need a comparison (“control”) group

Find locations and individuals that look just like those affected by BRT

Compare “treatment” and “control” groups – just like a medical experiment!Slide8

Spatial triple differences approach

Compare places (

i

)

near and far from Phase 1

with places (ii)

near and far from planned Phase 2

, (iii)

before and after Phase 1

.

Difference 1:

Compare A* to B* = ∆

Difference 2:

Compare ∆ to difference between A’ and B’

Difference 3:

Compare these differences before and after Phase 1Slide9

Baseline data collection (Jan 2016)

Dense geographical sampling strategy ensures coverage inside and outside catchment areas of Phase 1

Surveyed 1749 households from sampled neighborhoods

Data can be used as baseline for impact evaluation of future phasesSlide10

Examples of baseline data (Jan 2016)Slide11

Baseline sample tracking and mobile surveys

Very early results from first tracking attempt

Baseline sample: 1749 households, 2 respondents/HH

Through phone/tracking, so far reached and enrolled 1315 individual respondents in monthly mobile surveys

Of these, 902 one of the baseline survey respondents

Asked 3 simple questionsGoing forward, hope to get (almost) full sample…Full follow-up survey of baseline respondents Sep 2017We expect results to changeSlide12

Who is riding the BRT?

Of 902 tracked baseline respondents, 32% rode the BRT last week

Socioeconomic status:

Basic Needs Poverty Line: 24% below vs 34% above

Unemployed: 32%

Informal sector workers: 31%

Age 18-60 32.5% vs 61+ 25%

Female 30% vs Male: 33%

Private vehicle users 44%, vs

Daladala

35%, Walk: 31%Slide13

Changes in hours worked

Scale

Red/orange: hours worked went up

Blue/green: hours worked went down

No conclusive relationship (yet) between BRT Phase 1 and hours worked

But suggests focusing on time-use

If people save time from commuting, what do they use the time for?Slide14

What we plan to do next!

Follow-up survey of baseline sample

Estimate short-term (18 month) impacts

Experiments to understand mechanisms of change – to develop this week

Experiment 1: Fare subsidies

Objectives: (i) to measure direct effects of riding the BRT and (ii) to understand access issuesExperiment 2: “Spatially Conditional” Cash Transfers

Objective: to understand relocation and urban development due to BRTSlide15

Experiment 2: “Spatially Conditional” Cash TransfersSlide16

What we plan to do – for the next 3 years!

July-Aug 2017 – Qualitative study of urban housing market

To inform the feasibility and design of housing RCT

Sep 2017 – Follow-up survey 1

Reinterview

all baseline respondentsOct-Dec 2017 – AnalysisFirst set of spatial triple-diff resultsPresented and disseminated

Jan-Feb 2018 – Housing RCT launch

Sample enrolment and baseline survey

Disbursement of first set of cash transfers

Oct 2018 – Follow-up survey 2

Reinterview

all baseline respondents

Will provide 2-year impacts

Nov-Dec 2018 – Fare RCT launch

Sample enrolment and baseline survey

Disbursement of 6-month smartcards

Jan 2019 – Housing RCT

endline

Feb–Jun 2019 – Analysis

Second set of spatial triple-diff results

Results from housing RCT

Presented and disseminated

July 2019 – Fare RCT

endline

Aug 2019-Jun 2020 – Analysis

Results from fare RCT

Results from structural modeling exercise

Final results presented and disseminated