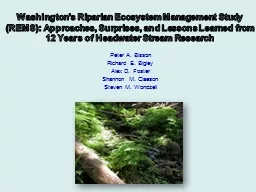
/
Washington’s Riparian Ecosystem Management Study (REMS): Washington’s Riparian Ecosystem Management Study (REMS):

Washington’s Riparian Ecosystem Management Study (REMS): - PowerPoint Presentation

stefany-barnette
stefany-barnette . @stefany-barnette
Follow
387 views
Uploaded On 2015-11-08

Washington’s Riparian Ecosystem Management Study (REMS): - PPT Presentation

Peter A Bisson Richard E Bigley Alex D Foster Shannon M Claeson Steven M Wondzell NASA Skokomish Queets Humptulips Clearwater Hoh Sol Duc Hoko Fulton Riparian Ecosystem Management Study Phase 1 ID: 186805

clearcut control post riparian control clearcut riparian post continuous fall patch abundance forest spring sites seral buffers stream surprise

Share:

Link:

Embed:

Download Presentation from below link

Download Presentation The PPT/PDF document "Washington’s Riparian Ecosystem Manage..." is the property of its rightful owner. Permission is granted to download and print the materials on this web site for personal, non-commercial use only, and to display it on your personal computer provided you do not modify the materials and that you retain all copyright notices contained in the materials. By downloading content from our website, you accept the terms of this agreement.


Presentation Transcript

Slide1

Washington’s Riparian Ecosystem Management Study (REMS): Approaches, Surprises, and Lessons Learned from 12 Years of Headwater Stream Research Peter A. BissonRichard E. BigleyAlex D. FosterShannon M. ClaesonSteven M. WondzellSlide2
Slide3

NASASlide4

SkokomishQueetsHumptulipsClearwater

Hoh

Sol Duc

Hoko

Fulton

Riparian Ecosystem

Management Study – Phase 1

Location of study sites

1996-1999

Olympic National Park

Riparian condition:

no buffers

narrow (<20 m) buffers

thinned buffers

unloggedSlide5

We surveyed:Fishes Amphibians AssemblagesCutthroat trout Tailed frog All fish speciesTorrent sculpin Cope’s giant salamander All stream- dwellingCoastrange sculpin Torrent salamander amphibiansSlide6

Environmental variablesSite-level Landscape-level In-stream features Watershed attributesChannel gradient Watershed area% pools Drainage density% riffles & cascades Mean elevation% glides % south-facing% silt & sand % steep slopes (>60%)% gravel & pebble% cobble Riparian forest age% boulder & bedrock % early-seral riparian zone % mid-seral

riparian zone

% late-

seral

riparian zone

Upland conditions

% early-

seral

upland forest

% mid-

seral

upland forest

% late-seral upland forest Road density Landslides/debris torrentsSlide7

For headwater trout and sculpins, there was a negative association between abundance and late-seral riparian forest; however, fish tended to be most strongly influenced by in-stream habitat.Fish abundance was positively correlated with riparian and watershed features associated with increased primary production.Slide8

Amphibians responded positively to late-seral riparian forest and the amount of late-seral forest in their watersheds. Their abundance was negatively correlated with roads.Slide9

Northwest Forest Plan Aquatic Conservation StrategyReeves et al. 2006Slide10

Adaptive Management Areas – intended to provide site flexibilitySlide11

Surprise #1Despite the designation of Adaptive Management Areas (AMAs) under the Northwest Forest Plan, we were unable to convince National Forests in western Washington to implement a series of experimental riparian treatments at the small watershed scale.Slide12

LandsatSlide13

BACI-type study of alternative riparian management in clusters of small watershedsSlide14

DNRSlide15

Unlogged controlsContinuous (“fixed-width) buffersDiscontinuous (“patch cut”) buffersNo buffersSlide16
Slide17

Capitol Forest

Willapa Hills

Seattle

Washington State

22 Streams in 6 Blocks in 2 Forests

See Control Continuous Clearcut

Rot Control Continuous Patch

Tags Control Continuous Patch Patch Clearcut

Ells Control Continuous Clearcut

Split Control Continuous Clearcut Clearcut

Lonely Control Continuous Patch ClearcutSlide18

Surprise #2A completely randomized block design was stymied by engineering considerations. Control watersheds were always at the end of a cluster.Slide19

Surprise #3Despite good intentions, implementing the treatments didn’t always go as planned. Buffers were not always consistent and logging took place over two years instead of one.Slide20

ControlSlide21

Continuous/fixed widthSlide22

Discontinuous/patch cutSlide23

No bufferSlide24

Surprise #4Drought conditions prevailed through much of the study, especially the early years!Slide25
Slide26

Surprise #5Unanticipated post-logging site preparation treatments!Slide27
Slide28

Surprise #6Large wind storms and blowdown at some of the sites!Slide29
Slide30
Slide31

In-stream measurementsSlide32
Slide33
Slide34

Unbuffered streams were significantly warmer, but… Temperature increases were small Trend did not match buffer design, and Responses within treatments were highly variable Temperature responses were correlated with streambed texture, wetlands, and length of stream Surface area exposure Amount of hyporheic exchange

Temperature

Summary:Slide35

Terrestrial Mites & Collembola abundanceAbundance increased in all logged sites, relative to the Control.

-0.5

-0.4

-0.3

-0.2

-0.1

0

0.1

0.2

0.3

0.4

0.5

Log (Trt / Control)

PRE

POST 1

POST 2

(mean + 1 SE)

Continuous Control

Patch Control

Clearcut ControlSlide36

Mayfly abundanceEphemeroptera = Paraleptophlebia, Baetis, Diphetor, Heptageniidae sp.Log (Trt / Control)

(mean + 1 SE)

Continuous Control

Patch Control

Clearcut Control

PRE

POST 1

POST 2

-0.8

-0.6

-0.4

-0.2

0

0.2

0.4

0.6

Abundance tended to

decrease

in all logged sites (esp.

clearcut

) 2

nd

year post-harvest, relative to the Control.Slide37

Stonefly abundancePlecoptera = Zapada, Soyedina, Sweltsa, IsoperlaLog (Trt / Control)

(mean + 1 SE)

Continuous Control

Patch Control

PRE

POST 1

POST 2

-0.6

-0.5

-0.4

-0.3

-0.2

-0.1

0

0.1

0.2

0.3

0.4

Abundance

decreased

in the

unbuffered

sites 1

st

year post-harvest, relative to the Control.

Clearcut ControlSlide38

Litterfall measurementsSlide39

Litter fall total dry massLitter-fall decreased in the clearcut sites, relative to the Controls.

Clearcut

Control

Log (Trt / Control

)

(mean + 1 SE)

-0.3

-0.2

-0.1

0

0.1

PRE

POST 1

POST 2

Continuous Control

Patch Control

Clearcut ControlSlide40

Shredder abundanceZapada, Soyedina, Lara, Yoraperla, MoseliaShredder abundance decreased in the clearcut sites, relative to the Controls.

-0.6

-0.4

-0.2

0

0.2

0.4

Log (Trt / Control

)

(mean + 1 SE)

PRE

POST 1

POST 2

Continuous Control

Patch Control

Clearcut ControlSlide41

Riparian mollusksSlide42

Warty jumping slugPolydesmid millipede

P. BissonSlide43

Capitol Forest BlockPeriod

Fall 02

Spring 03

Fall 03

Fall 04

Spring 05

Fall 05

Spring 06

Mollusk Density m

2

0

2

4

6

8

10

12

Control

Fixed Width

No Buffer

Before

After

Willapa Block A

Period

Spring 04

Fall 04

Spring 05

Fall 05

Spring 06

0

2

4

6

8

10

12

Control

Fixed Width

No Buffer

Before

After

Mollusk Density m

2

Willapa Block B

Period

Fall 02

Spring 03

Fall 03

Fall 04

Spring 05

Fall 05

Spring 06

0

2

4

6

8

10

12

Control

Fixed Width

No Buffer - B

No Buffer - E

Before

After

Mollusk Density m

2Slide44

ConclusionsSetting up and implementing a BACI-type study at the small watershed scale was a pain! Patience and a willingness to adapt to surprises were needed.The initial 2 year pre-treatment and 2-3 year post-treatment monitoring period was inadequate for many response metrics, but the watersheds were changing anyway and it was difficult to interpret results.Preliminary findings suggest that biophysical changes in the streams and riparian zones were not great after logging, but differences were most apparent in sites without stream buffers.

Analyses were often confounded by unanticipated events.Slide45

Use a design strategy that employs legitimate treatment-control sites, or that randomizes treatment assignment over enough sites that differences average out.Verify, with power analysis, that the proposed design is adequate to resolve the anticipated effect, given available estimates of pertinent variability, including uncontrolled environmental variation and random site differences.Implement the design, and stick with it until you resolve the important question(s) or until the data show that the actual uncontrolled variation is so different from what was assumed during the planning phase that the design is not adequate to resolve the question.Don’t be afraid to investigate novel response metrics.

Lessons learned…Slide46
Slide47
Slide48
Slide49
Slide50
Slide51

http://treesearch.fs.fed.us/pubs/36997