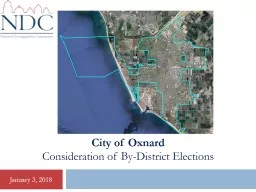
January 3 2018 Project Timeline January 3 2018 Date Event December 12 1 st hearing gather public input on the composition of districts January 3 2 nd hearing gather public input on the composition of districts ID: 723764
Download Presentation The PPT/PDF document "City of Oxnard Consideration of By-Distr..." is the property of its rightful owner. Permission is granted to download and print the materials on this web site for personal, non-commercial use only, and to display it on your personal computer provided you do not modify the materials and that you retain all copyright notices contained in the materials. By downloading content from our website, you accept the terms of this agreement.
Slide1
City of OxnardConsideration of By-District Elections
January 3, 2018Slide2
Project TimelineJanuary 3, 2018
Date
Event
December 12
1
st hearing: gather public input on the composition of districtsJanuary 32nd hearing: gather public input on the composition of districtsJanuary 5Deadline to submit initial draft maps (5 p.m.) By January 10Draft maps released at City Hall and on project websiteJanuary 173rd hearing: public input on draft maps and election sequencingJanuary 294th hearing: public input on draft maps and election sequencingFebruary 75th hearing: public input on draft maps and election sequencingFebruary 206th hearing: public input on draft maps and election sequencing; possible map selection February 27Hearing, map selection (if needed) and ordinance introductionMarch 6Second reading and adoption of ordinance Nov. 2018First by-district elections Nov. 2020Second by-district elections
2Slide3
Traditional Districting Criteria
Equal PopulationFederal
Voting Rights Act
No Racial Gerrymandering
Communities of interest
CompactContiguousVisible (Natural & man-made) boundariesRespect for voters’ wishes and continuity in officeFederal LawsTraditional CriteriaJanuary 3, 20183Slide4
January 3, 2018Demographic Summary
4
Latinos are 74% of the total population and 60% of the eligible voters (measured by Citizen Voting Age Population data).
Asian-Americans and African-Americans are much smaller: only 11% of total population and 4% of eligible voters.
Each of the 4 districts should have about 49,475 residents (acceptable range of 47,001 to 51,948);
each of 6 districts should be 31,334 to 34,632; each of 8 districts should be 23,501 to 25,975.Slide5
January 3, 20185
Latino CVAP Concentrations
Latino eligible voters are in all parts of the City, but are more highly concentrated along and south of Hwy 101, and along and east of Ventura Rd.Slide6
Other Protected Class Concentrations
January 3, 2018
6Slide7
Defining Communities of InterestJanuary 3, 2018
1
st
Question: what is your neighborhood or community of interest?
A Community of Interest is generally defined as a neighborhood or community of shared interests, views, problems, or characteristics.
Possible community feature/boundary definitions include:School attendance areasNatural neighborhood dividing lines, such as highway or major roads, rivers, canals, and/or hills Areas around parks and other neighborhood landmarksCommon issues, neighborhood activities, or legislative/election concernsShared demographic characteristicsSuch as similar levels of income, education, or linguistic isolation2nd Question: Does a Community of Interest want to be united in one district, or to be divided to have a voice in multiple elections?7Slide8
Compact, Single Representative Samples
January 3, 2018
8
Glendale
Unified
ComptonSlide9
Central Unified
Multiple Representative Samples
January 3, 2018
9
Pasadena
South PasadenaSlide10
Map-Drawing
Tools
January 3, 2018
Use the paper map, the online tool, or
any other map
Draw your neighborhood; draw the district you want for your area; or draw an entire citywide map10Slide11
Using the One-Page Paper Map
January 3, 2018
11
Interactive Map
The population of the largest and smallest districts must be within 10% of each other. So the population in each district in a Four-district map should be 47,001 to 51,948. For a six-district map the range should be from 31,334 to 34,632.Slide12
Using the online tool
January 3, 2018
12
1
6
74235Tutorials and help resources are available from the login page.Circled items:1: controls to move around the map;2: choose into which district selected territory will be placed;3: options for how to select territory;4: demographic summary of districts;5: demographic change of currently selected area;6: review map when finished;7: submit map. Slide13
Using the Excel toolJanuary 3, 2018
13
Enter the district assignment in the highlighted column, and Excel will calculate the resulting demographic changes.
Download either the 4-district or 6-district Excel files, or both, depending on the map you wish to draw.Slide14
Submissions Received So Far
Four-District Maps
Eleven received so far
Six were population balanced
Three were not population balanced
Two are not yet processedSix-District MapsFifteen received so farTwo were population balancedNine were not population balancedFour are not yet processedEight-District MapsTwo received so farNeither was population balancedOther Maps ReceivedFour maps with only two districts (that would elect two or three members each)Three maps with only three districts (that would elect two members each)These do not meet the ‘safe harbor’ provisions of the California Voting Rights ActJanuary 3, 201814All maps are posted to the City website once they are processed. Only the population-balanced maps are posted to the Interactive MapSlide15
DiscussionJanuary 3, 2018
What are the boundaries of your neighborhood or “community of interest”?
Do you want your neighborhood united in one district, or with multiple Councilmembers elected from it?
What neighborhoods do you think make sense to be with your neighborhood in a district or districts because of common city issues?
What other “communities of interest” do you see in the City?
Any questions about any of the map-drawing tools?Deadline for public submission of initial draftmaps is 5pm on January 5th.15City WebsiteInteractive Map