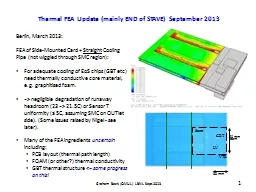
Greece ECOBOND GRAPHS An EnergyBased Modeling and Simulation Framework for Complex Dynamic Systems with a focus on Sustainability and Embodied Energy Flows Dr Rodrigo Castro ETH Zürich Switzerland ID: 734537
Download Presentation The PPT/PDF document "Sept. 27, 2013 , Athens" is the property of its rightful owner. Permission is granted to download and print the materials on this web site for personal, non-commercial use only, and to display it on your personal computer provided you do not modify the materials and that you retain all copyright notices contained in the materials. By downloading content from our website, you accept the terms of this agreement.
Slide1
Sept. 27, 2013
, Athens, Greece
ECO-BOND GRAPHSAn Energy-Based Modeling and Simulation Frameworkfor Complex Dynamic Systems with a focus on Sustainability and Embodied Energy Flows
Dr. Rodrigo Castro ETH Zürich, Switzerland.University of Buenos Aires & CONICET, Argentina.
The 10th
International
Multidisciplinary
Modelling
& Simulation
Multiconference
The 1st Int’l. Workshop on
Simulation for Energy, Sustainable
Development & EnvironmentSlide2
Problem formulationEmergy tracking & Complex Dynamics SystemsPossible approachesOur approachNetworked Complex Processes3-faceted representation of energy flowsThe Bond Graph formalismThe new Eco Bond GraphsDefinitionExamplesSimulation resultsConclusionsAgendaSlide3
System Theoretic Approach
Complex Dynamics SystemsGlobal scale socio-natural processesWe live in a nonlinear world, mostly away from equilibriumProblem formulationSlide4
Storages and Processes
Problem formulation
“Grey Energy”
Flows of Mass and Energy
Each
process
can abstract several
internal sub processes
We want to model
systematically
this type of systems
Structural approach
Sustainability propertiesSlide5
Sankey DiagramsStatic
(snapshot-like) World Energy Flow.Considering energy lossesPossible approachesSlide6
Considering energy losses
Energy System Language (H.T.
Odum
)Account for dynamicsDifferential Eqns.Possible approachesSlide7
Networked processes
Multi Input/Multi Output ProcessesIncluding recycling paths Our approachSlide8
Focus on mass flows
3-Faceted representationOur approach
Balance
: Mass and Energy
Tracking
: EmergySlide9
Minimum required formulation To achieve the modeling
goal systematicallyHow do we formalize and generalize this structure ? Basic formulation Our approachSlide10
Bondgraph
is a graphical modeling technique Rooted in the tracking of power [Joules/sec=Watt]Represented by effort variables (e) and flow
variables (f)Goal:Sound physical modeling of generalized flows of energySelf checking capabilities for thermodynamic feasibility
Strategy:Bondgraphic modeling of phenomenological processes Including emergy tracking capabilitiesBondgraphic approachThe Bond Graph Formalismef
Power
= e
·
f
e:
Effort
f: FlowSlide11
Energy
DomaineEffort variablefFlow variable
Mechanical, translationForceLinear velocity
Mechanical, rotationTorqueAngular velocityElectricalElectromotive forceCurrentMagnetic
Magnetomotive
force
Flux rate
Hydraulic
Pressure
Volumetric flow rate
Thermal
temperature
entropy flow rate
Energy domains
Bondgraph is multi-energy
domain
The Bond Graph Formalism
e
fSlide12
As every bond defines two
separate variablesThe effort e and the flow fWe need two equations to compute values for these two variablesIt is always possible to compute one of the two variables at each side of the bond
.A vertical bar symbolizes the side where the flow is being computed.Causal BondsThe Bond Graph Formalism
efSlide13
Local balances of energy
JunctionsThe Bond Graph Formalism
0
e1e2e3f1f2f3
e
2
=
e1e
3 = e
1f1 =
f2 + f
3
1
e
1
e
2
e
3
f
1
f
2
f
3
f
2
=
f
1
f
3
=
f
1
e
1
=
e
2
+
e
3
Junctions of type
0
have
only one flow equation
, and therefore, they must have exactly
one
causality bar.
Junctions of type
1
have
only one effort equation
, and therefore, they must have exactly
(n-1)
causality bars.Slide14
An electrical
energy domain modelExample IThe Bond Graph Formalism
Bondgraphic equivalentElectrical Circuit
VoltageSourceCapacitorResistorInductorResistorSlide15
Example I
The Bond Graph Formalism
U0.e
U0.eU0.eC1.eC1.eC1.e
R1.e
U0.f
L1.f
R1.f
R1.f
R1.f
R2.f
C1.f
Systematic
derivation
of equations
U0 .e
=
f(t)
U0 .f
=
L1 .f
+
R1 .f
d/dt
L1.f
=
U0 .e
/ L1
R1 .e
=
U0 .e –
C1 .e
R1 .f
=
R1 .e
/ R1
C1 .f
=
R1 .f –
R2 .f
d/dt C1.e
=
C1 .f
/ C1
R2 .f
=
C1 .e
/ R2
Bondgraphic
modelSlide16
A multi-energy domain model
Electricity
Mechanical rotationalMechanical translationalExample IIThe Bond Graph Formalism
uaiaia
i
a
i
a
u
Ra
uLa
ui
τ
ω1
ω1
ω
1
ω
1
τ
B3
τ
B1
τ
B1
τ
B1
τ
J1
ω
2
ω
12
ω
2
ω
2
ω
2
τ
k1
τ
G
F
G
v
v
v
v
v
F
B2
F
k2
F
m
-m·g
τ
J2
Special elements such as
Gyrator
and
Transformer
convert
energy flows
across
diff. physical domainsSlide17
Facets and Bonds
Bond Graph variables for Complex SystemsFacets 1 and 2Power variables:Specific Enthalpy [J/kg] (an effort variable) Mass Flow [kg/sec] (a flow variable). [J/sec] = [J/kg] · [kg/sec] represents power Information variableMass
[Kg] (a state variable)Facet 3 (the emergy facet)Information variableSpecific Emergy [J/kg] (a structural variable)[J/sec] = [J/kg] · [kg/sec] also denotes powerEco Bond Graphs
EcoBGSlide18
Accumulators
The EcoBG Storage elementA Capacitive Field (CF) accumulates more than one quantity: Enthalpy, Mass and EmergyEco Bond Graphs
The specific enthalpy is a property of the accumulated mass Known in advance -> A parameter
qSlide19
Junctions
The EcoBG 0-JunctionEco Bond Graphs
M1
M2M3Slide20
Reusable structures
Basic unit based on EcoBG elementsAn important “building block”Storage of mass and energy adhering to the proposed 3-Faceted approach:Eco Bond GraphsM
1M2M
3Slide21
Modeling processes
EcoBG Process elementsEco Bond Graphs
PR()Slide22
Example
Extraction of renewable resources for consumptionEco Bond GraphsNatural Renewable
PrimaryReservoir
ConsumptionSecondaryReservoirSupplyProcess
Demand
ProcessSlide23
Software tools
EcoBG library implemented in the Dymola® tool.Eco Bond GraphsNatural Renewable
PrimaryReservoir
ConsumptionSecondaryReservoirSupply
Process
Demand
ProcessSlide24
The
Mass
LayerEco Bond Graphs
RainAccumulatedDeposit (Ma)ConsumptionReservoir (Mc)HumanDemandSlide25
Energy
and
Emergy
LayersEco Bond Graphs
Rain
Accumulated
Deposit
(
M
a
)
Consumption
Reservoir
(Mc)HumanDemandSlide26
Accumulated quantities (Deposit and
Reservoir)Simulation resultsEco Bond Graphseq.
EnergyEmergyTransformityeq.
eq.Slide27
Experiment: Rain flow reduced 4x. Results for Reservoir.
Simulation resultsEco Bond GraphsMassEnergy
EmergySlide28
Eco Bond GraphsA new “Plumbing Technology” for modeling Complex Dynamics Systems
A low-level tool to equip other higher-level modeling formalisms with the ability to track emergy flowsHierarchical interconnection of EcoBG subsystemsAutomatic and systematic evaluation of sustainability: global tracking of emergy and local checking of energy balancesM&S practiceThe laws of thermodynamics are not an opinable subject
Every sustainability-oriented effort should -at some point- consider emergyWe should become able to inform both: decision makers (experts, politicians, corporations) andpeople who express their wishes (democratic societies)about which are the feasible physical boundaries within which their -largely opinable- desires and/or plans can be possibly implemented in a sustainable fashion.
ConclusionsSlide29
Q&A
rodrigo.castro@usys.ethz.chrcastro@dc.uba.arThanks for your attention !