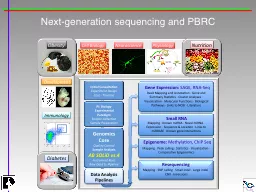
Next Generation Sequencer Applications DeNovo Sequencing Resequencing Comparative Genomics Global SNP Analysis Gene Expression Analysis Methylation Studies ChIP Sequencingtranscription factors histones polymerases ID: 337981
Download Presentation The PPT/PDF document "Next-generation sequencing and PBRC" is the property of its rightful owner. Permission is granted to download and print the materials on this web site for personal, non-commercial use only, and to display it on your personal computer provided you do not modify the materials and that you retain all copyright notices contained in the materials. By downloading content from our website, you accept the terms of this agreement.
Slide1
Next-generation sequencing and PBRCSlide2
Next Generation Sequencer Applications
DeNovo Sequencing
Resequencing, Comparative Genomics
Global SNP AnalysisGene Expression AnalysisMethylation StudiesChIP Sequencing-transcription factors, histones, polymerasesTranscriptome Analysis-splicing, UTRs, cSNPs, nested transcriptsMicroRNA Discovery and quantitationMetagenomics, Microbial diversityCopy number variationChromosomal aberrationsGene regulation studiesSlide3
AB SOLiD
Ligation sequencingSlide4
How many sequence tags* do I need
for my gene
expression application?
SAGE/CAGE – 2-5 million mappablemiRNA – 10 million mappableChIP Seq—10-20 million mappableWhole Transcriptome from polyA RNA – 40-50 million mappableWhole Transcriptome from rRNA depleted - >50 million mappableWhole Transcriptome for Allele Specific Expression - >>50 million mappableSOLiD™
4 generates >1.4 billion
mappable sequences/run (2 slides
)
Libraries can be multiplexed to decrease the
cost/sample according
to the application and number of sequences needed.
*
For human/mouse sized genomes; smaller organisms require fewer sequence tags. Slide5
SAGE Sequencing vs. Microarray
SOLiD v4
Microarray-Illumina Ref 8
Microarray-Illumina Ref 6Data Points3.6 million
25,600
45,200
Known and novel transcripts
Known
transcripts
Known
transcripts
Sensitivity
6 logs
3 logs
3 logs
Technical Reproducibility
>.99-.999
0.9
0.9
Correlation to Taqman
0.9
0.7-0.8
0.7-0.8
Multiplexing/Barcoding
Yes
–up
to 48 RNA or 96 DNA samples
No
No
No background –better for low abundance transcript
detection
Hybridization process creates background signal
RNA quantity
5-10 ug
750 ng
750 ng
16 Sample Experiment Cost
$7200-full service
$6100-PI creates library
$3600
$5200Slide6
Primary Data Analysis - Images to bases
Tertiary Data Analysis – Experiment Specific
Instrument-specific
Sequences +
Quality values
Differential expression
Methylation sites
Binding sites
Gene association
Genomic structure
Ref Seq + Alignment
Assembly, De Novo
Secondary Data Analysis – Bases to alignments/contigs
Applications
Tag Profiling
Small RNA Analysis
Transcriptome seq.
ChIP-
Seq
Methylation Analysis
Resequencing
De novo assembly
Algorithms
Eland
Maq
SOAP
Velvet
Newbler
Mapreads
Others …
Run
Quality
Sample/Library Quality
Discovery
Bioinformatics: Geospiza
One or more
Data setsSlide7
Next-gen sequencing: applications
Genome analysis: basic and translational research
Genetics of disease – new frontiers
Exome resequencing: confirmation of GWASGenome sequence as diagnostic toolGenetic counselingEpigenome analysis: basic research; biomarkersAnalyses of DNA methylation, transcription factors, histone modifications, non-coding RNAEpigenomic biomarkers of diseaseGene expression analysis: basic research; diagnostics & biomarkersWhole transcriptome: all transcribed sequences in a cellSAGE analysis: expression of known genesSmall RNA: microRNA as regulators of biology
Genotype to phenotype: a new frontier
Pathology: systems biology
Diagnosis: data filtering
Personalized Genomic Medicine: Treatment
recommendationsSlide8
Next-gen sequencing: challenges
Rapid growth in methodology
Technology and equipment changes & upgrades
High demands on informatics:StaffSoftwareComputational resourcesNew ways of handling data needed:InterpretationPublicationStorage