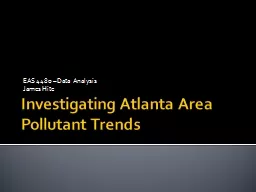
/
Investigating Atlanta Area Pollutant Trends Investigating Atlanta Area Pollutant Trends

Investigating Atlanta Area Pollutant Trends - PowerPoint Presentation

tawny-fly
tawny-fly . @tawny-fly
Follow
346 views
Uploaded On 2018-09-22

Investigating Atlanta Area Pollutant Trends - PPT Presentation

EAS 4480 Data Analysis James Hite Project Description Motivation Census Growth Monitoring Sites 5 Sdekalb Yorkville Bledsoe Douglasville Conyers O 3 CO NO x ID: 675873

trends data aug sdekalb data trends sdekalb aug conyers monthly cpsd slopes ppmv nox negative douglasville yorkville full positive

Share:

Link:

Embed:

Download Presentation from below link

Download Presentation The PPT/PDF document "Investigating Atlanta Area Pollutant Tre..." is the property of its rightful owner. Permission is granted to download and print the materials on this web site for personal, non-commercial use only, and to display it on your personal computer provided you do not modify the materials and that you retain all copyright notices contained in the materials. By downloading content from our website, you accept the terms of this agreement.


Presentation Transcript

Slide1

Investigating Atlanta Area Pollutant Trends

EAS 4480 – Data Analysis

James HiteSlide2

Project Description

Motivation: Census Growth

Monitoring Sites (5)

Sdekalb

, YorkvilleBledsoe,Douglasville, ConyersO3, CO, NOx, PM2.5 Previous Study on VOCs

2000-2010 Population Change

DeKalb

: (43,737, 16.7%)

Douglas: (16,847, 48.4%)

Spaulding

: (3,776, 16.4%)

Rockdale

: (8,190, 32.7%)

Paulding: (22,856, 78.1%)

Polk: -- (1,849, 14.6%)

Haralson: -- (1,568, 12.3%)

(expressed in housing units)Slide3

Trends in 1-hour averages

Initial

Results

Overall Negative Trends - in line with VOC study

Interesting pointsFull positive: Conyers, Sdklb O300-10: none/negativeMotivation for reanalysis (averaging) –diurnal cycleMethod=======LS Regression, Bootstrap resampling to determine 95% normal confidence intervalSlide4

Example: Conyers O3Slide5

Trends in Daily/Monthly Avgs

.

Overall: increase in negative slopes

Daily: Most retained negative trends except

Full&00-10 Conyers O3 – no trendNeg/none: Douglasville O3; pos/neg Sdekalb O3Monthly: Less noise  less apparent trends(in addition) Sdekalb O3: no full trend (00-10 less)No-trends: Bledsoe O3, Sdkelab PMfine00-10 Yorkville O3  no trend (full still neg.)Slide6

Example Figures: Sdekalb

O

3

10-year loss: -7.20E-03

ppmv

(daily)

vs -6.77E-03

ppmv (monthlySlide7

Changes in Monthly O3

Linear Trends identified across

indv

. months

Interesting results:JFM, ND off-season (Bedsole): positive trends (other stations don’t really measure at this time)Conyers Apr. (+), Aug. (-)Sdekalb Jul./Aug. (-)Trends in Individual Monthly Averages: Ozone

Slopes: ppmv/year

Month

BedsoleConyers

Douglasville

Sdekalb

Yorkville

Jan.

0.000539

no data

no data

no data

no data

Feb.

0.001458

0.000724371

no data

no data

no data

Mar.

0.000784

0.000445466

0.000697919

0.000455

0.000549

Apr

0.0003

0.000570481

0.000572493

2.65E-05

0.000388

May

-0.00054

-0.000167528

-0.000340723

-0.00044

-0.00057

Jun

-8.43E-05

0.000590219

7.82E-05

-0.00032

-0.00039

Jul

-3.79E-05

-0.000521273

-0.000813447

-0.00113

-0.00087

Aug

-0.00066

-0.000965664

-0.000811305

-0.00126

-0.0008

Sep

9.63E-05

-5.76E-05

0.0005018

-0.00038

0.000118

Oct

-0.00044

-2.96E-05

0.000127452

-0.00038

-0.00018

Nov

0.000632

no data

no data

0.001812

-0.00134

Dec

0.000905

no data

no data

no data

no dataSlide8

Example Figures

Mar., Nov.

off-season (

Bedsole

): positive trends Conyers : Aug. (-)Sdekalb : Aug. (-)

Note: other sites have similar slopes, did not pass resampling test for 95% confidence intervalInteresting: less urban areas have higher [March]Slide9

Rural v. Urban: Other Pollutants

Yorkville /

sdekalb

pollutants: all significant trends were negativePSD/CPSD AnalysisBedsole plot: (Lombscargle methodon 1-hr avgs)… took ~20 minutesSlide10

Example: NOxSlide11

Rural v. Urban

Separate

psd

analysis @ each station

Cpsd analysis & phase lagDaily Nox cpsd shows a shared weekly cycle with a lag of ~.5 day (yorksdekalb), would expect this since prevailing wind is easterly (coherence ~.7)Slide12

References

Data

Source:

http://

georgiaair.org/amp/export.phpGeorgia Department of Natural Resources, Environmental Protection Division, Air Protection Branch Ambient Monitoring Program - Susan Zimmer-Dauphinee, Program Manager Blanchard et. al. 20102009 Ambient Air Surveillance Report