/
Organizing Data Organizing Data

Organizing Data - PowerPoint Presentation

tawny-fly
tawny-fly . @tawny-fly
Follow
448 views
Uploaded On 2016-07-07

Organizing Data - PPT Presentation

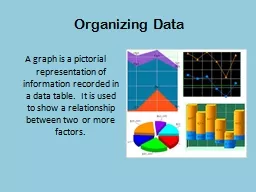
A graph is a pictorial representation of information recorded in a data table It is used to show a relationship between two or more factors Types of Graphs Line graphs are best for displaying data that changes It best shows the relationship between two variables ID: 394718

density data step graphs data density graphs step variable graph table substance physical types turn bar color collect grams

Share:

Link:

Embed:

Download Presentation from below link

Download Presentation The PPT/PDF document "Organizing Data" is the property of its rightful owner. Permission is granted to download and print the materials on this web site for personal, non-commercial use only, and to display it on your personal computer provided you do not modify the materials and that you retain all copyright notices contained in the materials. By downloading content from our website, you accept the terms of this agreement.


Presentation Transcript

pptx