/
Color Vision, Spatial Resolution, and Sex Color Vision, Spatial Resolution, and Sex

Color Vision, Spatial Resolution, and Sex - PowerPoint Presentation

teresa
teresa . @teresa
Follow
343 views
Uploaded On 2022-05-17

Color Vision, Spatial Resolution, and Sex - PPT Presentation

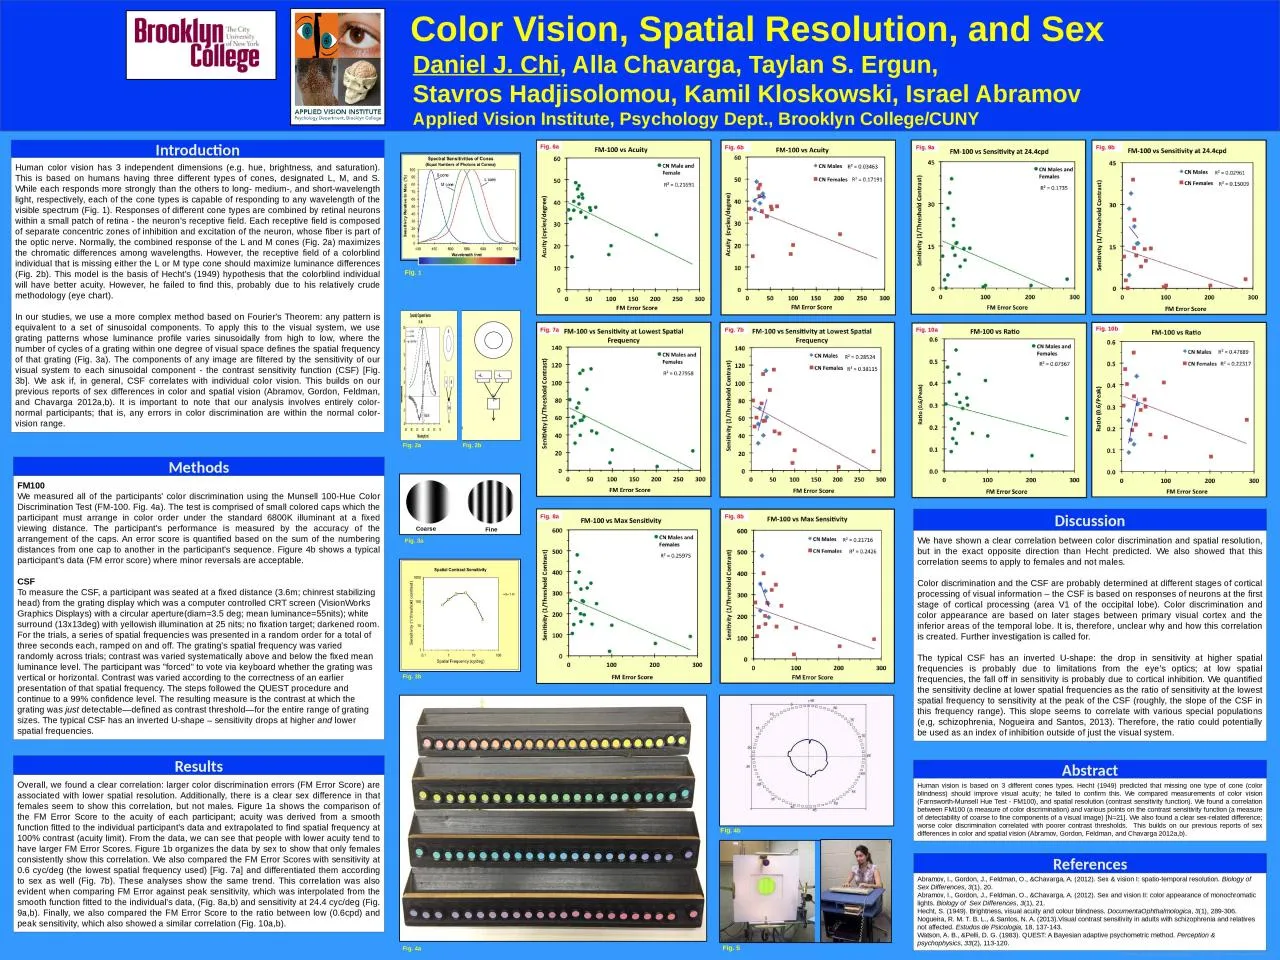
Daniel J Chi Alla Chavarga Taylan S Ergun Stavros Hadjisolomou Kamil Kloskowski Israel Abramov Applied Vision Institute Psychology Dept Brooklyn CollegeCUNY Human vision is based on 3 different cones types Hecht 1949 predicted that missing one type of cone ID: 911606

color fig sensitivity spatial fig color spatial sensitivity vision sex visual contrast csf correlation discrimination error grating participant frequency

Share:

Link:

Embed:

Download Presentation from below link

Download Presentation The PPT/PDF document "Color Vision, Spatial Resolution, and Se..." is the property of its rightful owner. Permission is granted to download and print the materials on this web site for personal, non-commercial use only, and to display it on your personal computer provided you do not modify the materials and that you retain all copyright notices contained in the materials. By downloading content from our website, you accept the terms of this agreement.


Presentation Transcript

Slide1

Color Vision, Spatial Resolution, and Sex

Daniel J. Chi

, Alla Chavarga, Taylan S. Ergun, Stavros Hadjisolomou, Kamil Kloskowski, Israel Abramov Applied Vision Institute, Psychology Dept., Brooklyn College/CUNY

Human vision is based on 3 different cones types. Hecht (1949) predicted that missing one type of cone (color blindness) should improve visual acuity; he failed to confirm this. We compared measurements of color vision (Farnsworth-

Munsell Hue Test - FM100), and spatial resolution (contrast sensitivity function). We found a correlation between FM100 (a measure of color discrimination) and various points on the contrast sensitivity function (a measure of detectability of coarse to fine components of a visual image) [N=21]. We also found a clear sex-related difference; worse color discrimination correlated with poorer contrast thresholds. This builds on our previous reports of sex differences in color and spatial vision (Abramov, Gordon, Feldman, and Chavarga 2012a,b).

Abstract

FM100

We measured all of the participants' color discrimination using the Munsell 100-Hue Color Discrimination Test (FM-100. Fig. 4a). The test is comprised of small colored caps which the participant must arrange in color order under the standard 6800K illuminant at a fixed viewing distance. The participant's performance is measured by the accuracy of the arrangement of the caps. An error score is quantified based on the sum of the numbering distances from one cap to another in the participant's sequence. Figure 4b shows a typical participant's data (FM error score) where minor reversals are acceptable.  CSFTo measure the CSF, a participant was seated at a fixed distance (3.6m; chinrest stabilizing head) from the grating display which was a computer controlled CRT screen (VisionWorks Graphics Displays) with a circular aperture(diam=3.5 deg; mean luminance=55nits); white surround (13x13deg) with yellowish illumination at 25 nits; no fixation target; darkened room. For the trials, a series of spatial frequencies was presented in a random order for a total of three seconds each, ramped on and off. The grating's spatial frequency was varied randomly across trials; contrast was varied systematically above and below the fixed mean luminance level. The participant was "forced" to vote via keyboard whether the grating was vertical or horizontal. Contrast was varied according to the correctness of an earlier presentation of that spatial frequency. The steps followed the QUEST procedure and continue to a 99% confidence level. The resulting measure is the contrast at which the grating was just detectable—defined as contrast threshold—for the entire range of grating sizes. The typical CSF has an inverted U-shape – sensitivity drops at higher and lower spatial frequencies.

Methods

We have shown a clear correlation between color discrimination and spatial resolution, but in the exact opposite direction than Hecht predicted. We also showed that this correlation seems to apply to females and not males.

 Color discrimination and the CSF are probably determined at different stages of cortical processing of visual information – the CSF is based on responses of neurons at the first stage of cortical processing (area V1 of the occipital lobe). Color discrimination and color appearance are based on later stages between primary visual cortex and the inferior areas of the temporal lobe. It is, therefore, unclear why and how this correlation is created. Further investigation is called for.  The typical CSF has an inverted U-shape: the drop in sensitivity at higher spatial frequencies is probably due to limitations from the eye’s optics; at low spatial frequencies, the fall off in sensitivity is probably due to cortical inhibition. We quantified the sensitivity decline at lower spatial frequencies as the ratio of sensitivity at the lowest spatial frequency to sensitivity at the peak of the CSF (roughly, the slope of the CSF in this frequency range). This slope seems to correlate with various special populations (e,g, schizophrenia, Nogueira and Santos, 2013). Therefore, the ratio could potentially be used as an index of inhibition outside of just the visual system.

Discussion

Overall, we found a clear correlation: larger color discrimination errors (FM Error Score) are associated with lower spatial resolution. Additionally, there is a clear sex difference in that females seem to show this correlation, but not males. Figure 1a shows the comparison of the FM Error Score to the acuity of each participant; acuity was derived from a smooth function fitted to the individual participant's data and extrapolated to find spatial frequency at 100% contrast (acuity limit). From the data, we can see that people with lower acuity tend to have larger FM Error Scores. Figure 1b organizes the data by sex to show that only females consistently show this correlation. We also compared the FM Error Scores with sensitivity at 0.6 cyc/deg (the lowest spatial frequency used) [Fig. 7a] and differentiated them according to sex as well (Fig. 7b). These analyses show the same trend. This correlation was also evident when comparing FM Error against peak sensitivity, which was interpolated from the smooth function fitted to the individual's data, (Fig. 8a,b) and sensitivity at 24.4 cyc/deg (Fig. 9a,b). Finally, we also compared the FM Error Score to the ratio between low (0.6cpd) and peak sensitivity, which also showed a similar correlation (Fig. 10a,b).

Results

Abramov

, I., Gordon, J., Feldman, O., &

Chavarga, A. (2012). Sex & vision I: spatio-temporal resolution. Biology of Sex Differences, 3(1), 20.Abramov, I., Gordon, J., Feldman, O., &Chavarga, A. (2012). Sex and vision II: color appearance of monochromatic lights. Biology of Sex Differences, 3(1), 21.Hecht, S. (1949). Brightness, visual acuity and colour blindness. DocumentaOphthalmologica, 3(1), 289-306.Nogueira, R. M. T. B. L., & Santos, N. A. (2013).Visual contrast sensitivity in adults with schizophrenia and relatives not affected. Estudos de Psicologia, 18, 137-143.Watson, A. B., &Pelli, D. G. (1983). QUEST: A Bayesian adaptive psychometric method. Perception & psychophysics, 33(2), 113-120.

References

Human color vision has 3 independent dimensions (e.g. hue, brightness, and saturation). This is based on humans having three different types of cones, designated L, M, and S. While each responds more strongly than the others to long- medium-, and short-wavelength light, respectively, each of the cone types is capable of responding to any wavelength of the visible spectrum (Fig. 1). Responses of different cone types are combined by retinal neurons within a small patch of retina - the neuron’s receptive field. Each receptive field is composed of separate concentric zones of inhibition and excitation of the neuron, whose fiber is part of the optic nerve. Normally, the combined response of the L and M cones (Fig. 2a) maximizes the chromatic differences among wavelengths. However, the receptive field of a colorblind individual that is missing either the L or M type cone should maximize luminance differences (Fig. 2b). This model is the basis of Hecht's (1949) hypothesis that the colorblind individual will have better acuity. However, he failed to find this, probably due to his relatively crude methodology (eye chart).


In our studies, we use a more complex method based on Fourier's Theorem: any pattern is equivalent to a set of sinusoidal components. To apply this to the visual system, we use grating patterns whose luminance profile varies sinusoidally from high to low, where the number of cycles of a grating within one degree of visual space defines the spatial frequency of that grating (Fig. 3a). The components of any image are filtered by the sensitivity of our visual system to each sinusoidal component - the contrast sensitivity function (CSF) [Fig. 3b]. We ask if, in general, CSF correlates with individual color vision. This builds on our previous reports of sex differences in color and spatial vision (Abramov, Gordon, Feldman, and Chavarga 2012a,b). It is important to note that our analysis involves entirely color-normal participants; that is, any errors in color discrimination are within the normal color-vision range.

Introduction

-L

+L

Fig. 6a

Fig. 9a

Fig. 10a

Fig. 8b

Fig. 9b

Fig. 8a

Fig. 7a

Fig. 6b

Fig. 10b

Fig

. 1

Fig. 2a

Fig. 2b

Fig. 3b

Fig. 3a

Fig. 5

Fig

. 4b

Fig. 4a

Fig. 7b

Coarse

Fine