/
Important Vocabulary Important Vocabulary

Important Vocabulary - PowerPoint Presentation

test
test . @test
Follow
391 views
Uploaded On 2015-11-29

Important Vocabulary - PPT Presentation

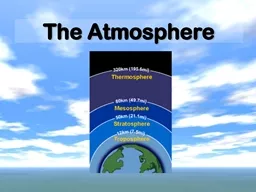
Weather the condition of Earths atmosphere at a particular time and place Atmosphere the envelope of gases that surrounds the planet The Main gases in the Earths Atmosphere 75 Nitrogen ID: 209193

winds air pressure atmosphere air winds atmosphere pressure earth

Share:

Link:

Embed:

Download Presentation from below link

Download Presentation The PPT/PDF document "Important Vocabulary" is the property of its rightful owner. Permission is granted to download and print the materials on this web site for personal, non-commercial use only, and to display it on your personal computer provided you do not modify the materials and that you retain all copyright notices contained in the materials. By downloading content from our website, you accept the terms of this agreement.


Presentation Transcript

Slide1
Slide2

Important Vocabulary

Weather

– the condition of Earth’s atmosphere at a particular time and place.

Atmosphere

– the envelope of gases that surrounds the planetSlide3

The Main gases in the

Earth’s Atmosphere

~ 75% Nitrogen

21% Oxygen

Less than 1% Carbon Dioxide

Argon makes up most of the other 1%Slide4
Slide5

Atmosphere

The atmosphere is a

system

that interacts with other Earth systems.

Events

in one part of the atmosphere

affect other parts

of the atmosphere.Slide6

Air Pressure

Because air has

mass

, it also has other properties, including

density

and

pressure

.

Density

– the amount of mass in a given volume of air D = M/VAir Pressure – the result of the weight of a column of pushing on an area P = F/ASlide7

Instruments to measure air pressure

Barometers

Mercury barometer

Consists of a long glass tube that is

closed

at one end and

open

at another

Aneroid barometer

Aneroid means “without liquid”Has an air tight chamberChamber is connected to a dial by a series of springs and levers.When pressure increases, the thin walls of the chamber are

pushed in. When the pressure drops, the walls bulge out.Slide8
Slide9

Units of air pressure

Most weather reports for the public use

inches of mercury

.

(Ex. The air pressure is 30 inches)

The National Weather Service maps indicate air pressure in

millibars

.Slide10

The pressure of the atmosphere is equal to

1 bar (1000

millibars

)

.

1 inch of mercury =

33.86

millibars30 inches of mercury = ~ 1,016 millibarsSlide11

Standard air pressure at sea level is

29.92

inches of mercury. A mercury reading higher than 30.20 inches, with rising or steady pressure generally indicates

fair weather

, becoming cloudy and warmer with rapidly falling pressure. A mercury reading from 29.80 inches to 30.20 inches with rapidly falling pressure means precipitation is coming. A mercury reading under 29.80 inches with rising or steady pressure means it will start to clear and become

cooler

, with slowly falling pressure it is an indication of

precipitation

, and rapidly falling pressure would indicate a

storm.Slide12

Plickers

?

This barometer uses air tight chamber WITHOUT liquid to measure air pressure.

A.) Mercury Barometer

B.) Annathermometer

C.) Aneroid Barometer

D.) All barometersSlide13

Plickers

?

Most of the atmosphere is made up of ____.

A.) Oxygen

B.) Carbon Dioxide

C.) Argon

D.) NitrogenSlide14

Altitude

A.K.A

elevation

, which is the

distance above sea level

Sea level –

average level of the oceans

.

Indiana is about

700 feet above sea level.Air pressure decreases as altitude increases.Analogy - Stack of booksAs air pressure decreases, so does density.Slide15

Altitude continued…

As you go

up

through the atmosphere, the

density of the air decreases.

Density = mass / volume

Air contains

21% oxygen

, whether you are at sea level or on top of a mountain, but since there is more space(volume) at the top of a mountain, the density

decreases. Therefore, the air you breathe at the top of a mountain has fewer oxygen molecules per cubic meter than at sea levelSlide16
Slide17

Plickers

?

Where is the atmospheric pressure the greatest?

A.) closest to earth

B.) in the middle of the atmosphere

C.) at a high altitude

D.) closest to spaceSlide18

Layers of the atmosphere

Scientists have divided Earth’s atmosphere in to main layers, which are classified by changes in

temperature

.

Troposphere

Stratosphere

Mesosphere

ThermosphereSlide19

Question

Where is most of the gas in the atmosphere found?

Close to Earth’s surfaceSlide20

Troposphere

Where we

live

Inner

, or lowest layer of Earth’s atmosphere

Tropo

– means

turning or changing

Weather

takes place in this layerAverage thickness is ~ 12 km Shallowest and most dense layerContains almost all the mass of the atmosphereAltitude goes , temperature goes

Water at the top of this layer forms thin, feathery clouds of iceSlide21

Stratosphere

Above troposphere

12km – 50 km

above Earth’s surface

Strato

means layer or spread out

Contains

ozone (O3)The ozone layer filters out UV light and absorbs energy from the sun, which warms the air in this layerSlide22

Ozone over timeSlide23

Mesosphere

Meso

– means

middle

50 – 80 km

above the Earth’s surface

Protects Earth’s surface from being hit by

most

meteroidsSlide24

Thermosphere

Outermost layer

80 km

above Earth’s surface

outward into space

No definite outer limit

2 layers

aurora borealis

Ionosphere

exosphereSlide25

Plickers

?

What layer of the atmosphere do we live in?

A.) Troposphere

B.) Stratosphere

C.) Mesosphere

D.) ThermosphereSlide26
Slide27

Plickers

?

Which layer means middle layer?

A.) Troposphere

B.) Stratosphere

C.) Mesosphere

D.) ThermosphereSlide28

Plickers

?

Which layer of the atmosphere does weather occur in?

A.) Troposphere

B.) Stratosphere

C.) Mesosphere

D.) ThermosphereSlide29

Energy in Earth’s Atmosphere

Electromagnetic waves – form of energy that can move through the vacuum of space

Most of the energy from the sun travels to Earth in the form of visible light and infrared radiation. A smaller amount arrives as ultraviolet radiation.Slide30

Visible Light

Only part of the spectrum we can see

ROY G BIV

Red

Orange

Green

Blue Indigo VioletSlide31

Radiation – the direct transfer of energy by electromagnetic waves

Infrared radiation is not visible by humans, but can be felt as heat.

The sun gives off ultraviolet radiation.

Ultraviolet radiation can cause sunburns.Slide32

Some sunlight is absorbed or reflected by the atmosphere before it can reach the surface. The rest passes through the atmosphere to the surface.Slide33

Scattering – dispersing light in all directionSlide34

Why is the sky blue?

When you look at the sky, the light you see has been scattered by gas molecules in the atmosphere.

Gas molecules scatter short wavelengths of visible light (B + V) more than long wavelengths (R + O)

Scattered light looks bluer than ordinary sunlight.

That’s why the clear daytime sky looks blue.Slide35

Greenhouse effect

Earth’s surface radiates some energy back into the atmosphere as infrared radiation.

Much of the IR radiation doesn’t immediately travel all the way back into space.

Instead, it is absorbed and held by water vapor, CO

2

, methane, and other gases in the air.Slide36

The greenhouse effect is a natural process. It keeps Earth’s atmosphere at a comfortable temperature

.

Over time, the amount of energy absorbed by the atmosphere and Earth’s surface is in balance with the amount of energy radiated into space.

In this way, Earth’s average temperatures remain fairly constant.Slide37
Slide38

Winds

Differences in air pressure cause the air to move.

Wind - the movement of air parallel to Earth’s surface.

Most differences in air pressure are caused by the unequal heating of the atmosphere.Slide39

Measuring wind

Wind direction is determined by a weather vane.

Anemometer – measures wind speed

Windchill

Factor – the increased cooling that a wind can cause

The temp outside is 20 °F, but with a wind speed of 30 mph, the

windchill

factor makes it feel like 1 °

F

Slide40

Local Winds

Winds that blow over short distances are called local winds.

Local winds are caused by the unequal heating of Earth’s surface within a small area.

These winds form only when large scale winds are weak.

2 types of local winds

Sea breezes

Land breezesSlide41

Local vs. Global

Like local winds, global winds are created by the unequal heating of the Earth’s surface.

Unlike local winds, global winds occur over a large area.Slide42

Global winds and the jet stream have an effect on weather and climatic conditions on Earth.

Global winds

are found in each

convection region.

Because

convection cells are in place in the atmosphere and Earth is spinning on its axis, these global winds appear to curve. This is known as the

Coriolis

effect

.

Global winds

MENUSlide43

In the global wind belt regions, the prevailing direction of the winds and how air movement in these large regions affects weather conditions.

The

trade winds

blow from east to west in the tropical region moving warm tropical air in that climate zone.

Global windsSlide44

Doldrums – calm area where warm air rises

Horse latitudes – 2 calm areas of sinking air

Trade winds blow from the horse latitudes toward the equator

Prevailing

westerlies

blow from west to east

Polar easterlies blow cold air away from the polesSlide45

The prevailing

westerly winds

blow from west to east in the temperate region.

The temperate zone temperatures are affected most by the changing seasons, but since the westerly wind belt is in that region, the weather systems during any season move from west to east. Since the United States is in the westerly wind belt, the weather systems move across the country from west to east.

Global windsSlide46

Global Winds

Convection can cause global winds. These winds then move weather systems and surface ocean currents in particular directions.

Due to the spinning of Earth, the weather systems in these regions move in certain directions because the

global wind belts

are set up.Slide47
Slide48
Slide49
Slide50
Slide51
Slide52

Invention of weather instruments

1500’s Galileo invented water thermometer

1643 Torricelli invented mercury barometer

1667 Hooke invented anemometer

1719 Fahrenheit developed temp scale based on boiling/freezing water

1735 Hadley explained how the earth’s rotation influences winds in tropics

1742 Celsius developed the centigrade temp scaleSlide53

1787 Charles discovered relationship between temp and a volume of air

1835

Coriolis

used math to demonstrate the effect that the earth’s rotation has on atmos. Motions

1869 first isobars were placed on map

1920 concepts of air masses and weather fronts were formulated in Norway

1940’s upper air

ballons

/3-D view of

atmos

1950’s high speed computers1960 Tiros 1 first weather satelliteSlide54