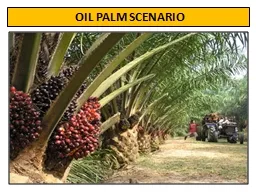
Scientific Name Elaeis guineensis African oil palm Elaeis oleifera American oil palm Economic Cropping period 2530 years First Harvest After 4 years ID: 650822
Download Presentation The PPT/PDF document "OIL PALM SCENARIO CROP DISCRIPTION" is the property of its rightful owner. Permission is granted to download and print the materials on this web site for personal, non-commercial use only, and to display it on your personal computer provided you do not modify the materials and that you retain all copyright notices contained in the materials. By downloading content from our website, you accept the terms of this agreement.
Slide1
OIL PALM SCENARIO Slide2
CROP DISCRIPTION
Scientific Name:
Elaeis
guineensis
(African oil palm)
Elaeis
oleifera
(American oil palm)
Economic Cropping period : 25-30 years
First Harvest : After 4 years
Yield of FFBs/ha/Yr. : 15-30
tonnes
Sources of Oil
:
(
i
)
Mesocarp
: (4-6 tons CPO/ha/annum)
(ii) Kernel :(0.4-0.6 tons CPKO/ha/annum)Slide3
CLIMATE AND SOILS
Rainfall
- 150 mm per month or 2500-4000 mm per annum.
Temperature
- Max. 29-33
O
C and Min. 22-24
O
C
Humidity
- > 80%
Soil
- Loamy Alluvial Soils rich in organic matter. Avoid highly alkaline, highly saline, water lodged and coastal sandy soils.
Irrigation
- 150-200
ltr
. of water per daySlide4
USES OF PALM OIL
Food Products
Non Food Products
Cooking Oil, Dough fat, Vanaspati
Bio fuel and Bio lubricants
Vegetable Ghee
Cosmetic products/Aromatherapy
Margarine
Pharmaceuticals products
Salad Oil
Toiletries, Detergents including soaps & soap Blends
Chocolate/Ice-cream/ Frying fats,
Speciality
fats for coatings
Esters
Coca Butter substitutes
Oleo chemicals, Fatty acids & Fatty AlcoholsSlide5
MAJOR OIL PALM GROWING COUNTRIES
(Area- Million ha, Production- Million Tonne, Yield- Metric Tonne/ha)
S.
No.
Countries
2014-15
Share in World
Production (%)
Area
Production
Yield
1.
Indonesia
7.43
126.68
17.05
46.02
2.
Malaysia
4.69
96.07
20.48
34.90
3.
Nigeria
3.03
7.96
2.62
2.89
4.
Thailand
0.68
12.43
18.17
4.52
5.
Colombia
0.27
5.53
20.75
2.01
6.
Ecuador
0.27
3.47
12.75
1.26
7.
Papua New Guinea
0.16
2.16
13.87
0.78
8.
Brazil
0.13
1.39
11.01
0.50
9.
World
18.75
275.30
14.68
100.00
Sources: FAO StaticsSlide6
MAJOR PALM OIL PRODUCING COUNTRIES
(million MT)
Countries
2012
2013
2014
Share in World (%)
Indonesia
26.01
26.90
29.28
50.87
Malaysia
18.78
19.22
19.67
34.17
Nigeria
0.94
0.88
0.91
1.58
Thailand
1.78
1.97
1.85
3.21
Colombia
0.97
1.04
1.11
1.93
Ecuador
0.32
0.32
0.33
0.57
Papua New Guinea
0.48
0.49
0.50
0.87
Brazil
0.31
0.34
0.37
0.64
World
52.87
54.65
57.56
100.00
Sources: FAO StaticsSlide7Slide8
Strength:
Oil palm gives highest oil yield per unit area (4-5 t oils /ha).
Could reduce dependence on import of edible oil
Provides regular and assured income to farmers
Less vulnerable to pests and diseases
Limited scope for area expansion under oilseed crops
Identified Potential area of more than 1.93 million ha.
Potential for several by-products.
Sufficient R & D Support & network of ICAR
Sufficient availability of planting materials
Support available under MM II (Oil Palm) of NMOOP
OIL PALM CULTIVATIONSlide9
High
initial capital investment
Demands continuous irrigation
Long gestation period (4-5 Years).
Short shelf life of FFBs
Influence of import on FFBs price
Land availability
OIL PALM CULTIVATION IN INDIA
Weakness:Slide10
OIL PALM CULTIVATION IN INDIA
Commercial
plantation at
Thodupuza
, Kerala in 40 Ha (1960)
Systematic plantation in Kerala in 1971 and Andaman & Nicobar islands in 1973
Oil Palm India Limited (OPIL) est. 1977
OPDP started 1992-93 under TMOP
Under ISOPOM from 2004-05 to 2013-14
OPAE a sub scheme of RKVY
from 2011-12 to 2013-14
NMOOP since 2014-15Slide11
SUPPORT UNDER VARIOUS SCHEMES
Period
Programme
VIII-
IX Plan (1992-2003)
OPDP under Technology Mission on
Oilseeds & Oil Palm (TMOP)
X-XI Plan (2004-2013)
Integrated Scheme
on Oilseeds, Pulses, Oil Palm & Maize (
ISOPOM)
Oil Palm Area Expansion (OPAE)
XII Plan (2014-2017)
National Mission on Oilseeds and Oil Palm (NMOOP)
11Slide12
POTENTIAL OIL PALM STATES
State
Potential Area
(ha)
Andhra Pradesh
469500
Karnataka
260000
Tamil Nadu
205000
Gujarat
260250
Maharastra
180000Chattishgarh48000Kerala6500Odisha56000Bihar 200000West Bengal25000Total 17,10,250Slide13
OTHER POTENTIAL STATES/UT
NE States & Others
Potential Area
(ha)
Mizoram
61000
Assam
25000
Arunachal Pradesh
25000
Tripura
7000
Meghalaya
50000Nagaland50000Goa2000Andaman & NI3000TOTAL223000Slide14
STATE WISE AREA AND PRODUCTION OF
FFBs
AND CPO (2015-16)
State
Area coverage
(ha)
FFBs Production
(in MT)
CPO Production
(in MT)
Andhra Pradesh
1,50,530
11,44,092
1,93,562
Telangana
16,239
63,508
11,289
Karnataka
41,431
14,740
2,538
Tamil Nadu
29,510
7,810
1,222
Gujarat
5,054
523
0
Goa
953
3,217
581
Odisha
18,484
4,569
618
Tripura
530
0
0
Assam
570
0
0
Kerala
5,769
40,611
7,016
Maharashtra
1,474
0
0
Mizoram
25,741
3,753
432
Chhattisgarh
2162
0
0
Arunachal Pradesh
330
0
0
Andaman & Nicobar
1,593
0
0
Nagaland
140
0
0
Total
3,00,510
12,82,823
2,17,258Slide15
STATES AND AGENCIES
Out of 20 states following 12 are implementing the
programme
-
States: Andhra Pradesh, Chhattisgarh,
Gujarat, Karnataka, Kerala, Odisha, Tamil Nadu, Telangana, Arunachal Pradesh, Assam, Mizoram and Nagaland
Agencies: Indian Institute of Oil Palm Research (IIOPR), Pedavegi, Andhra Pradesh
15Slide16
STATE-WISE DISTRICTS COVERED
S.
No
State
No.
of Districts
Name. of District
1.
Andhra Pradesh
8
East Godavari, Krishna, Nellore, Srikakulam,
Vishakapatnam
,
Vizianagaram, West Godavari and Ananatapur 2.Telangana4Nalgonda, Bhadradri, Suryapet
and Khammam
3
Chattisgarh
11
Kanker
,
Mahasammund
,
Dantewada
,
Jagadalpur, Sukma, Durg, Balod, Raigarh, Janjgir Champa
,
Bilaspur
and
Korba
4.
Goa
2
North Goa, South Goa5.Gujarat11Anand, Tapi, Narmada, Bharuch, Panchmahel, Kheda, Navasari, Surat, Vadodara, Valsad and Chotha Udepur6.Karnataka
23Belagaum, Uttar Kannada, Davangere, Haveri, Bellary , Gadag, Koppal, Raichur, chamarajnagar, Hassan, Kodagu, Mandya, Mysore, Chikmagalur, Shimoga, Bagalkote, Bijapur, Gulbarga7.Kerala9Trivandrum, Kollam, Alappuzha, Pathanamihitta, Kottaym, Ernakulam, Kozhikode, Malappuram and Wyanadu8.Mizoram7Aizwal, Kolasib, Lawngtlai, Lunglei, Mamit, Saiha and Serchhip9.Odisha15Dhenkanal, Gajapati, Ganjam, Jajpur, Mayurbhanja, Balasore, Boudh, Cuttack, Nawrangpur, Koraput, Nayagarh, Rayagada, Sonepur, Bargarh and Bhadrak, 10.Tamil Nadu26 Trichy, Karur, Cuddalore, Peramabalur, Thanjavur, Theni, Thiruvarur, Nagapattinam, Tirunelveli, Vellore, Villupuram, Pudukottai, Aryalur, Dindugal
, Virudhnagar, Sivagangai
, Kancheepuram, Triuvallur, Tiruvannamalai, Salem, Namakkal, Dharampuri
, Krishnagiri, Coimbatore, Tiruppur and Erode11.Nagaland
6
Dimapur
,
Peren
,
Mokokchung
,
Wokha
, Mon and
Longleng
12.
Assam
3
Kamrup
,
Goalpara
and
Bongaigaon
13.
Arunachal Pradesh
8
Lohit
,
Changlang
,
Tirap
, Lower
Dibang
Valley, East Siang, West Siang, L/
Subansri
and
Papum
Pare & East
Kameng
Total
133Slide17
STRATEGIES
Augmenting availability of planting materials, establishment of new seed garden
Support for maintenance during gestation period and intercropping
Enhancing irrigation through Drip, Pump-set, bore well, water harvesting structure
Support for Oil Palm processing units for NE /Hilly/LW states
Demonstration of oil Palm in farmers fields
Capacity building of field functionaries/extension workers & farmers /input dealers
Support for need based for research on project basisSlide18
PROGRESS DURING XIITH
FIVE YEAR PLAN
Year
Name of Scheme
Oil Palm Area Expansion
(ha)
Amount (Rs. in lakh)
Target
Achievement
Allocation
Release
2012-13
ISOPOM & OPAE
499322630022705.746412.622013-14ISOPOM & OPAE
41347
23183
19776.19
11849.09
2014-15
NMOOP
28146
17143
7290.58
4112.47
2015-16
NMOOP
27337
14425
6683.80
3823.49
2016-17*
NMOOP
30061133488038.684241.57Total1768239439964494.9930439.24* Upto January, 2017Slide19
DOMESTIC COST OF FFBs (2010)
Initial cost
Ist Year
2
nd
Year
3
rd
Year
Total
Annuity value
Juvenile period (JP): 1-3 Yrs.
103827
1273529903433021312230Infrastructure Development (ID)Bore well, motors, pumps, transformer, micro irrigation, farm shed, fencing, implements etc 35964014652Cost of Cultivation
4
th
Year
Yield of FFBs
Cost of FFBs
Stabilizing period :4-8
Yrs
(adding
Annuity value of JP)
127122
12.38 t/ha10268
Stabilizing period :4-8
Yrs
(adding a
nnuity value of JP & ID)
141774
12.38 t/ha
11451
Stabilized period: 9-30 years (adding annuity value of JP)13741619.81 t/ha6936Stabilized period: 9-30 years (adding annuity value of JP & ID)15206819.81 t/ha7676
Source : IIOPR - ICAR, Pedavegi(Rs/ha) Slide20
FFBS PRICE FIXING MECHANISM
13.54 % of net crude palm oil (CPO) weighted average price, based upon 18 % Oil Extraction Ratio (OER), plus 75.25 % on 9 % recovery of palm kernel nuts weighted average price.
This is based on estimated cost of cultivation at 75.25 percent in the total cost of production of CPO from farm level to factory level.
OER would be determined as per actual oil content extracted in the past by the processing industry.
Import duty should be triggered at US$ 800/MT.Slide21
Sl
. No
.
Month
FFB
Price Rs. per MT
Nov.,13 to Oct., 14
Nov., 14 to Oct., 15
Nov. 15 to Oct., 16
1
November
7900.00
6598.00
5733.00
2
December
7951.00
6370.00
5647.00
3
January
7824.00
6803.00
5837.00
4
February
7926.00
6557.00
6129.00
5
March
8441.00
6595.00
6963.00
6
April
8267.00
6421.00
7586.00
7
May
7938.00
6473.00
7839.00
8
June
7510.00
6601.00
7494.00
9
July
7472.00
6240.007250.0010August 7071.005722.007792.0011September 6424.005352.008434.0012October 6589.005731.008142.00
Sl. No.MonthCPO Price Rs. per MTNov.,13 to Oct., 14 Nov., 14 to Oct., 15Nov. 15 to Aug, 161November 55565.6144234.9439048.372December 55467.6542509.6038407.213January 53926.6545793.7939865.274February 54240.2343931.2741509.735March58105.4844213.0446897.426April56514.6742949.7151682.167May53994.9043340.5552406.808June 52020.2744262.6950392.639July 51984.5742757.4848065.5210August 48380.4738974.0751259.9811September 45191.8936161.0612October 45061.4738495.04
PRICES OF CPO AND FFB FOR THE OIL YEAR (NOV TO OCTOBER)Slide22
DOMESTIC & INTERNATIONAL PRICES OF CPO
Year
Domestic
International
Differences
2012
52250
51633
2898
2013
53256
48240
2715
201447819490521462201540524385153013(Rs./MT) Slide23
LESSONS LEARNT FROM EXPOSURE VISIT TO MALAYSIA
Indian delegation lead by Joint Secretary (Oilseeds) visited Malaysia 22-25 August, 2016. Observations include-
Adoption of high density plantation;
Import of high yielding genotypes (
Calix
,
Guthini
etc.);
Exchange of germplasm; and
Improvement of nursery rather than depending on import.Slide24
INITIATIVES TAKEN BY GOVERNMENT OF INDIA
A proposal submitted to Ministry of Finance on 13.02.2017 for imposing a cess of 0.5% on import of crude palm oil (CPO) and refined bleached deodorized palmolein (RBDPL) for creation of ‘Edible Oil Development Fund’ (EODF).
A Cabinet Note on “Measures to increase oil palm area and production in India” submitted to the Cabinet Secretariat on 13.02.2017 for relaxation of land ceiling limit for oil palm cultivation and revision of norms of assistance under Mini Mission-II of NMOOP.
A study on feasibility of oil palm cultivation in four districts of Bodoland Territorial Council (BTC) of Assam undertaken by Indian Institute of Oil Palm Research (IIOPR), Pedavegi.
In order to protect the farmers from distress, Govt. of India is implementing the Market Intervention Scheme (MIS) for providing financial support to the oil palm growers.
A study has been assigned
to Dte. of E&S for assessment of performance of indigenous and imported seedling in three major oil palm growing States viz, Andhra Pradesh, Karnataka and Tamil Nadu.
100% FDI has also allowed for oil palm crop through automatic route. The benefits of 100% FDI in oil palm would be possible only after declaration of oil palm as a plantation crop. In this regard, a letter has been written to all Chief Ministers of the concerned states in the month of January, 2016.Slide25
PROCESSING MILLS IN DIFFERENT STATES
Sl. No.
Name of the Unit
Sector
Processing capacity
(in tonnes per hr)
Andhra Pradesh
1
APOILFED, Pedavegi-West Godavari
A.P. Govt. Subsidiary Unit
15
2
M/s.
Radhika
Veg. Oil Pvt. Ltd.,
Garividi-Vijaya
Nagaram
Pvt.
10
3
M/s. RSIL,
Ampapuram
-Krishna Distt.
Pvt.
40
4
Simhapuri Agro Products Ltd., Manubrola-Nellore
Pvt.
Under Construction
5
M/s. Godrej Oil Palm ltd., Pothepalli-West Godavari Distt.Pvt.406M/s. Godrej Agrovet, Oil Palm ltd., ChintampalliPvt.
307M/s. RSIL, Peddapuram-East Godavari Distt.Pvt.308M/s. Nav Bharat Agro Products, Jangareddygudem-West Godavari Distt.Pvt.3093F Oil Palm Agrotech Pvt. Ltd. Yernagudem Village Devarapalli Mandal West Godawari Distt.Pvt.3010M/s. Agro Co-operative Corporation, Butchiyyapeta (M), Vishakhapattnam Dist.Pvt.511M/s Sri Srinivasa Palm Oil Mill, Srikakulam dist.Pvt.512M/s Subrahmanyeswara Agro Products, Siripalli Ainavilli Mandal, East GodavariPvt.513M/s Lakshmi Balaji Oils, Tekarandi (V), Vizianagram dist.Pvt.Under ConstructionTotal240Slide26
PROCESSING MILLS IN DIFFERENT STATES (CONTD)
Telangana
14
A.P. Oilfed (Khammam District)
A.P. Govt. Subsidiary Unit
10
Total
10
Karnataka
15
M/s.
Bhadravathi
Balaji
Oil Palm Ltd. (BBOP Ltd.),
Shimoga
Joint Venture of State & M/s. B.B.O.P.Ltd.
10
16
Govt. Oil Palm Processing mill,
Kabini
, Mysore. Leased to M/s
Ruchi
Soya industries Ltd.
State Government (leased to M/s. Ruchi Soya industries Ltd.)
1
17
M/s. Simhapuri Agri Tech Company Pvt. Ltd., Davangere
Pvt.
5
18
M/s. 3F Oil Palm Agrotech.,
KoppalPvt.5
Total21Tamil Nadu19M/s. Godrej Agro Ltd., Varanasi, Ariyalur dist.Pvt. 2.5Total 2.5Kerala20OPIL, Yerror Estate, KallamPublic Sector 20Total 20Slide27
PROCESSING MILLS IN DIFFERENT STATES (CONTD)
Andaman & Nicobar
21
Andaman & Nicobar Islands
State Government
4
Total
4
Gujarat
22
Shri Kalyan Agri. Crops Sales & Processing Coop. Society Ltd.,
Navasari
Cooperative Sector
2.5*
Total
2.5
Goa
23
M/s. Godrej Agrovet Ltd., Ponda, Goa
Pvt.
2.5*
Total
2.5
Odisha
24
M/s
Lakshmi
Balaji Oil Mills (P) Ltd.
Attada
,
Rayagada
Pvt.
5
Total5Mizoram25M/s Godrej Agrovet Ltd. Kolasib Dist.Pvt.526M/s Ruchi Soya Industry Ltd.,Pvt.To be established27M/s 3F Oil palm Agrotech.Pvt.To be establishedTotal 5Grand Total
312.50
* expending up to 5 tonesSlide28
OIL PALM SEED GARDENS
Location of the seed garden
Year
of planting
Sprout production (in Lakh)
Potential
Present level
(2013-14)
Scope for enhancement
Seed Garden
Indian Institute of Oil Palm Research, Pedavegi (A.P.)
2000
6.0
3.1
2.9
2. Indian
Institute of Oil Palm Research-Research Centre,
Palode
, (Kerala)
1982
8.0
3.1
4.9
3. M/s
.
Navabharath
Private Ltd.,
Lakshmipuram
(A.P.)
1990
6.0
3.8
2.2
4. Department of Horticulture, Rajahmundry (A.P.)199210.04.75.35. Oil Palm India Limited, Thodupuzha (Kerala)199411.06.05.06. Department of Horticulture, Taraka, (Karnataka)19948.03.74.3Total49.024.424.6Morumpudi, Department of Horticulture, Rajahmundry (A.P.)2012
5.0*
New
-2. Gopannapalem, Department of Horticulture, Rajahmundry (A.P.)
2014
5.0**
New
-
3.
Taraka
(
Taraka
-II), Department of Horticulture,
Taraka
, Karnataka
2012
5.0*
New
-
4. Kabini, Department of Horticulture, Taraka, Karnataka20128.0*New-Total23.0* Expected year of initiation of seed production-2020** Expected year of initiation of seed production-2020Slide29
AVAILABILITY OF IMPORTED/DOMESTIC SPROUTS AND AREA COVERAGE
Types of Sprouts
Number of sprouts (lakh) and area coverage (ha)
2010-11
2011-12
2012-13
2013-14
Total
Imported
26.00
34.00
70.50
40.20
170.70
Domestic
8.46
16.22
20.32
24.40
57.24
Area Covered
17,925
28,388
26,300
22,948
95,561Slide30
FOCUS ON NORTH-EASTERN STATES
An area of 2.23 lakh ha has been identified potential for Oil Palm cultivation by Dr. Rethinam Committee in NE states.
All NE States are covered under NMOOP for Oil Palm cultivation. Presently, four states namely Mizoram, Assam, Arunachal Pradesh and Nagaland are implementing the programme.
In the state of Mizoram, more than 27,000 ha area has been achieved under Oil Palm cultivation.
One Oil Palm processing mill has been established by M/s Godrej Agrovet Ltd. and now in operation.
Special provisions have been made for NE/Hilly states for construction of roads from Oil Palm fields to nearest FFBs collection/processing centers and establishment of Oil Palm processing mills.
Interventions of MM-II are being shared in the ratio of 90:10 between Central and State Government.Slide31
Thank You