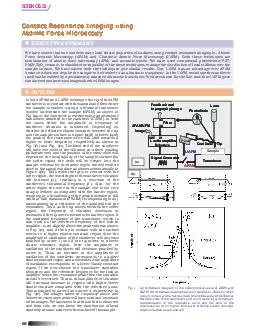
Atomic Force Acoustic Microscopy AFAM and Ultrasonic Atomic Force Microscopy UAFM Both these techniques are combination of atomic force microscopy AFM and acoustic waves We have used commercial piezoelectric PZT PbZrTiO ceramic to elucidate the capa ID: 27043
Download Pdf The PPT/PDF document "OUTLINE EXECUTIVE SUMMARY Contact Reson..." is the property of its rightful owner. Permission is granted to download and print the materials on this web site for personal, non-commercial use only, and to display it on your personal computer provided you do not modify the materials and that you retain all copyright notices contained in the materials. By downloading content from our website, you accept the terms of this agreement.
ContactResonanceImagingusingAtomicForceMicroscopyWehaveshownthatonecandeterminelocalelasticpropertiesofsurfacesusingcontactresonanceimagingie.,AtomicForceAcousticMicroscopy(AFAM)andUltrasonicAtomicForceMicroscopy(UAFM).Boththesetechniquesarecombinationofatomicforcemicroscopy(AFM)andacousticwaves.WehaveusedcommercialpiezoelectricPZT,Pb(Zr,Ti)Oceramic,toelucidatethecapabilityofthethesetechniquestoimagethedistributionoflocalstiffnessoverthesamplesurface.Wehaveshownboththetechniquesgivesimilarresults.But,UAFMhasanadvantageoverAFAMbecauseitdoesnotrequirethesampletobebondedtoanultrasonictransducer.IntheUAFMtechniquethecantileveritselfcanbeexcitedbyapermanentlyattachedultrasonictransducer.WehaveshownforthefirsttimethatUAFMgivessimilarcontrastinversionimagesliketheAFAMimages.InbothAFAMandUAFMtechniquethetipoftheAFMcantileverisincontactwiththesampleandtheneitherthesampleisexcitedusingaultrasonictransducerbondedunderneaththesample(AFAM)asshowninFig.1(a)orthecantileverisexcitedusinganultrasonictransducerattachedtothecantilever(UAFM).Inboththecaseseithertheamplitudeorfrequencyofcantilevervibrationismonitored.Dependingonwhethertheeffectiveelasticconstantbetweenthetipandthesamplesurfaceishigher(stiff)orlower(soft)thepeakoftheresonancecurvewillshifttowardsahigherorlowerfrequency,respectivelyasshowninFig.1(b)andFig.1(c).Thefixedendofthecantileverwillhaveonenodeofthevibrationatafixedposition(substrateend)andthepositionoftheothernodewilldependonthelocalrigidityofthesamplesurface(forthesofterregionthenodewillbedeeperintothesample,whereasfortheharderregionthenodewillbeclosetothesamplesurfaceasshownschematicallyinFigure1(b)).Thuswhenthetipisincontactwiththesofterregion,thewavelengthofthecantilevervibrationwillincrease(),resultinginadecreaseofthecantilever'svibrationalfrequency(f).Also,forthesofterregionthenodeatthesampleaccompaniedbyareductionoftheamplitudeattheresonance.Thus,asthetipmovestowardsthesofterregion,thefrequencyofvibrationdecreasesorincreasesifthetipmovestowardstheharderregion.Iftheexcitationfrequencyofthetransducer,whichisalsousedasthereferencefrequencyofthelock-inamplifier,issetslightlyabovethepeakvalueasshowninFig.1(c),andifthetipincontactwiththesurfacemovestoahigherelasticconstantregionthentheamplitudeofoscillationofthecantileverwillincrease(markedbyarrow1)andifthetipmovestoalowerelasticconstantregion,thentheamplitudeofoscillationofthecantileverwilldecrease(markedbyarrow2).Thusanincreaseintheamplitudeofoscillationofthecantilevercorrespondstoahigherelasticconstantregionandadecreaseintheamplitudeofoscillationcorrespondstoalowerelasticconstantregion.Ifwenowchoosethetransducerexcitationfrequencyandthereferencefrequencyforthelock-inamplifierbelowtheresonancepeakthenthesituationshouldbereversed.Thatis,theamplitudeofvibrationwilldecrease/increaseinregionswithhigher/lowerelasticconstantcomparedwiththereferencepoint.Thisismarkedbyarrow3andarrow4,respectively,inFig.1(c).Theimagestakenatfrequencyaboveandbelowtheresonancepeakwillhavecontrastinversionoftheimages.Wehaveseenthatthisinfactisobservedandfromthiswecanknowthedistributionoflocalelasticityatnano-scaleoverthesurfaceofthesample.endisnotverysharplydefinedascomparedwiththeharderregion,resultinginabroadeningofthepeak(increaseinfullwidthathalfmaximum(FWHM)correspondingtoFig.1:(a)SchematicdiagramoftheexperimentalsetupofAFAMandUAFM.(b)Schematicrepresentationofcantilevervibrationwhentipisincontactwithahardsurface(thenodesarewelldefinedatboththeendsofthecantilever)andasoftsurface(c)Schematicrepresentationoftheresonancecurveandtheshiftoftheresonancecurveforhigherandlowereffectiveelasticconstantregionsmarkedassoftandstiff -inamplifierSignalGenerator ACHIEVEMENT Fig.2:AFAMimageshowingin(a)stiff(bright)andsoft(dark)striperegionsandin(b)thestiff(dark)andsoft(bright)striperegions.(c)and(d)showstheschematicrepresentationofthePZTunitFig.3:AFAMandUFMimagesofpolishedbulksinteredpolycrystallinePZTsample.(a)and(b)aretheAFAMimagesobtainedwithoperatingfrequencyabove(1387kHz)andbelow(1370kHz)theresonancepeakrespectivelyand(c)and(d)aretheUFMimagesobtainedwithoperatingfrequencyabove(1392kHz)andbelow(1362kHz)theresonancepeak,respectivelyInFig.2(a)and2(b)theimagesobtainedonPZTsampleusingAFAMwithoperatingfrequencyaboveandbelowthecontactresonancepeakvaluerespectivelyareshown.WealsoshowschematicallyinFigures2(c)and2(d)thatdependingontheorientationoftheaxisoftheunitcellwithrespecttotheprobingtip,thesoftandthehardaxescanbeimaged.Sincethepolarizeddomainsareorientedindifferentaxesanddirections,theelasticconstantalongthataxisanddirectionarealsodifferentandhenceweseeadistributionofferroelectricdomainsonthesamplesurface.Wehaveshownthatusingcontactresonancetechniquei.e.,bothAFAMandUAFMtechniquesonecanimagethelocalelasticpropertiesofthesampleatnanoscaleorder.Wehavealsoexplainedthecontrastinversionoftheimageusingasimpleargumentbasedontheresonancecurve,wheretheamplitudeofcantileveroscillationchangesdependingonthe1.S.Banerjee,N.Gayathri,S.Dash,A.K.Tyagi,andBaldevRaj;,(2005)211913.2.S.Banerjee,N.Gayathri,S.R.Shannigrahi,S.Dash,A.K.TyagiandBaldevRaj;(2007)Appl.Phy.LettJ.Phys.D:Appl.Phys.,Furtherinquiries:Dr.S.BanerjeeandDr.A.K.Tyagi,MaterialsScienceDivisionMetallurgyandMaterialsGroup,IGCAR,e-mail:akt@igcar.gov.inTocomparetheAFAMandUAFMtechnique,inFigs.3(a)and3(b)weshowtheAFAMimagesandinFigs.3(c)and3(d)weshowtheUFMimagesobtainedforthePZTsample.Figs.3(a)and3(c)showstheimageswhentheoperatingfrequencywasabovethecontactresonancepeakfrequencyandFigs.3(b)and3(d)showtheimageswhentheoperatingfrequencywasbelowthecontactresonancepeakfrequency.WeobserveclearlybrightanddarkregionsontheAFAMandtheUAFMimagesandalsocontrastinversionwhentheoperatingfrequencyischanged.WehaveshownthatUAFMwhichdoesnotrequireaseparateultrasonictransducerforsampleexcitationalsogivesthesameinformationandcanbeusedtoimagethelocalstiffnessofthesample Wehaveexplainedthecontrastinversionoftheimageusingasimpleargumentbasedontheresonancecurve,wheretheamplitudeofcantileveroscillationchangesdependingonthelocalstiffnessofthematerialdescribedschematicallyinFig.1(b)andFig.1(c). ADDITIONALINFORMATIONABOUTAFAMGENERALEXPLANATION:COMPARISONOFAFAMANDUFAMBRIEFDESCRIPTIONOFTHEORETICALBACKGROUNDPUBLICATIONSARISINGOUTOFTHISSTUDYANDRELATEDWORK