PPT-Figure 1.
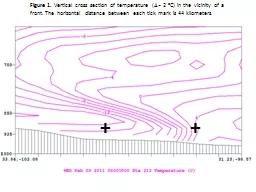
Vertical cross section of temperature D 2 o C in the vicinity of a front The horizontal distance between each tick mark is 44 kilometers Figure 2 Vertical cross
Download Presentation
"Figure 1." is the property of its rightful owner. Permission is granted to download and print materials on this website for personal, non-commercial use only, provided you retain all copyright notices. By downloading content from our website, you accept the terms of this agreement.
Presentation Transcript
Transcript not available.