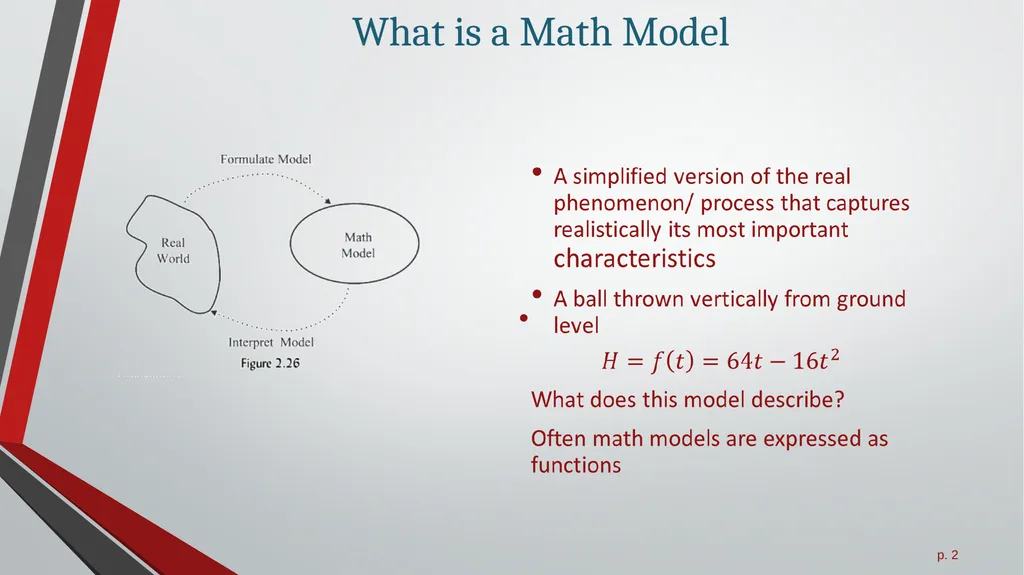
2.4 Mathematical Models All slides in this presentations are based on the book Functions, Data and Models, S.P. Gordon and F. S Gordon ISBN 978-0-88385-767-0 What is a Math Model Avg. daily intake of animal fats and death rates from breast
"2.4 Mathematical Models All slides in this" is the property of its rightful owner. Permission is granted to
download and print the materials on this website for personal, non-commercial use only, and to display it
on your personal computer provided you do not modify the materials and that you retain all copyright
notices contained in the materials. By downloading content from our website, you accept the terms of this
agreement.
Presentation Transcript
01
2.4 Mathematical Models All slides in this presentations are based on the book Functions, Data and Models, S.P. Gordon and F. S Gordon ISBN 978-0-88385-767-0<br>
02
What is a Math Model<br>
03
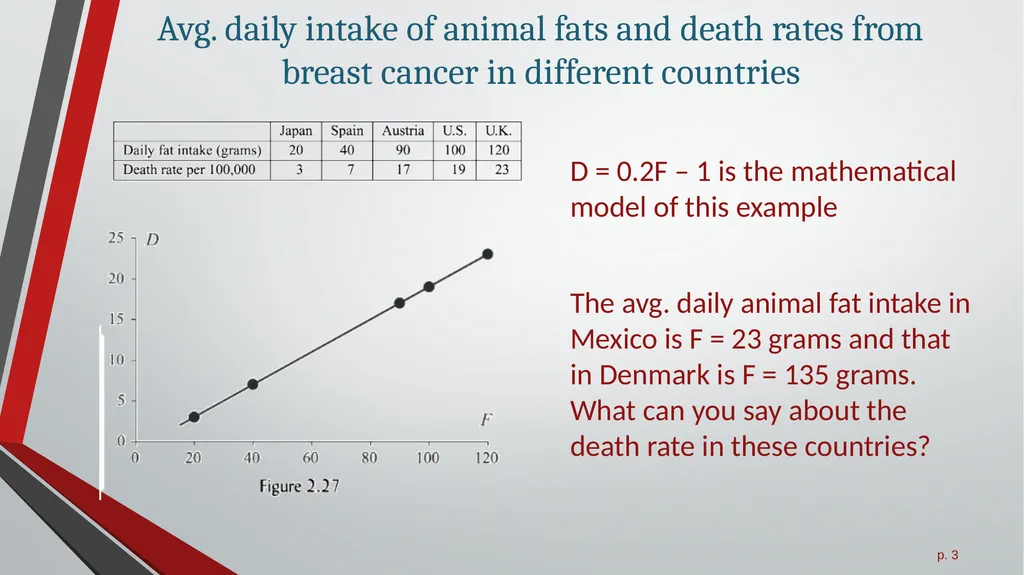
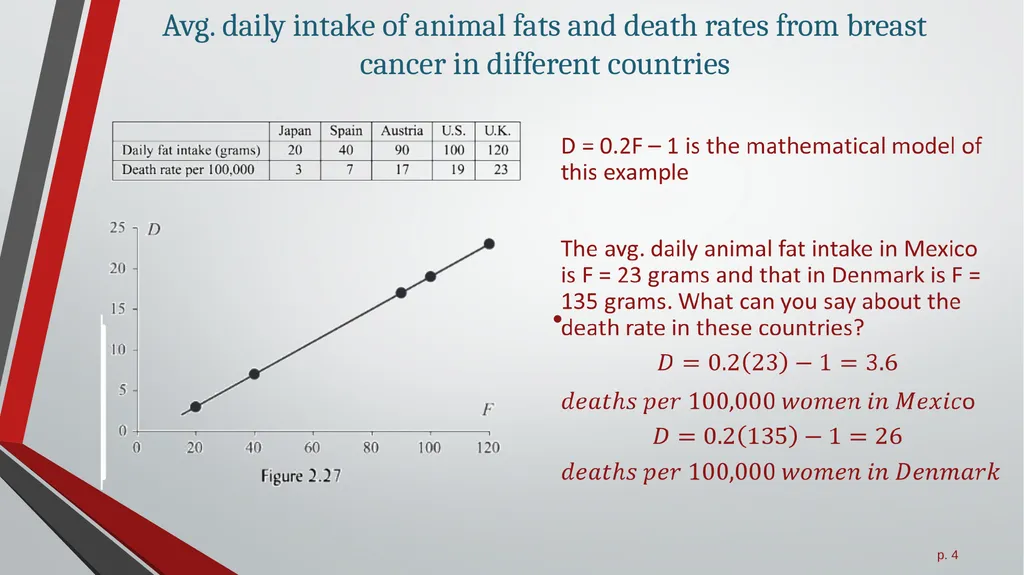
Avg. daily intake of animal fats and death rates from breast cancer in different countries D = 0.2F – 1 is the mathematical model of this example
The avg. daily animal fat intake in Mexico is F = 23 grams and that in Denmark is F = 135 grams. What can you say about the death rate in these countries?<br>
04
Avg. daily intake of animal fats and death rates from breast cancer in different countries<br>
05
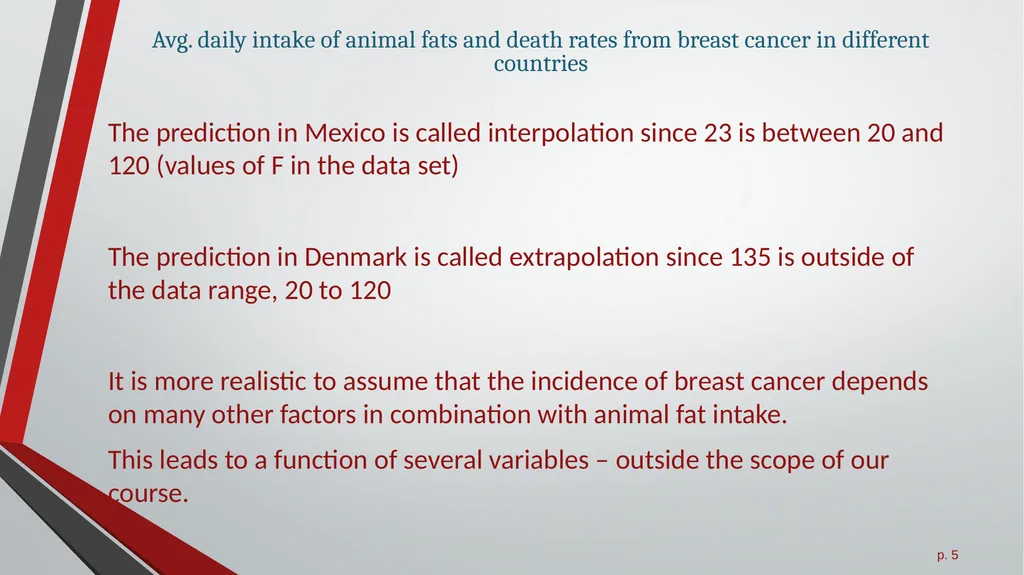
Avg. daily intake of animal fats and death rates from breast cancer in different countries The prediction in Mexico is called interpolation since 23 is between 20 and 120 (values of F in the data set)
The prediction in Denmark is called extrapolation since 135 is outside of the data range, 20 to 120
It is more realistic to assume that the incidence of breast cancer depends on many other factors in combination with animal fat intake.
This leads to a function of several variables – outside the scope of our course.<br>
06
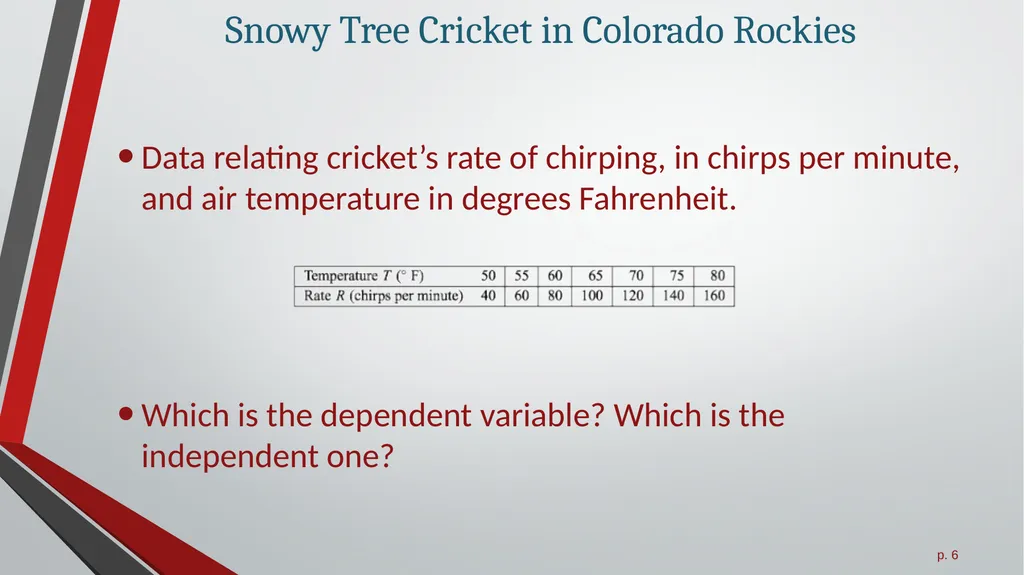
Snowy Tree Cricket in Colorado Rockies Data relating cricket’s rate of chirping, in chirps per minute, and air temperature in degrees Fahrenheit.
Which is the dependent variable? Which is the independent one?<br>
07
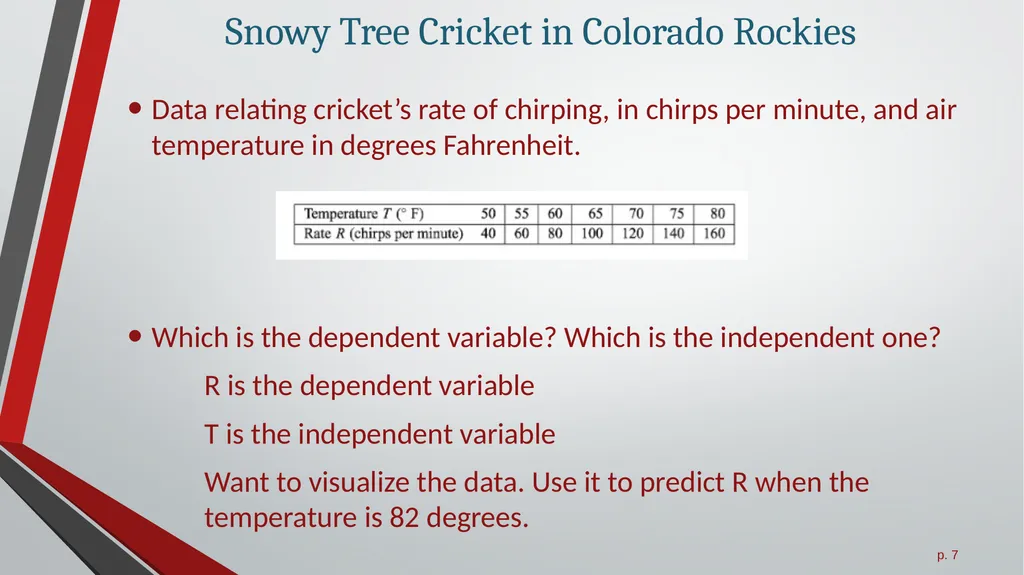
Snowy Tree Cricket in Colorado Rockies Data relating cricket’s rate of chirping, in chirps per minute, and air temperature in degrees Fahrenheit.
Which is the dependent variable? Which is the independent one?
R is the dependent variable
T is the independent variable
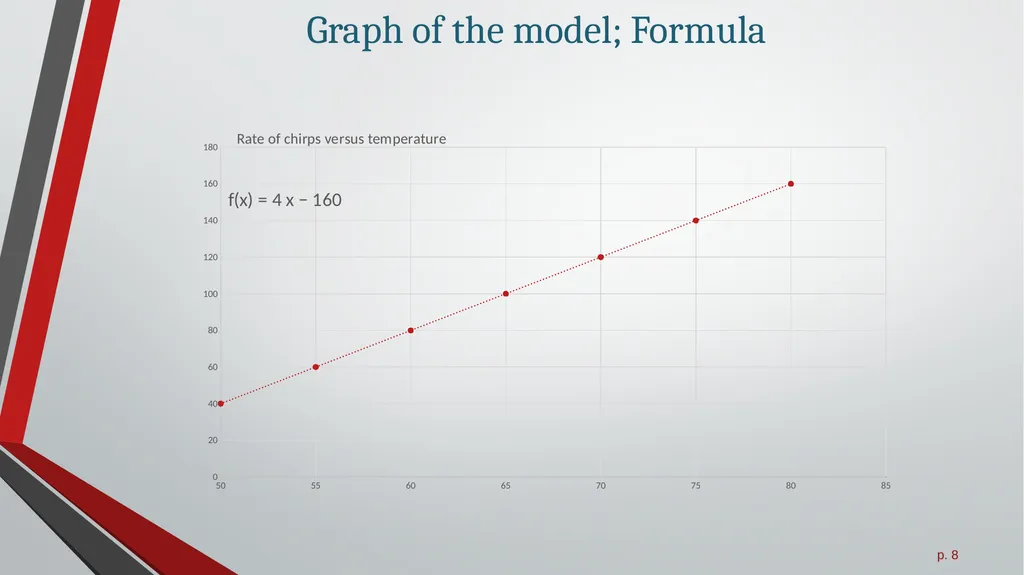
Want to visualize the data. Use it to predict R when the temperature is 82 degrees.<br>
08
Graph of the model; Formula<br>
09
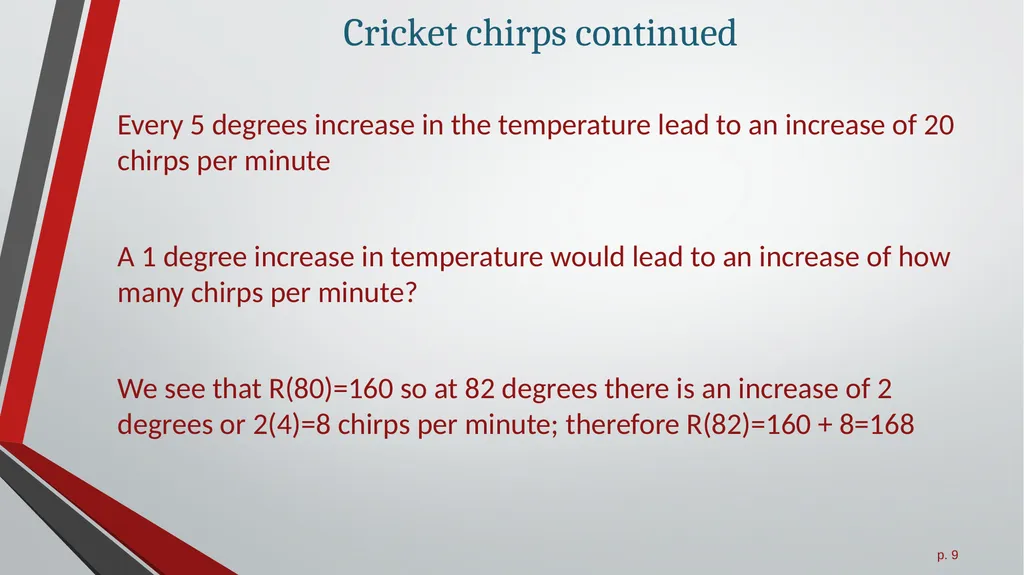
Cricket chirps continued Every 5 degrees increase in the temperature lead to an increase of 20 chirps per minute
A 1 degree increase in temperature would lead to an increase of how many chirps per minute?
We see that R(80)=160 so at 82 degrees there is an increase of 2 degrees or 2(4)=8 chirps per minute; therefore R(82)=160 + 8=168<br>