
2022 Multilevel Intervention Training Institute
A
Published · 62 slides · 0 views

1 / 1








Description
2022 Multilevel Intervention Training Institute Module 10 March 24, 2022 Part III: Quantitative Analytic Techniques II: Moderation and Context Richard Emsley, Ph.D. Kings College London, UK Quantitative Analytic Techniques III: Moderation,
Related Topics
Share
Embed code
Download this presentation From Below
"2022 Multilevel Intervention Training Institute" is the property of its rightful owner. Permission is granted to download and print the materials on this website for personal, non-commercial use only, and to display it on your personal computer provided you do not modify the materials and that you retain all copyright notices contained in the materials. By downloading content from our website, you accept the terms of this agreement.
Presentation Transcript
01
2022 Multilevel Intervention Training Institute
Module 10 March 24, 2022<br>
02
Part III: Quantitative Analytic Techniques II:
Moderation and Context Richard Emsley, Ph.D. King’s College
London, UK<br>
Moderation and Context Richard Emsley, Ph.D. King’s College
London, UK<br>
03
Quantitative Analytic Techniques III: Moderation, mediation and multilevel models Professor Richard Emsley
NIHR Research Professor of Medical Statistics and Trials Methodology
Department of Biostatistics and Health Informatics, Institute of Psychiatry, Psychology and Neuroscience, King’s College London
Slides and joint work with Dr Kimberley Goldsmith<br>
NIHR Research Professor of Medical Statistics and Trials Methodology
Department of Biostatistics and Health Informatics, Institute of Psychiatry, Psychology and Neuroscience, King’s College London
Slides and joint work with Dr Kimberley Goldsmith<br>
04
Learning objectives Understand what is meant by mediator and moderator analysis.
Understand aspects of study designs allowing such analyses to be applied.
To identify suitable quantitative methods for addressing these questions in multi-level interventions. 4<br>
Understand aspects of study designs allowing such analyses to be applied.
To identify suitable quantitative methods for addressing these questions in multi-level interventions. 4<br>
05
Outline of session Part 1:
Explanatory questions in clinical effectiveness and implementation settings
Moderation by baseline variables
Part 2:
Mediation of effects via post-treatment variables
Extensions to multilevel models 5<br>
Explanatory questions in clinical effectiveness and implementation settings
Moderation by baseline variables
Part 2:
Mediation of effects via post-treatment variables
Extensions to multilevel models 5<br>
06
Explanatory Questions in Clinical Effectiveness and Implementation Settings 6<br>
07
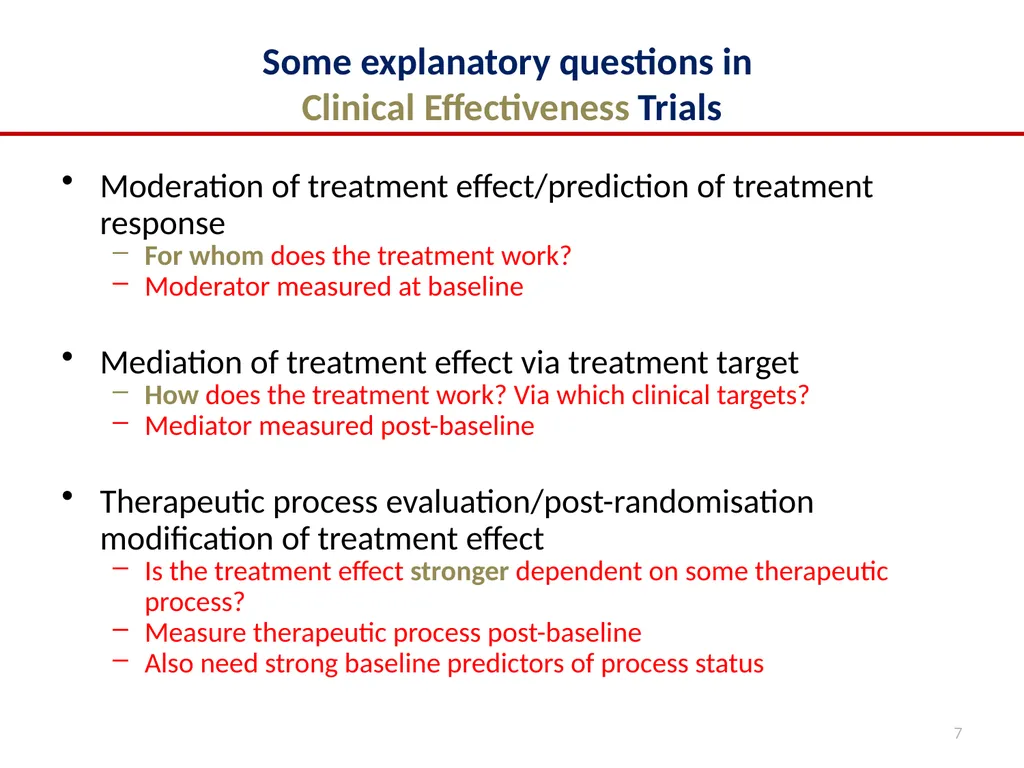
Some explanatory questions in
Clinical Effectiveness Trials Moderation of treatment effect/prediction of treatment response
For whom does the treatment work?
Moderator measured at baseline
Mediation of treatment effect via treatment target
How does the treatment work? Via which clinical targets?
Mediator measured post-baseline
Therapeutic process evaluation/post-randomisation modification of treatment effect
Is the treatment effect stronger dependent on some therapeutic process?
Measure therapeutic process post-baseline
Also need strong baseline predictors of process status 7<br>
For whom does the treatment work?
Moderator measured at baseline
Mediation of treatment effect via treatment target
How does the treatment work? Via which clinical targets?
Mediator measured post-baseline
Therapeutic process evaluation/post-randomisation modification of treatment effect
Is the treatment effect stronger dependent on some therapeutic process?
Measure therapeutic process post-baseline
Also need strong baseline predictors of process status 7<br>
08
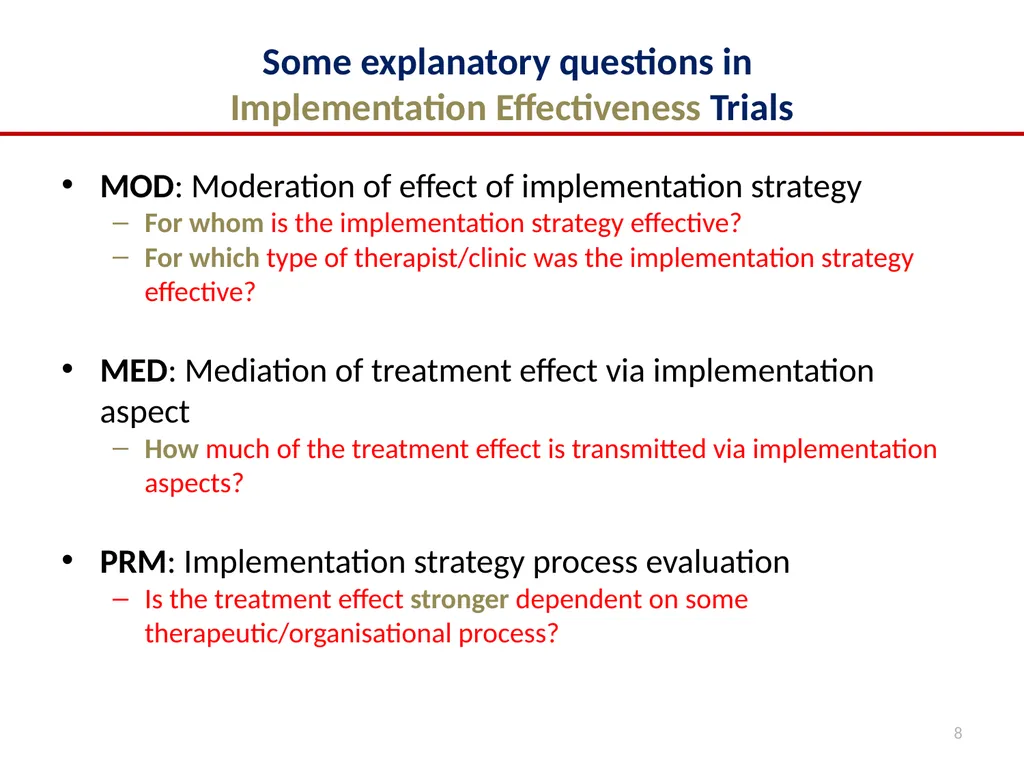
Some explanatory questions in
Implementation Effectiveness Trials MOD: Moderation of effect of implementation strategy
For whom is the implementation strategy effective?
For which type of therapist/clinic was the implementation strategy effective?
MED: Mediation of treatment effect via implementation aspect
How much of the treatment effect is transmitted via implementation aspects?
PRM: Implementation strategy process evaluation
Is the treatment effect stronger dependent on some therapeutic/organisational process? 8<br>
For whom is the implementation strategy effective?
For which type of therapist/clinic was the implementation strategy effective?
MED: Mediation of treatment effect via implementation aspect
How much of the treatment effect is transmitted via implementation aspects?
PRM: Implementation strategy process evaluation
Is the treatment effect stronger dependent on some therapeutic/organisational process? 8<br>
09
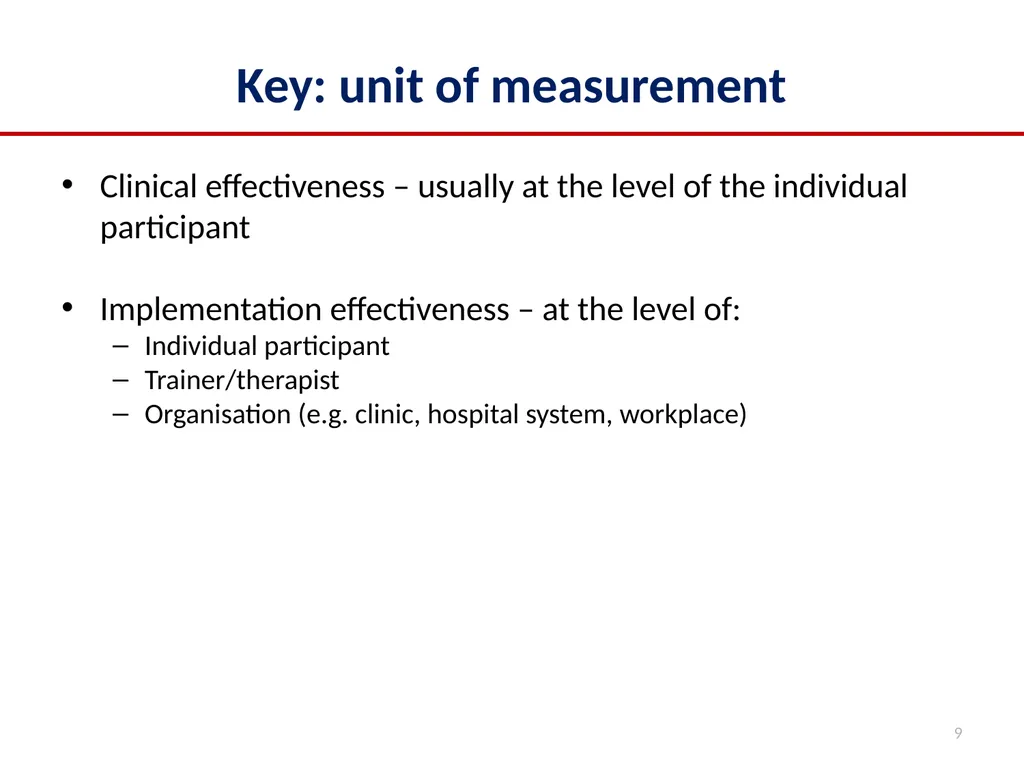
Key: unit of measurement Clinical effectiveness – usually at the level of the individual participant
Implementation effectiveness – at the level of:
Individual participant
Trainer/therapist
Organisation (e.g. clinic, hospital system, workplace) 9<br>
Implementation effectiveness – at the level of:
Individual participant
Trainer/therapist
Organisation (e.g. clinic, hospital system, workplace) 9<br>
10
Moderation by baseline variables 10<br>
11
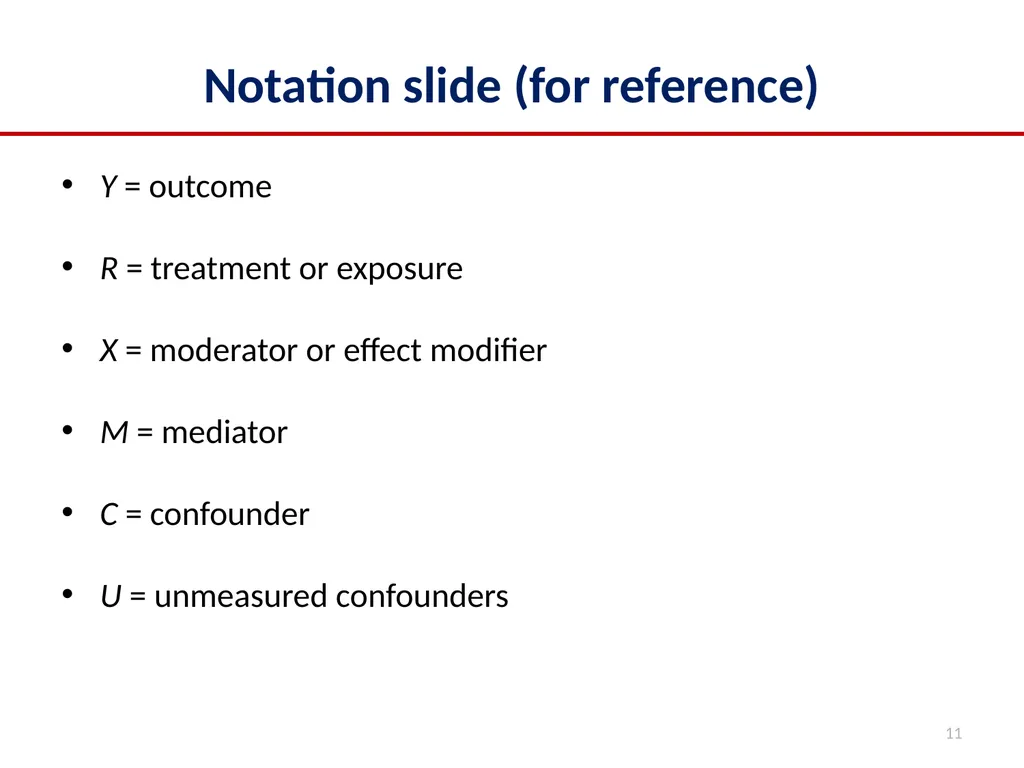
Notation slide (for reference) Y = outcome
R = treatment or exposure
X = moderator or effect modifier
M = mediator
C = confounder
U = unmeasured confounders 11<br>
R = treatment or exposure
X = moderator or effect modifier
M = mediator
C = confounder
U = unmeasured confounders 11<br>
12
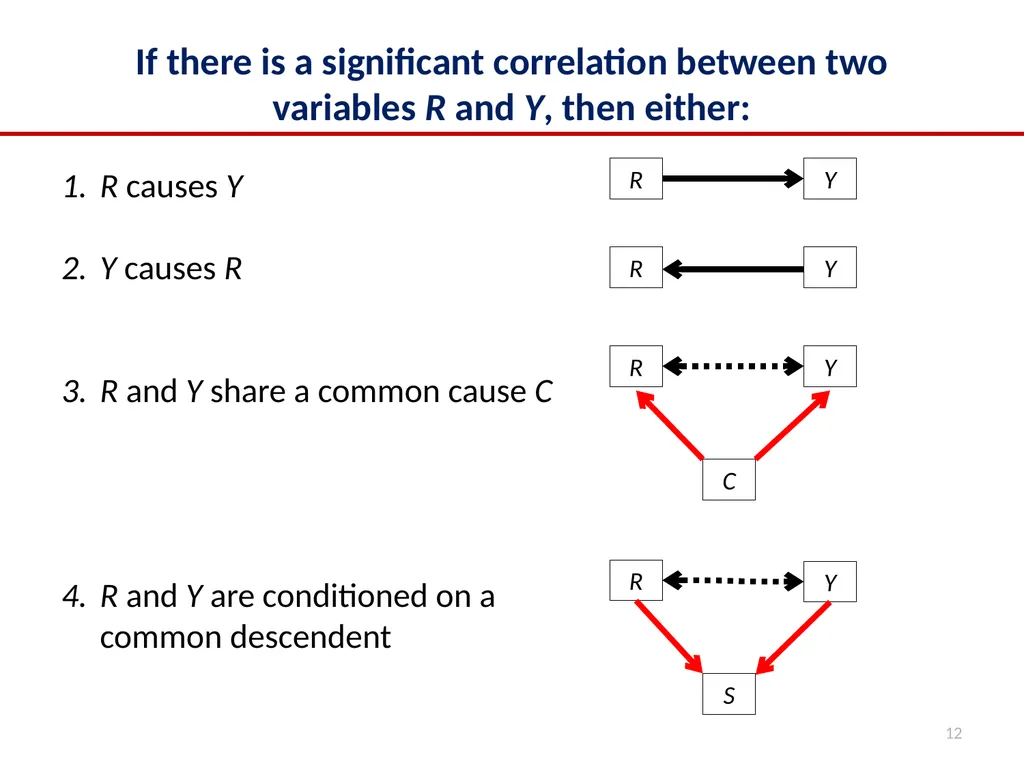
If there is a significant correlation between two variables R and Y, then either: R causes Y
Y causes R
R and Y share a common cause C
R and Y are conditioned on a common descendent R Y S R Y R Y R Y C 12<br>
Y causes R
R and Y share a common cause C
R and Y are conditioned on a common descendent R Y S R Y R Y R Y C 12<br>
13
Moderation of treatment effects Key point: The association between R and Y is not the same at different values or levels of X. In other words, a modifier is a variable that alters the relationship between the independent R and dependent Y variables.
“Treatment moderators specify for whom or under what conditions the treatment works.” (Baron and Kenny 1986)
Informs clinicians which of their patients might be most responsive to the treatment and for which patients other, more appropriate, treatments might be sought.
Personalized/stratified medicine
Moderators may identify subpopulations with possibly different causal mechanisms or course of illness
restructuring diagnostic classification 13<br>
“Treatment moderators specify for whom or under what conditions the treatment works.” (Baron and Kenny 1986)
Informs clinicians which of their patients might be most responsive to the treatment and for which patients other, more appropriate, treatments might be sought.
Personalized/stratified medicine
Moderators may identify subpopulations with possibly different causal mechanisms or course of illness
restructuring diagnostic classification 13<br>
14
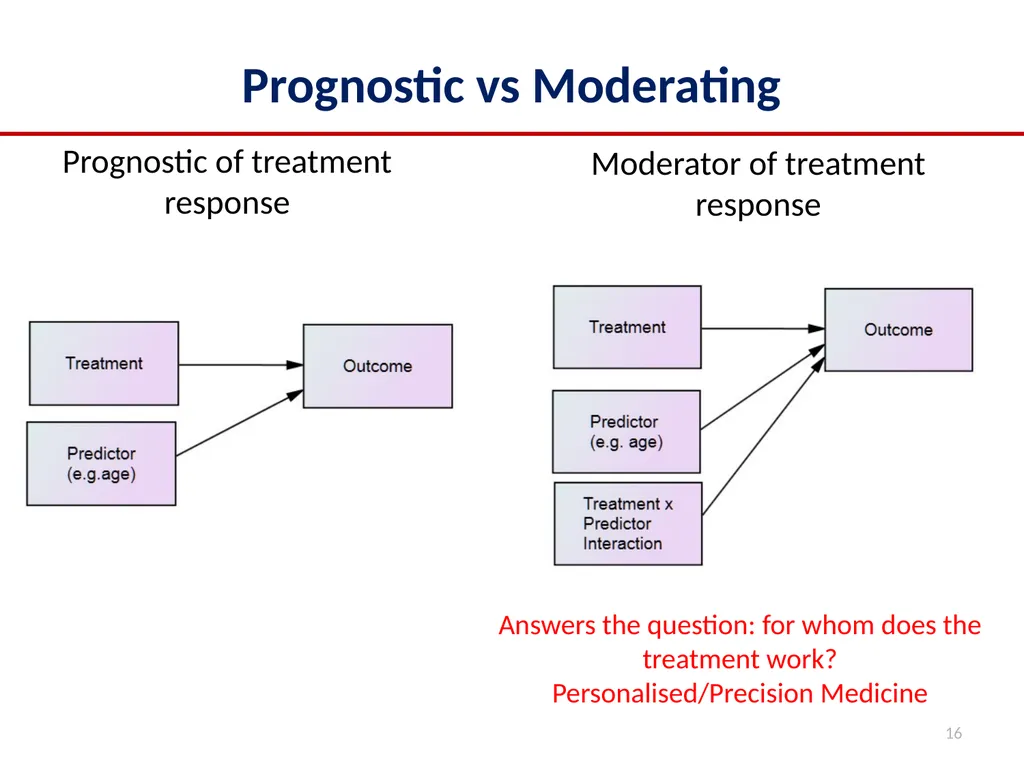
Prognostic versus predictive/moderation Prognostic:
A “prognostic biomarker” is a biological measurement made before treatment to indicate long-term outcome for patients either untreated or receiving standard treatment
Baseline variables indicating which participants will have an improved outcome or survival regardless of treatment
Predictive/Moderation:
A “predictive biomarker” is a biological measurement made before treatment to identify which patient is likely or unlikely to benefit from a particular treatment
Baseline variables related to differential response to treatment indicating which participants are most likely to benefit
Example (Buyse, 2007):
Overexpression of the HER2-neu gene in patients with early breast cancer provides an example of a biomarker that has both prognostic value (patients with HER2-neu overexpression having a worse prognosis) and predictive value for herceptin (patients with HER2-neu overexpression deriving a benefit from this treatment) 14 See Dunn et al. Clinical Trials 2013; 10: 709–719<br>
A “prognostic biomarker” is a biological measurement made before treatment to indicate long-term outcome for patients either untreated or receiving standard treatment
Baseline variables indicating which participants will have an improved outcome or survival regardless of treatment
Predictive/Moderation:
A “predictive biomarker” is a biological measurement made before treatment to identify which patient is likely or unlikely to benefit from a particular treatment
Baseline variables related to differential response to treatment indicating which participants are most likely to benefit
Example (Buyse, 2007):
Overexpression of the HER2-neu gene in patients with early breast cancer provides an example of a biomarker that has both prognostic value (patients with HER2-neu overexpression having a worse prognosis) and predictive value for herceptin (patients with HER2-neu overexpression deriving a benefit from this treatment) 14 See Dunn et al. Clinical Trials 2013; 10: 709–719<br>
15
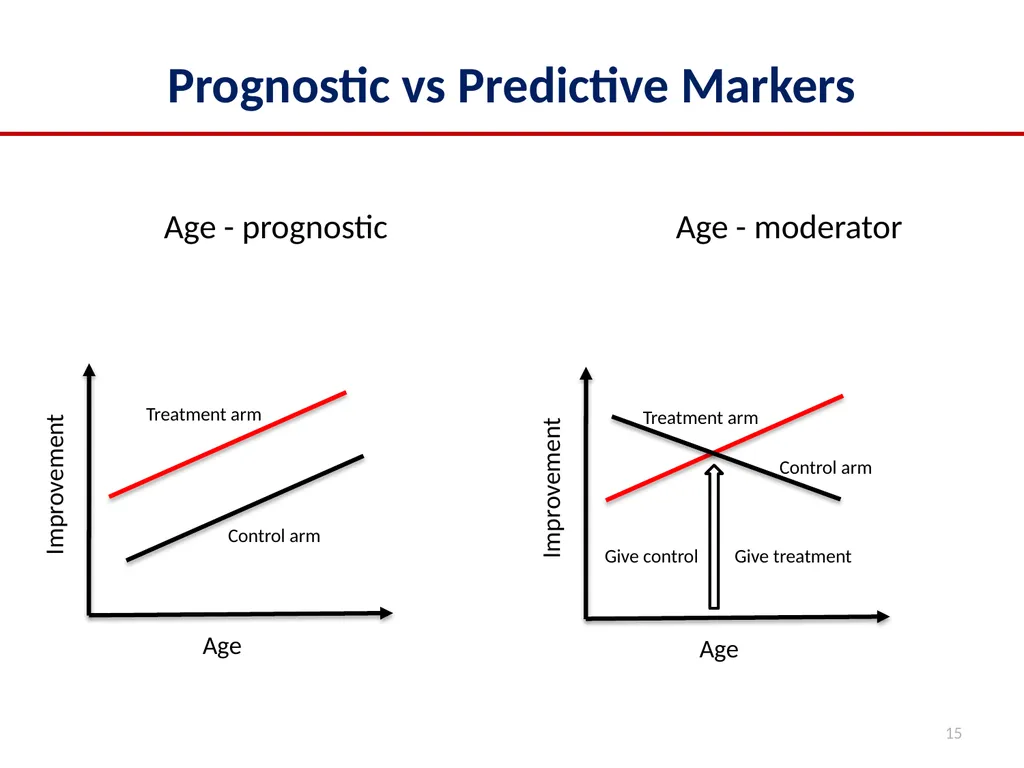
Prognostic vs Predictive Markers Age - prognostic Age - moderator Age Improvement Treatment arm Control arm Age Improvement Treatment arm Control arm Give treatment Give control 15<br>
16
Prognostic vs Moderating Prognostic of treatment response Answers the question: for whom does the treatment work?
Personalised/Precision Medicine 16 Moderator of treatment response<br>
Personalised/Precision Medicine 16 Moderator of treatment response<br>
17
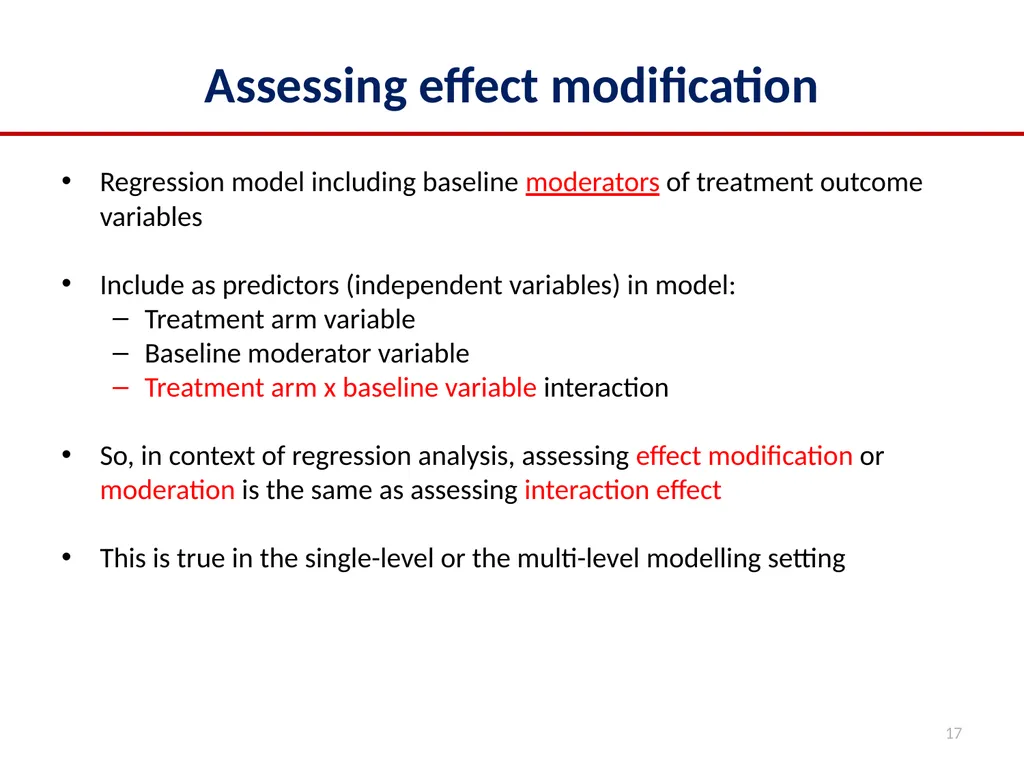
Assessing effect modification Regression model including baseline moderators of treatment outcome variables
Include as predictors (independent variables) in model:
Treatment arm variable
Baseline moderator variable
Treatment arm x baseline variable interaction
So, in context of regression analysis, assessing effect modification or moderation is the same as assessing interaction effect
This is true in the single-level or the multi-level modelling setting 17<br>
Include as predictors (independent variables) in model:
Treatment arm variable
Baseline moderator variable
Treatment arm x baseline variable interaction
So, in context of regression analysis, assessing effect modification or moderation is the same as assessing interaction effect
This is true in the single-level or the multi-level modelling setting 17<br>
18
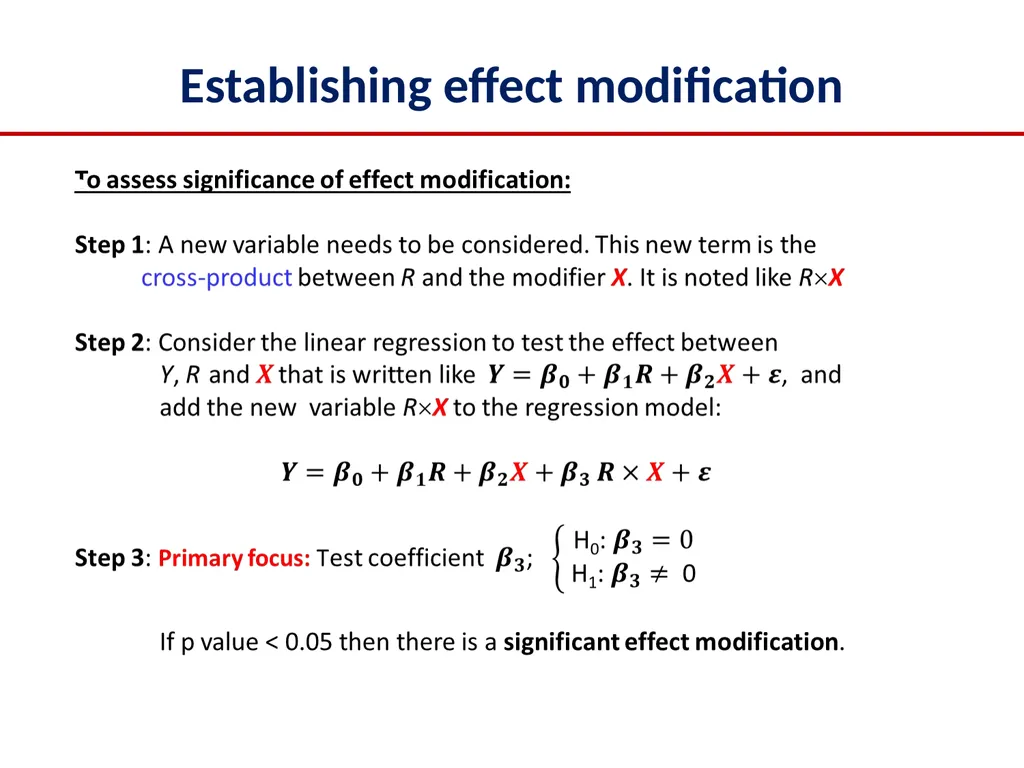
Establishing effect modification<br>
19
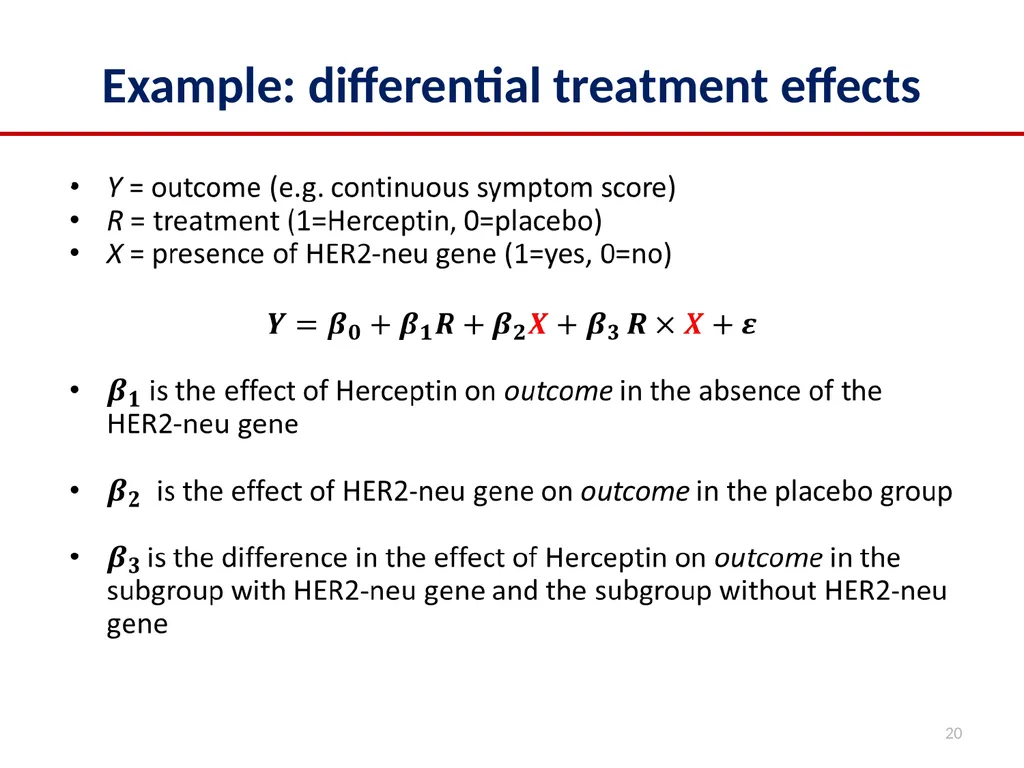
Example: differential treatment effects 20<br>
20
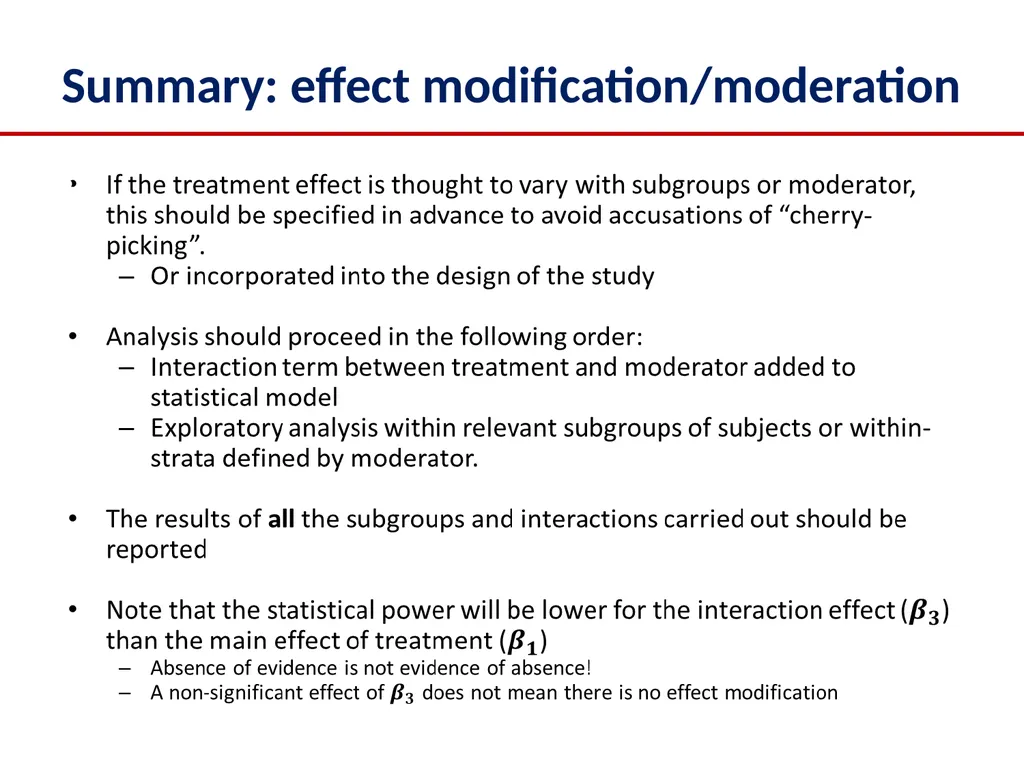
Summary: effect modification/moderation<br>
21
Quantitative Analytic Techniques III:
Mediation and Components Richard Emsley, Ph.D.
King’s College
London, UK<br>
London, UK<br>
22
Quantitative Analytic Techniques III: Moderation, mediation and multilevel models Professor Richard Emsley
NIHR Research Professor of Medical Statistics and Trials Methodology
Department of Biostatistics and Health Informatics, Institute of Psychiatry, Psychology and Neuroscience, King’s College London
Slides and joint work with Dr Kimberley Goldsmith<br>
NIHR Research Professor of Medical Statistics and Trials Methodology
Department of Biostatistics and Health Informatics, Institute of Psychiatry, Psychology and Neuroscience, King’s College London
Slides and joint work with Dr Kimberley Goldsmith<br>
23
Mediation of effects via POST-TREATMENT variables 24<br>
24
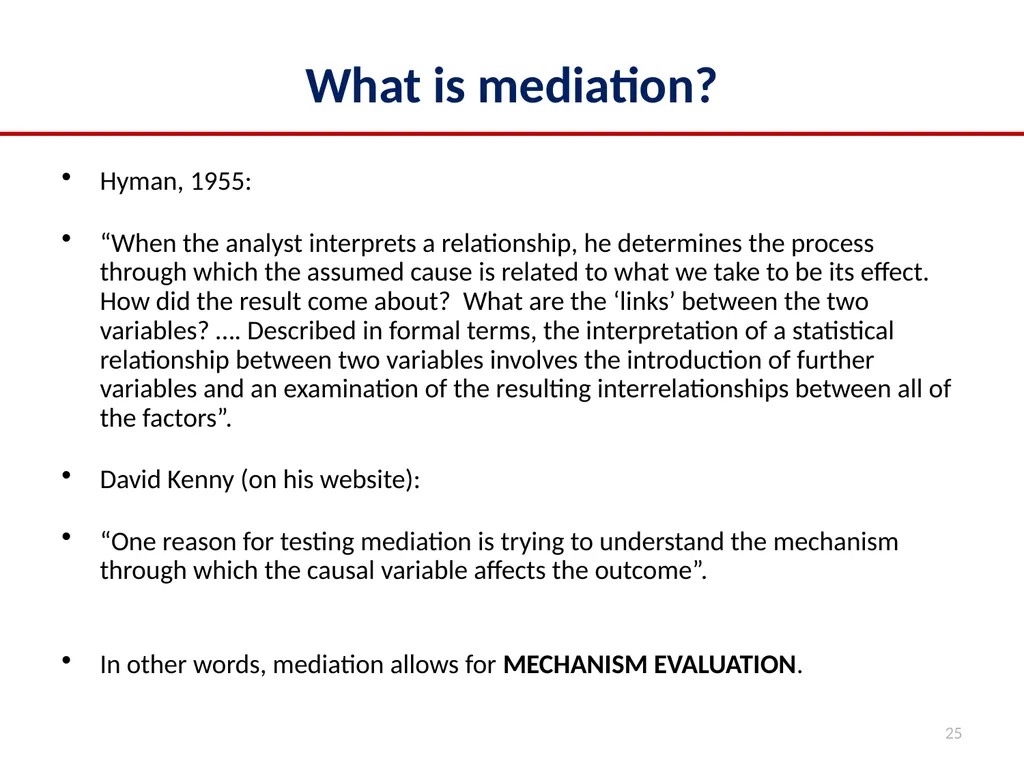
What is mediation? Hyman, 1955:
“When the analyst interprets a relationship, he determines the process through which the assumed cause is related to what we take to be its effect. How did the result come about? What are the ‘links’ between the two variables? …. Described in formal terms, the interpretation of a statistical relationship between two variables involves the introduction of further variables and an examination of the resulting interrelationships between all of the factors”.
David Kenny (on his website):
“One reason for testing mediation is trying to understand the mechanism through which the causal variable affects the outcome”.
In other words, mediation allows for MECHANISM EVALUATION. 25<br>
“When the analyst interprets a relationship, he determines the process through which the assumed cause is related to what we take to be its effect. How did the result come about? What are the ‘links’ between the two variables? …. Described in formal terms, the interpretation of a statistical relationship between two variables involves the introduction of further variables and an examination of the resulting interrelationships between all of the factors”.
David Kenny (on his website):
“One reason for testing mediation is trying to understand the mechanism through which the causal variable affects the outcome”.
In other words, mediation allows for MECHANISM EVALUATION. 25<br>
25
Baron RM & Kenny DA (1986). The moderator-mediator variable distinction in social psychological research: conceptual, strategic, and statistical considerations. Journal of Personality and Social Psychology 51, 1173-1182.
Baron and Kenny defined mediation as the “generative mechanisms through which the focal independent variable is able to influence the dependent variable of interest”
A mediator (M) is a variable that occurs in the causal pathway from an exposure (R) to an outcome variable (Y). It causes variation in the outcome and itself is caused to vary by the exposure variable.
This causal chain implies a temporal relation
R occurs before M and
M occurs before Y Mediation and mediators<br>
Baron and Kenny defined mediation as the “generative mechanisms through which the focal independent variable is able to influence the dependent variable of interest”
A mediator (M) is a variable that occurs in the causal pathway from an exposure (R) to an outcome variable (Y). It causes variation in the outcome and itself is caused to vary by the exposure variable.
This causal chain implies a temporal relation
R occurs before M and
M occurs before Y Mediation and mediators<br>
26
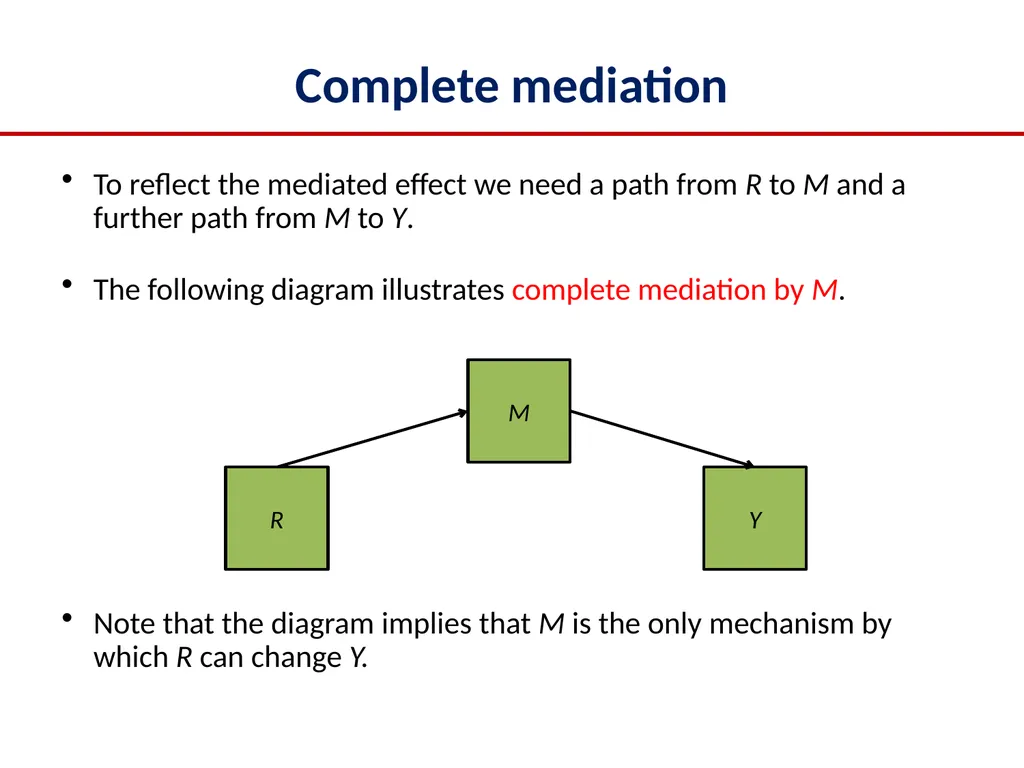
To reflect the mediated effect we need a path from R to M and a further path from M to Y.
The following diagram illustrates complete mediation by M.
Note that the diagram implies that M is the only mechanism by which R can change Y. Complete mediation R Y M<br>
The following diagram illustrates complete mediation by M.
Note that the diagram implies that M is the only mechanism by which R can change Y. Complete mediation R Y M<br>
27
We might not want to rule out effects of R on Y other than those operating by changing M.
The following triangle illustrates partial mediation by M. “The mediation triangle” R Y M<br>
The following triangle illustrates partial mediation by M. “The mediation triangle” R Y M<br>
28
Why assess mediation in studies? Why are we interested?
Develop or confirm a mechanistic theory of how treatment benefits outcome.
Explain why a trial has produced negative finding.
treatment failed to change the hypothesized M? M failed to influence Y? Effects via mediator counterbalances with other harmful effect?
To improve the treatment by identifying target variables.
Early phase trials are typically concerned with exploratory analyses to identify putative mediators from a pool of potential variables.
Note that such investigations are hypothesis generating; any hypothesis will then need to be confirmed using an independent sample later
Later phase trials are typically concerned with confirming or otherwise of an existing mediation hypothesis. 29<br>
Develop or confirm a mechanistic theory of how treatment benefits outcome.
Explain why a trial has produced negative finding.
treatment failed to change the hypothesized M? M failed to influence Y? Effects via mediator counterbalances with other harmful effect?
To improve the treatment by identifying target variables.
Early phase trials are typically concerned with exploratory analyses to identify putative mediators from a pool of potential variables.
Note that such investigations are hypothesis generating; any hypothesis will then need to be confirmed using an independent sample later
Later phase trials are typically concerned with confirming or otherwise of an existing mediation hypothesis. 29<br>
29
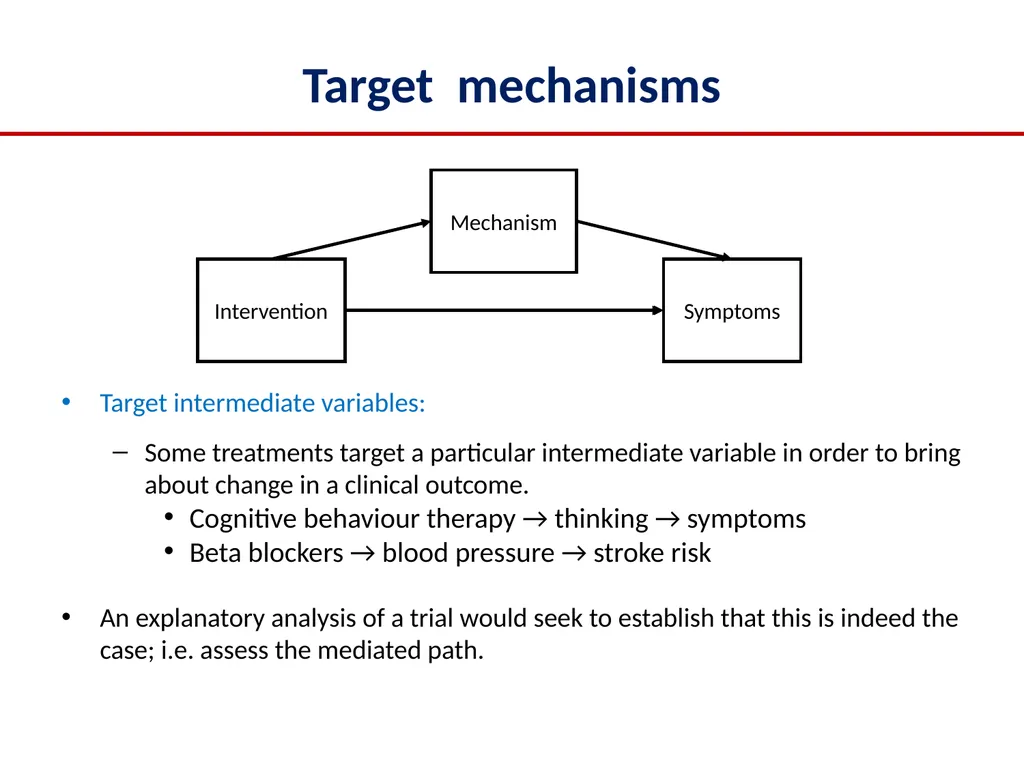
Target mechanisms Target intermediate variables:
Some treatments target a particular intermediate variable in order to bring about change in a clinical outcome.
Cognitive behaviour therapy → thinking → symptoms
Beta blockers → blood pressure → stroke risk
An explanatory analysis of a trial would seek to establish that this is indeed the case; i.e. assess the mediated path. Intervention Mechanism Symptoms<br>
Some treatments target a particular intermediate variable in order to bring about change in a clinical outcome.
Cognitive behaviour therapy → thinking → symptoms
Beta blockers → blood pressure → stroke risk
An explanatory analysis of a trial would seek to establish that this is indeed the case; i.e. assess the mediated path. Intervention Mechanism Symptoms<br>
30
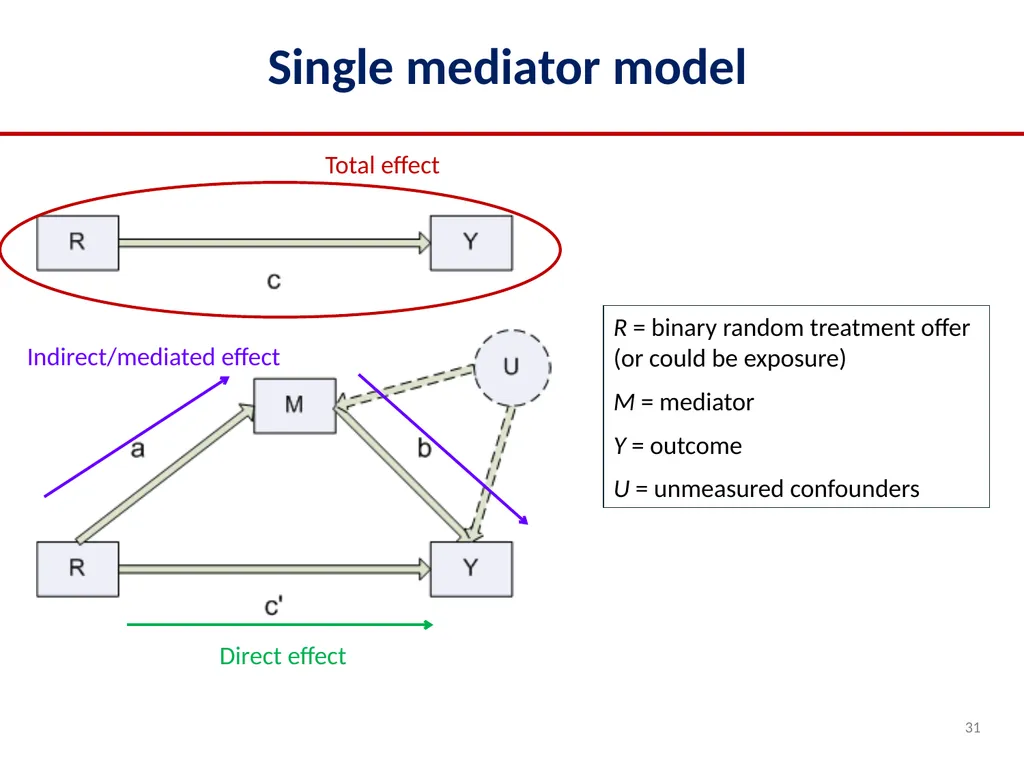
Single mediator model R = binary random treatment offer (or could be exposure)
M = mediator
Y = outcome
U = unmeasured confounders Indirect/mediated effect Direct effect 31<br>
M = mediator
Y = outcome
U = unmeasured confounders Indirect/mediated effect Direct effect 31<br>
31
Mediation investigations aim to partition total (causal) treatment effects into
effects that operate via changing the putative mediator
indirect treatment effects
and non-mediated effects
direct treatment effects.
Note that direct effects include effects via any mediating variable not included in the model.
So the meaning of a direct effect is always relative to the variable whose mediating effect is being modelled. Direct and indirect effects<br>
effects that operate via changing the putative mediator
indirect treatment effects
and non-mediated effects
direct treatment effects.
Note that direct effects include effects via any mediating variable not included in the model.
So the meaning of a direct effect is always relative to the variable whose mediating effect is being modelled. Direct and indirect effects<br>
32
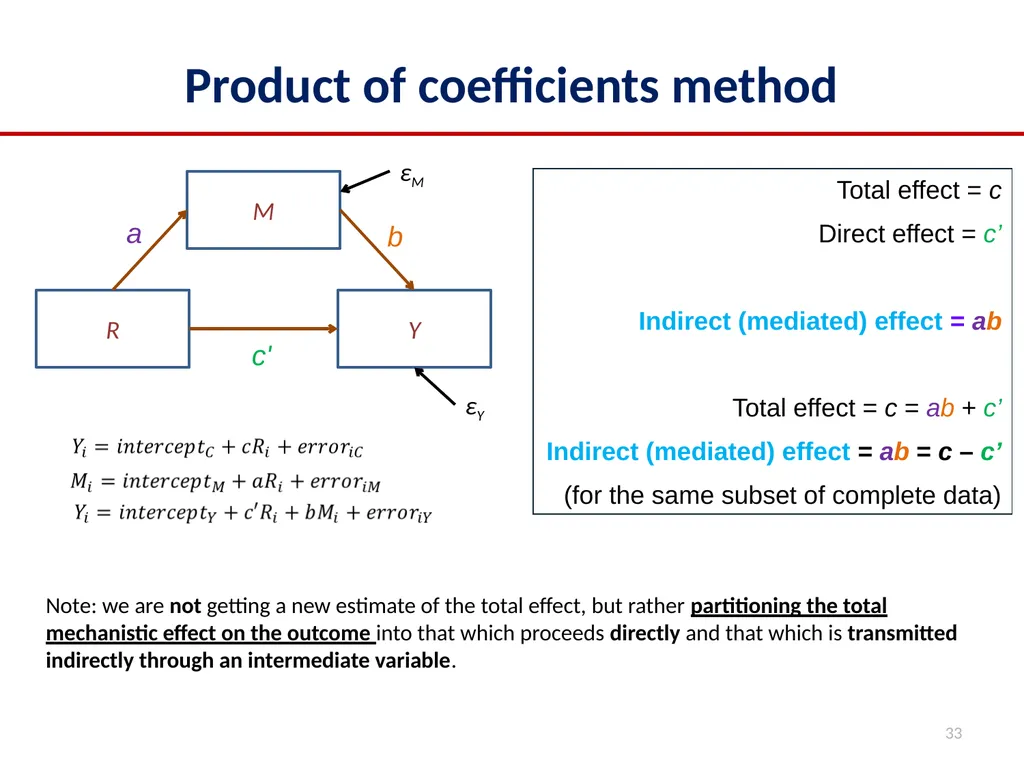
Product of coefficients method 33 Total effect = c
Direct effect = c’
Indirect (mediated) effect = ab
Total effect = c = ab + c’
Indirect (mediated) effect = ab = c – c’
(for the same subset of complete data) Note: we are not getting a new estimate of the total effect, but rather partitioning the total mechanistic effect on the outcome into that which proceeds directly and that which is transmitted indirectly through an intermediate variable.<br>
Direct effect = c’
Indirect (mediated) effect = ab
Total effect = c = ab + c’
Indirect (mediated) effect = ab = c – c’
(for the same subset of complete data) Note: we are not getting a new estimate of the total effect, but rather partitioning the total mechanistic effect on the outcome into that which proceeds directly and that which is transmitted indirectly through an intermediate variable.<br>
33
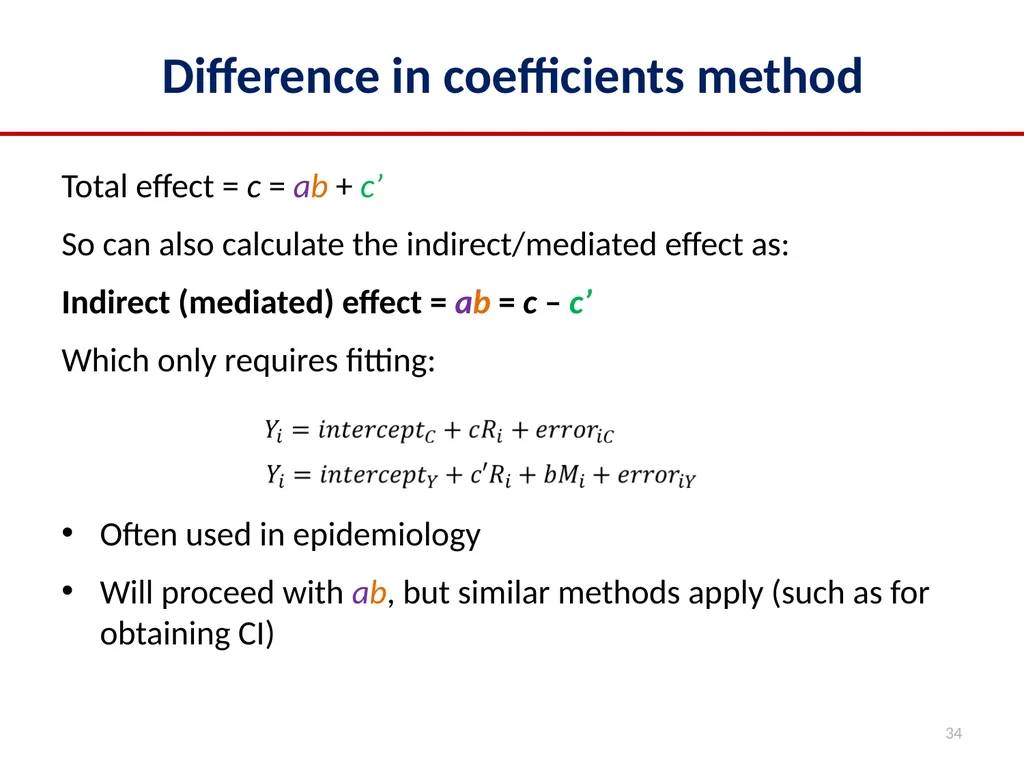
Difference in coefficients method Total effect = c = ab + c’
So can also calculate the indirect/mediated effect as:
Indirect (mediated) effect = ab = c – c’
Which only requires fitting:
Often used in epidemiology
Will proceed with ab, but similar methods apply (such as for obtaining CI) 34<br>
So can also calculate the indirect/mediated effect as:
Indirect (mediated) effect = ab = c – c’
Which only requires fitting:
Often used in epidemiology
Will proceed with ab, but similar methods apply (such as for obtaining CI) 34<br>
34
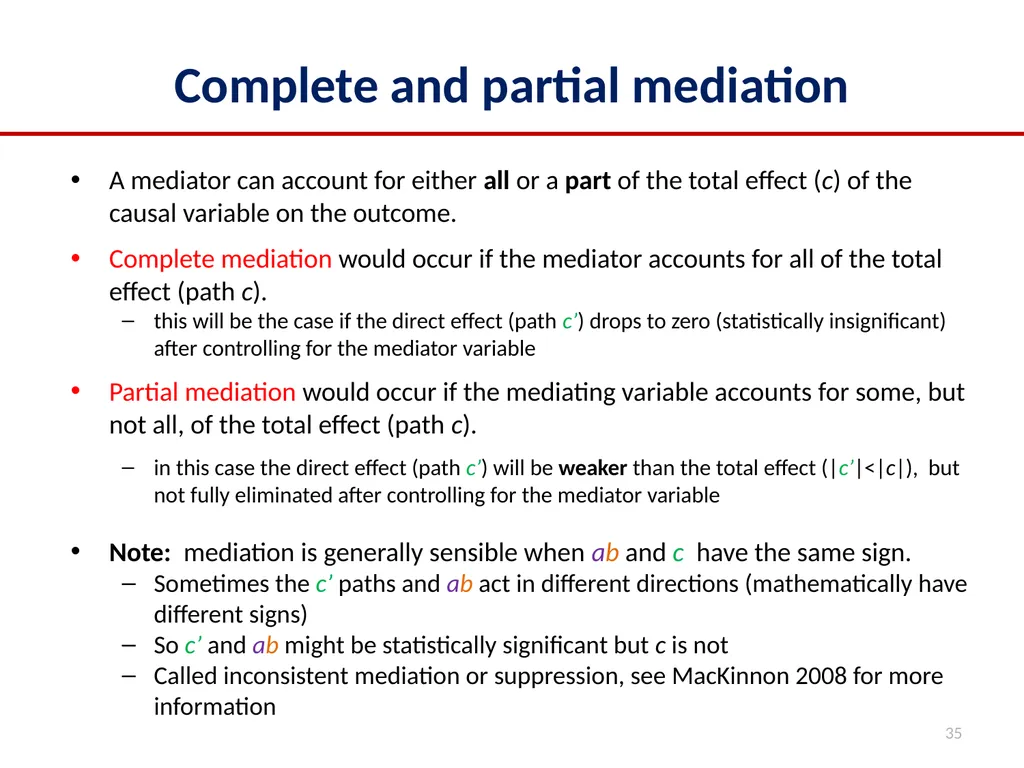
Complete and partial mediation A mediator can account for either all or a part of the total effect (c) of the causal variable on the outcome.
Complete mediation would occur if the mediator accounts for all of the total effect (path c).
this will be the case if the direct effect (path c’) drops to zero (statistically insignificant) after controlling for the mediator variable
Partial mediation would occur if the mediating variable accounts for some, but not all, of the total effect (path c).
in this case the direct effect (path c’) will be weaker than the total effect (|c’|<|c|), but not fully eliminated after controlling for the mediator variable
Note: mediation is generally sensible when ab and c have the same sign.
Sometimes the c’ paths and ab act in different directions (mathematically have different signs)
So c’ and ab might be statistically significant but c is not
Called inconsistent mediation or suppression, see MacKinnon 2008 for more information 35<br>
Complete mediation would occur if the mediator accounts for all of the total effect (path c).
this will be the case if the direct effect (path c’) drops to zero (statistically insignificant) after controlling for the mediator variable
Partial mediation would occur if the mediating variable accounts for some, but not all, of the total effect (path c).
in this case the direct effect (path c’) will be weaker than the total effect (|c’|<|c|), but not fully eliminated after controlling for the mediator variable
Note: mediation is generally sensible when ab and c have the same sign.
Sometimes the c’ paths and ab act in different directions (mathematically have different signs)
So c’ and ab might be statistically significant but c is not
Called inconsistent mediation or suppression, see MacKinnon 2008 for more information 35<br>
35
The difference in coefficient method is popular in epidemiology as it only involved fitting models for the clinical outcome Y.
(Epidemiologists are used to looking at change in regression coefficients after including covariates in the model.)
However, in trials we actually want to see the treatment effect on the intermediate variable M (a) in addition to the indirect effect
So here we focus on the product of coefficient approach.
We refer to a as the target effect
In any approach, it is essential to show that the treatment has shifted the mediator for mediation through this variable to occur. Target effect 36<br>
(Epidemiologists are used to looking at change in regression coefficients after including covariates in the model.)
However, in trials we actually want to see the treatment effect on the intermediate variable M (a) in addition to the indirect effect
So here we focus on the product of coefficient approach.
We refer to a as the target effect
In any approach, it is essential to show that the treatment has shifted the mediator for mediation through this variable to occur. Target effect 36<br>
36
Sobel (1982) derived a formula for the estimating the asymptotic standard error (SE) of the product of coefficients estimator.
The formula only requires estimates and SEs provided after fitting the individual regression equations for M and Y.
Symmetric confidence intervals derived using this SE rely on asymptotic normality.
As the distribution of the product estimator is likely to be skewed for finite samples alternative inferences derived by bootstrapping are to be preferred. Inferences for indirect and direct effects 37<br>
The formula only requires estimates and SEs provided after fitting the individual regression equations for M and Y.
Symmetric confidence intervals derived using this SE rely on asymptotic normality.
As the distribution of the product estimator is likely to be skewed for finite samples alternative inferences derived by bootstrapping are to be preferred. Inferences for indirect and direct effects 37<br>
37
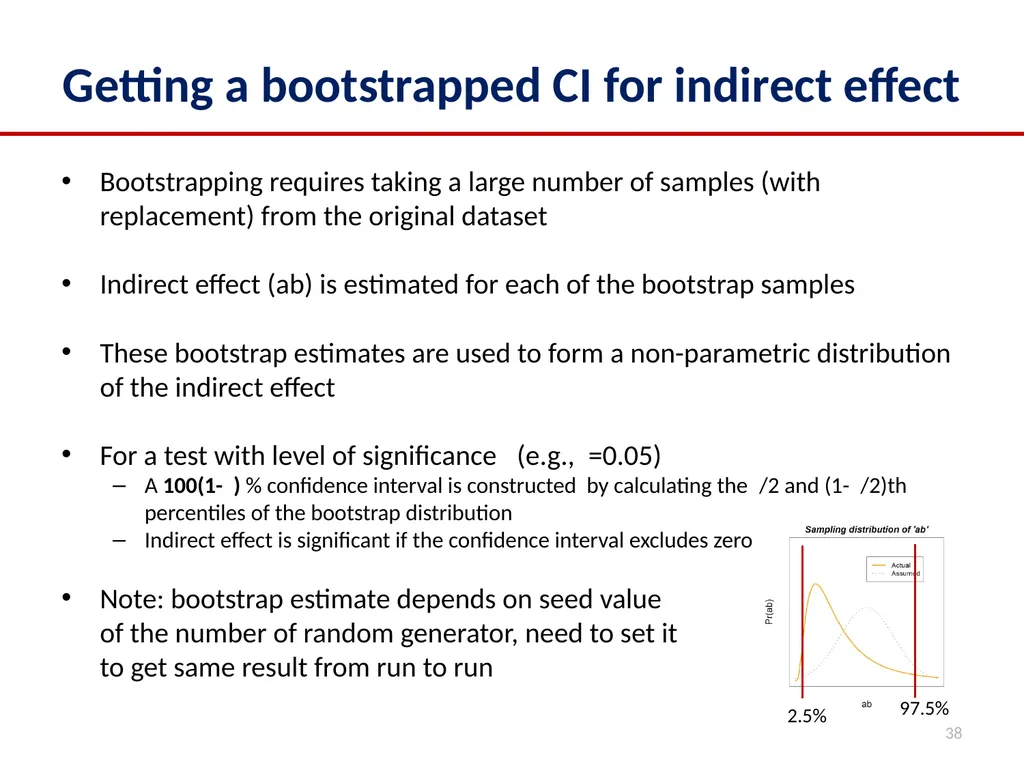
Getting a bootstrapped CI for indirect effect Bootstrapping requires taking a large number of samples (with replacement) from the original dataset
Indirect effect (ab) is estimated for each of the bootstrap samples
These bootstrap estimates are used to form a non-parametric distribution of the indirect effect
For a test with level of significance (e.g., =0.05)
A 100(1- ) % confidence interval is constructed by calculating the /2 and (1- /2)th percentiles of the bootstrap distribution
Indirect effect is significant if the confidence interval excludes zero
Note: bootstrap estimate depends on seed value of the number of random generator, need to set it to get same result from run to run 38 2.5% 97.5%<br>
Indirect effect (ab) is estimated for each of the bootstrap samples
These bootstrap estimates are used to form a non-parametric distribution of the indirect effect
For a test with level of significance (e.g., =0.05)
A 100(1- ) % confidence interval is constructed by calculating the /2 and (1- /2)th percentiles of the bootstrap distribution
Indirect effect is significant if the confidence interval excludes zero
Note: bootstrap estimate depends on seed value of the number of random generator, need to set it to get same result from run to run 38 2.5% 97.5%<br>
38
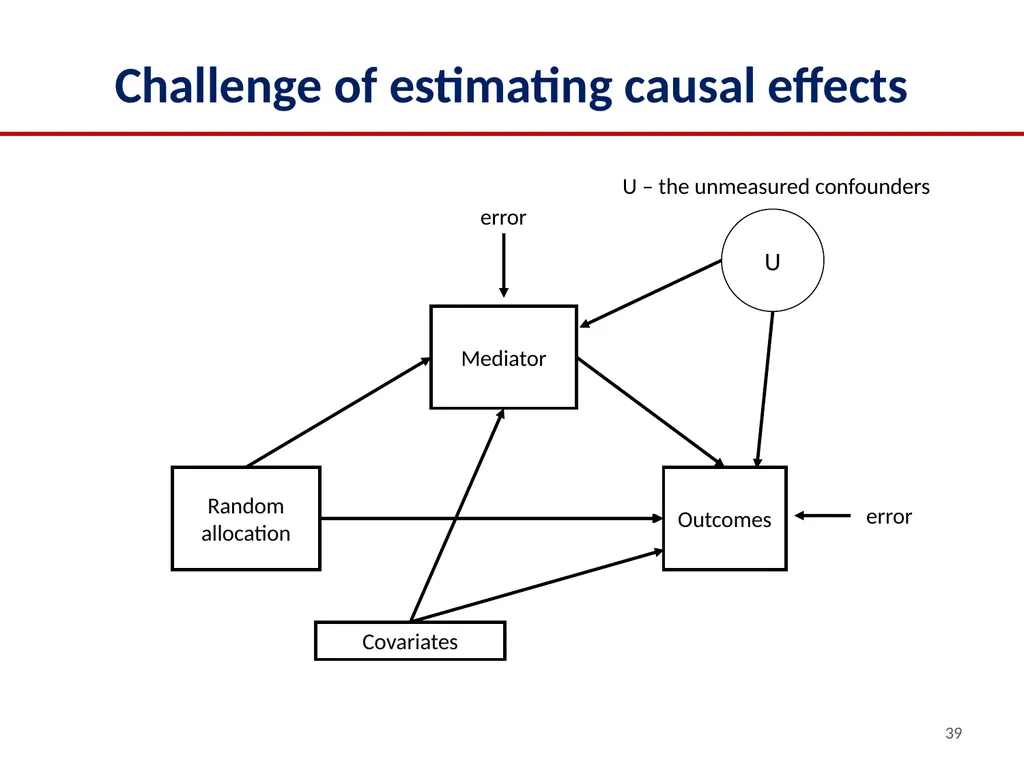
Challenge of estimating causal effects 39 Random
allocation Mediator Outcomes U U – the unmeasured confounders Covariates error error<br>
allocation Mediator Outcomes U U – the unmeasured confounders Covariates error error<br>
39
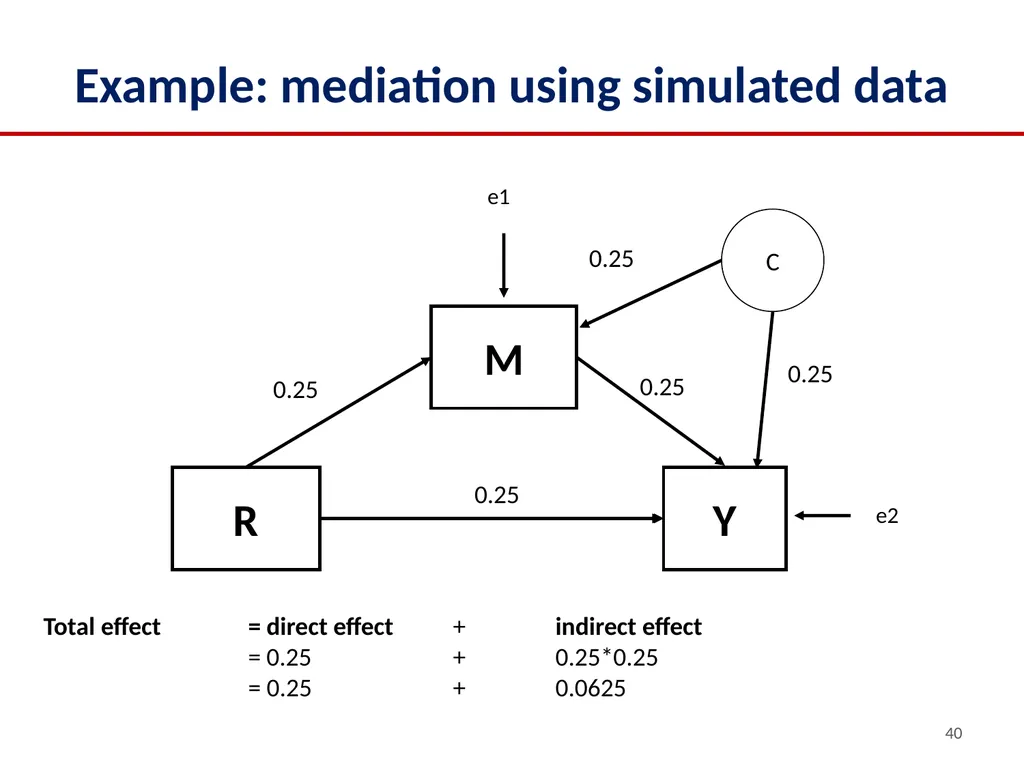
Example: mediation using simulated data R Y 0.25 M 0.25 0.25 e1 e2 C Total effect = direct effect + indirect effect
= 0.25 + 0.25*0.25
= 0.25 + 0.0625 0.25 0.25 40<br>
= 0.25 + 0.25*0.25
= 0.25 + 0.0625 0.25 0.25 40<br>
40
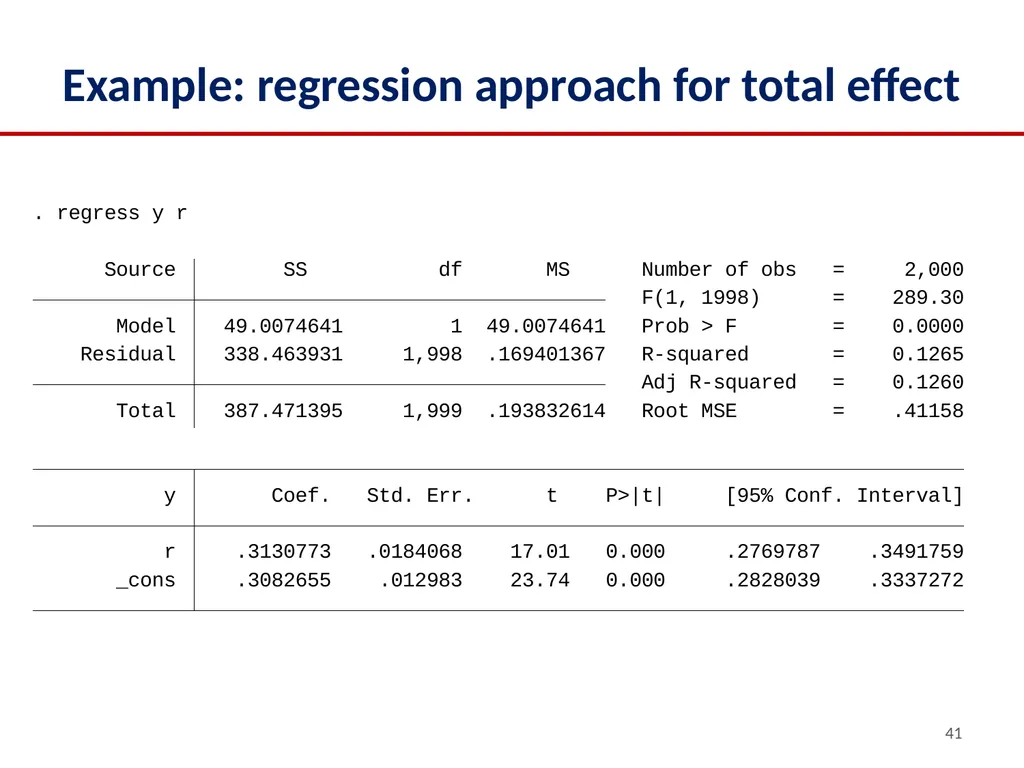
Example: regression approach for total effect 41<br>
41
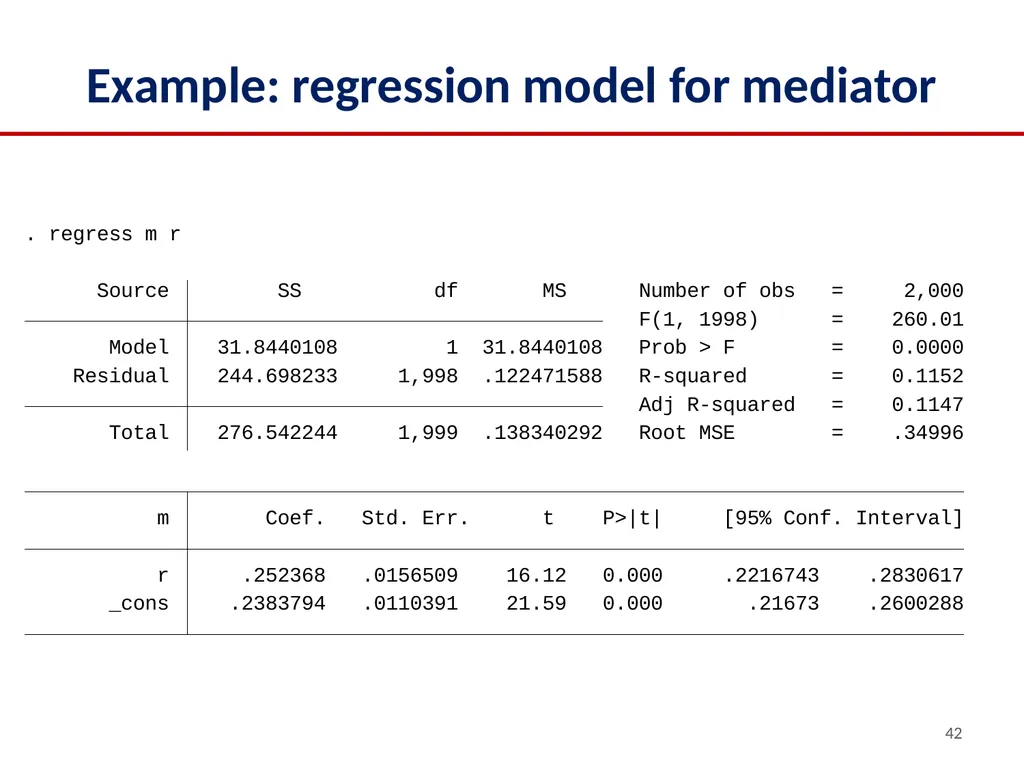
Example: regression model for mediator 42<br>
42
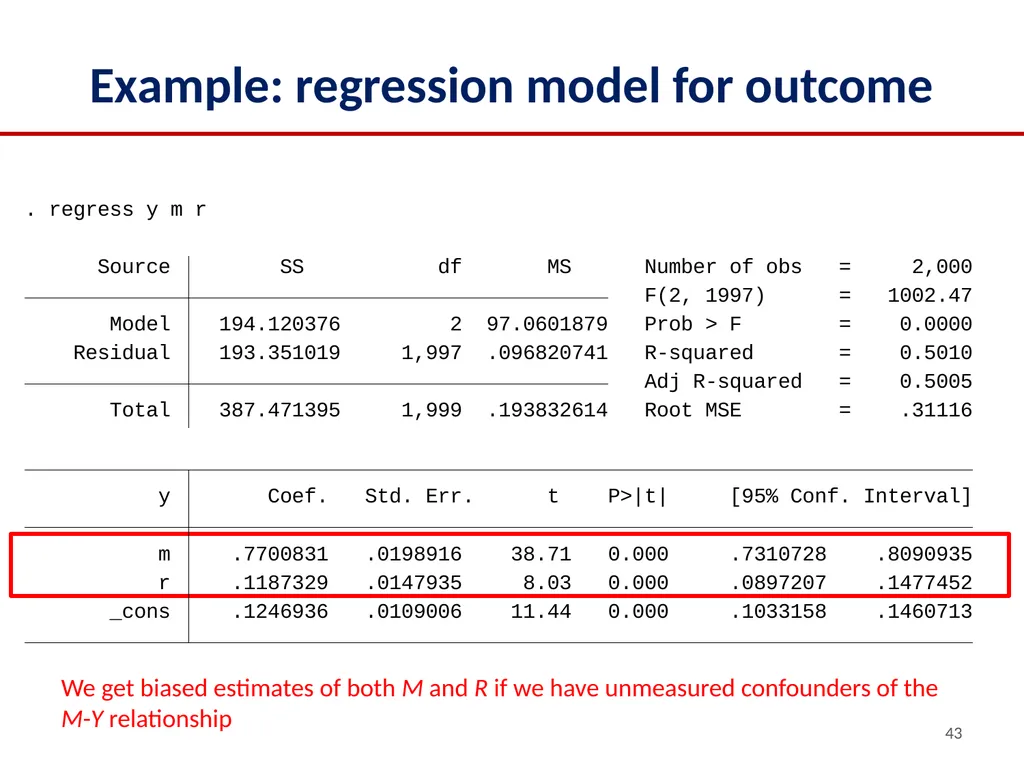
Example: regression model for outcome 43 We get biased estimates of both M and R if we have unmeasured confounders of the M-Y relationship<br>
43
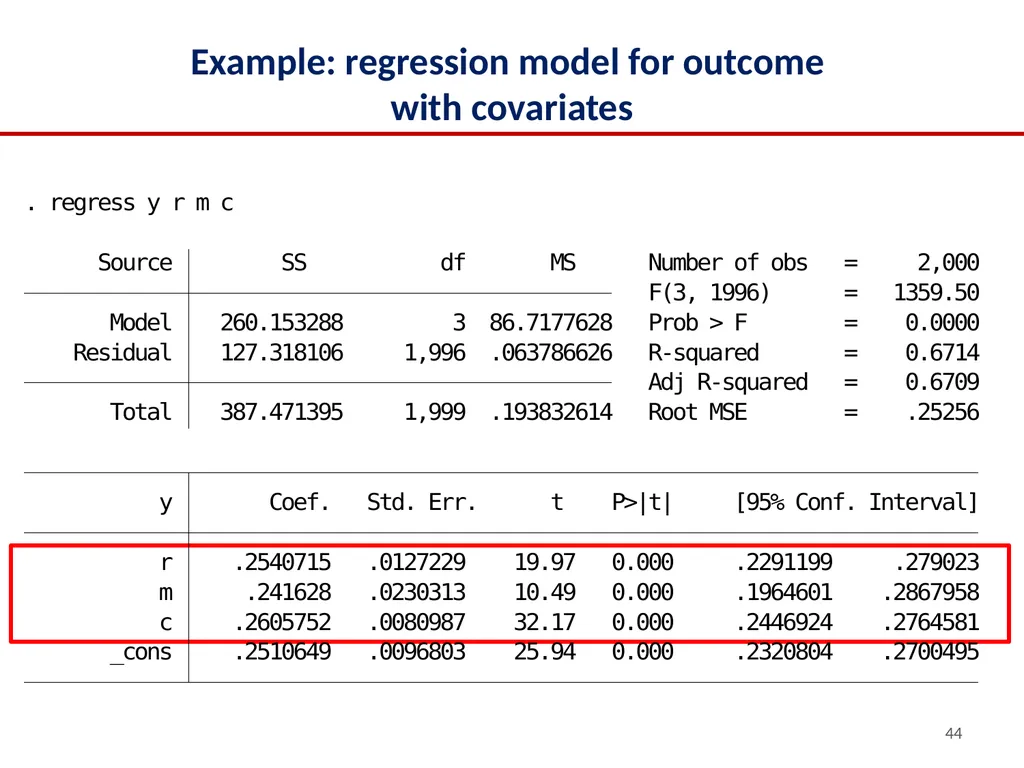
Example: regression model for outcome
with covariates 44<br>
44
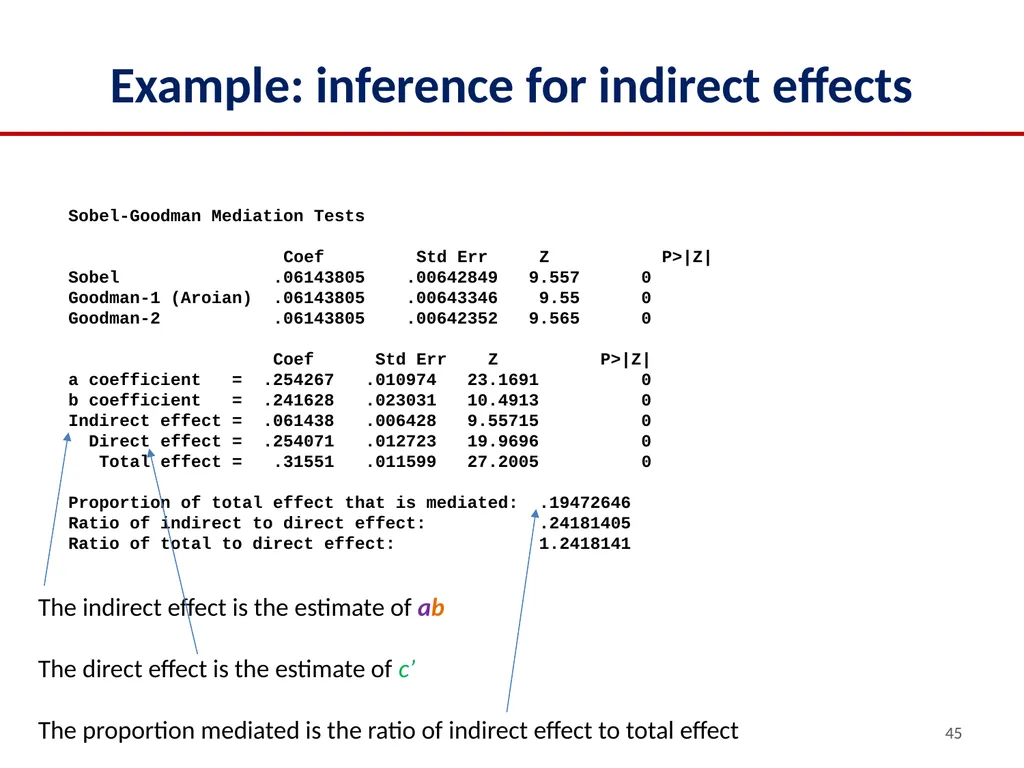
Example: inference for indirect effects Sobel-Goodman Mediation Tests
Coef Std Err Z P>|Z|
Sobel .06143805 .00642849 9.557 0
Goodman-1 (Aroian) .06143805 .00643346 9.55 0
Goodman-2 .06143805 .00642352 9.565 0
Coef Std Err Z P>|Z|
a coefficient = .254267 .010974 23.1691 0
b coefficient = .241628 .023031 10.4913 0
Indirect effect = .061438 .006428 9.55715 0
Direct effect = .254071 .012723 19.9696 0
Total effect = .31551 .011599 27.2005 0
Proportion of total effect that is mediated: .19472646
Ratio of indirect to direct effect: .24181405
Ratio of total to direct effect: 1.2418141 45 The indirect effect is the estimate of ab
The direct effect is the estimate of c’
The proportion mediated is the ratio of indirect effect to total effect<br>
Coef Std Err Z P>|Z|
Sobel .06143805 .00642849 9.557 0
Goodman-1 (Aroian) .06143805 .00643346 9.55 0
Goodman-2 .06143805 .00642352 9.565 0
Coef Std Err Z P>|Z|
a coefficient = .254267 .010974 23.1691 0
b coefficient = .241628 .023031 10.4913 0
Indirect effect = .061438 .006428 9.55715 0
Direct effect = .254071 .012723 19.9696 0
Total effect = .31551 .011599 27.2005 0
Proportion of total effect that is mediated: .19472646
Ratio of indirect to direct effect: .24181405
Ratio of total to direct effect: 1.2418141 45 The indirect effect is the estimate of ab
The direct effect is the estimate of c’
The proportion mediated is the ratio of indirect effect to total effect<br>
45
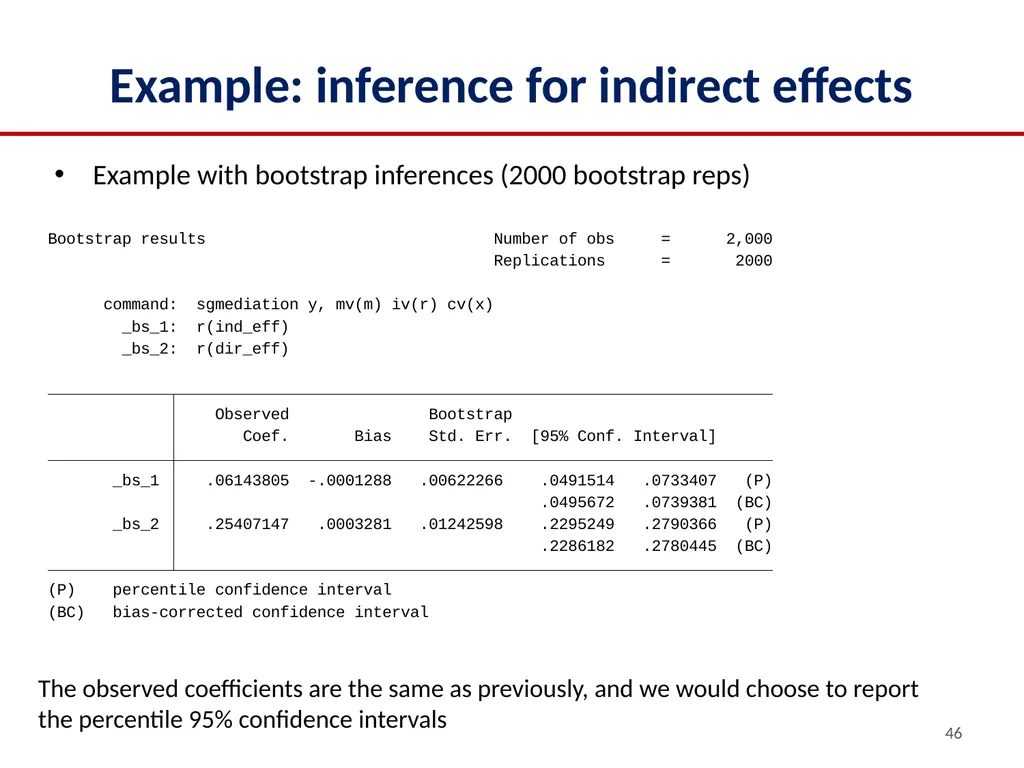
Example: inference for indirect effects Example with bootstrap inferences (2000 bootstrap reps) 46 The observed coefficients are the same as previously, and we would choose to report the percentile 95% confidence intervals<br>
46
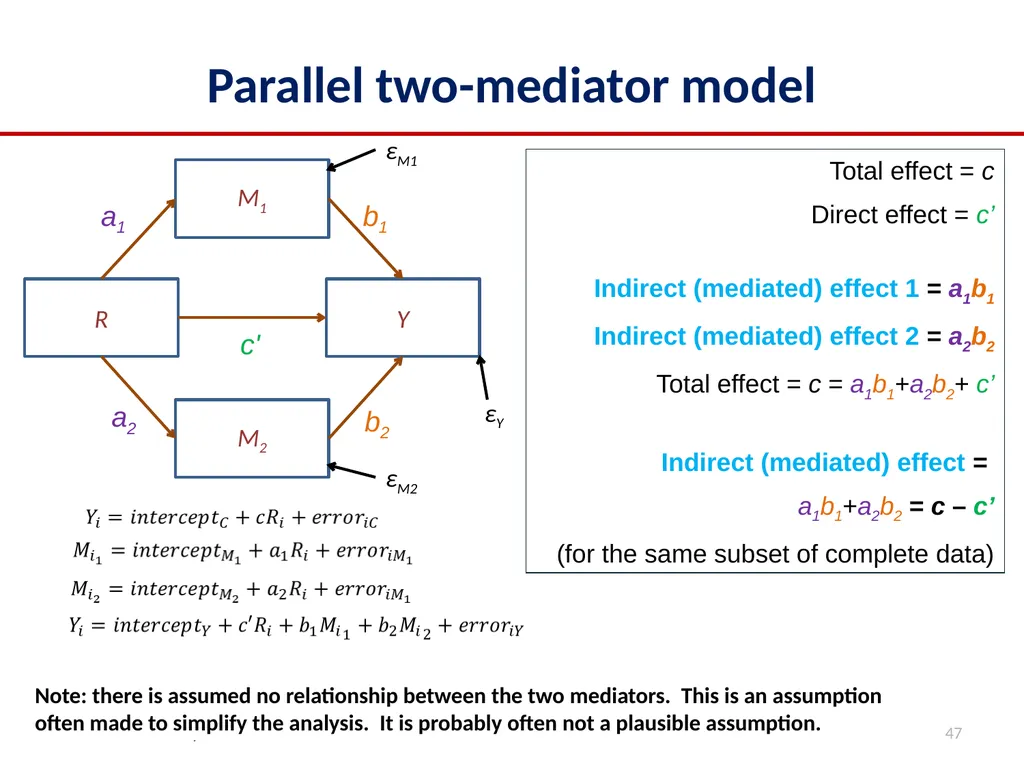
Parallel two-mediator model IoPPN 4th – 8th July 2016 47 Note: there is assumed no relationship between the two mediators. This is an assumption often made to simplify the analysis. It is probably often not a plausible assumption. Total effect = c
Direct effect = c’
Indirect (mediated) effect 1 = a1b1
Indirect (mediated) effect 2 = a2b2
Total effect = c = a1b1+a2b2+ c’
Indirect (mediated) effect =
a1b1+a2b2 = c – c’
(for the same subset of complete data)<br>
Direct effect = c’
Indirect (mediated) effect 1 = a1b1
Indirect (mediated) effect 2 = a2b2
Total effect = c = a1b1+a2b2+ c’
Indirect (mediated) effect =
a1b1+a2b2 = c – c’
(for the same subset of complete data)<br>
47
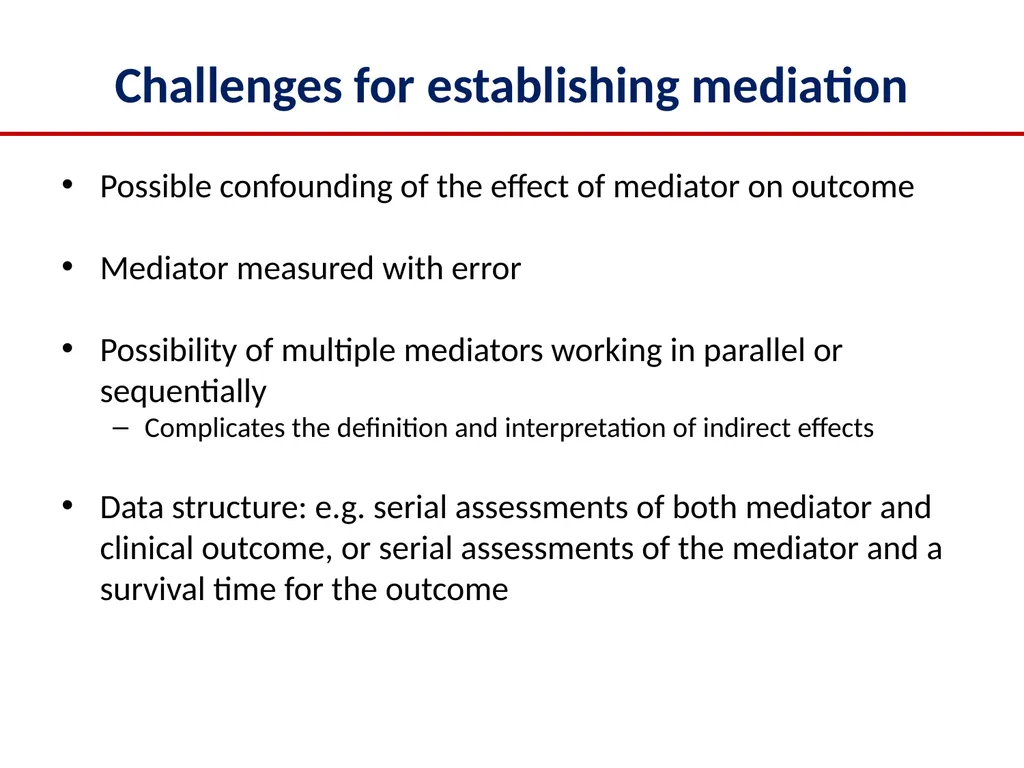
Possible confounding of the effect of mediator on outcome
Mediator measured with error
Possibility of multiple mediators working in parallel or sequentially
Complicates the definition and interpretation of indirect effects
Data structure: e.g. serial assessments of both mediator and clinical outcome, or serial assessments of the mediator and a survival time for the outcome Challenges for establishing mediation<br>
Mediator measured with error
Possibility of multiple mediators working in parallel or sequentially
Complicates the definition and interpretation of indirect effects
Data structure: e.g. serial assessments of both mediator and clinical outcome, or serial assessments of the mediator and a survival time for the outcome Challenges for establishing mediation<br>
48
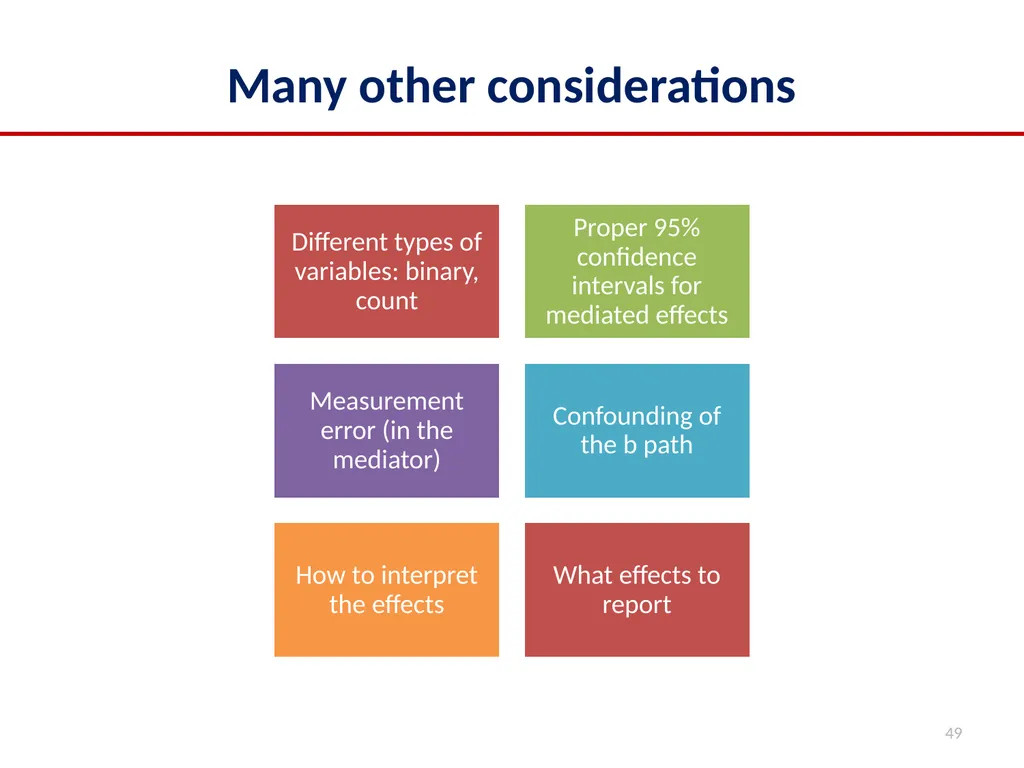
Many other considerations 49<br>
49
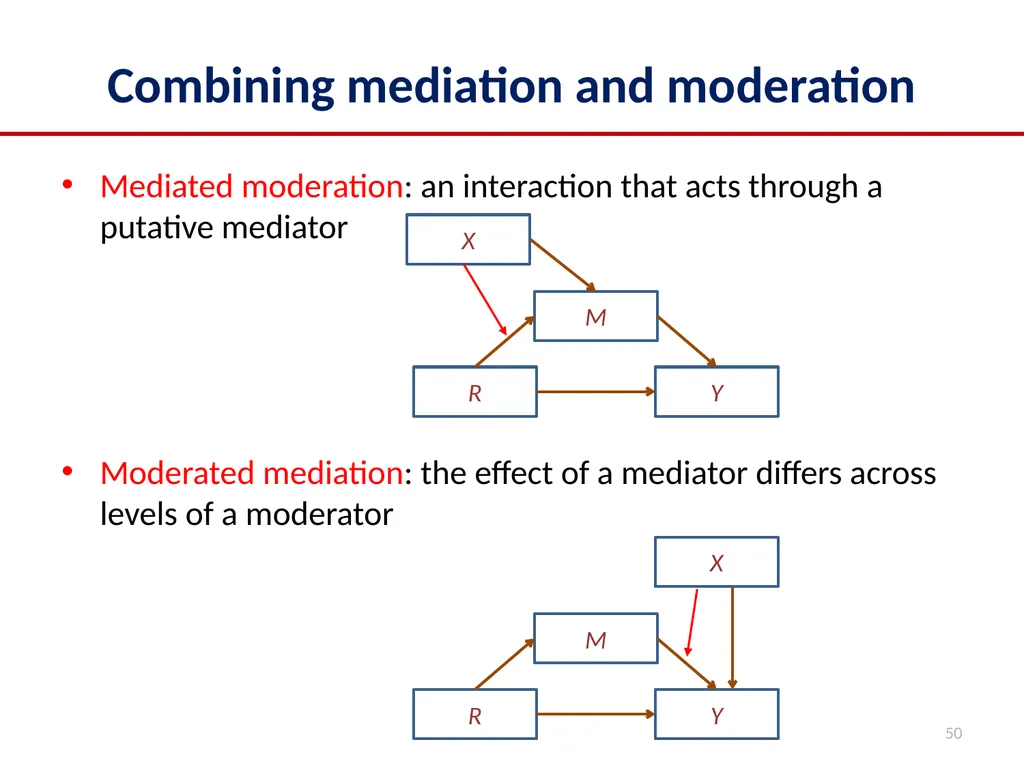
Combining mediation and moderation Mediated moderation: an interaction that acts through a putative mediator
Moderated mediation: the effect of a mediator differs across levels of a moderator 50<br>
Moderated mediation: the effect of a mediator differs across levels of a moderator 50<br>
50
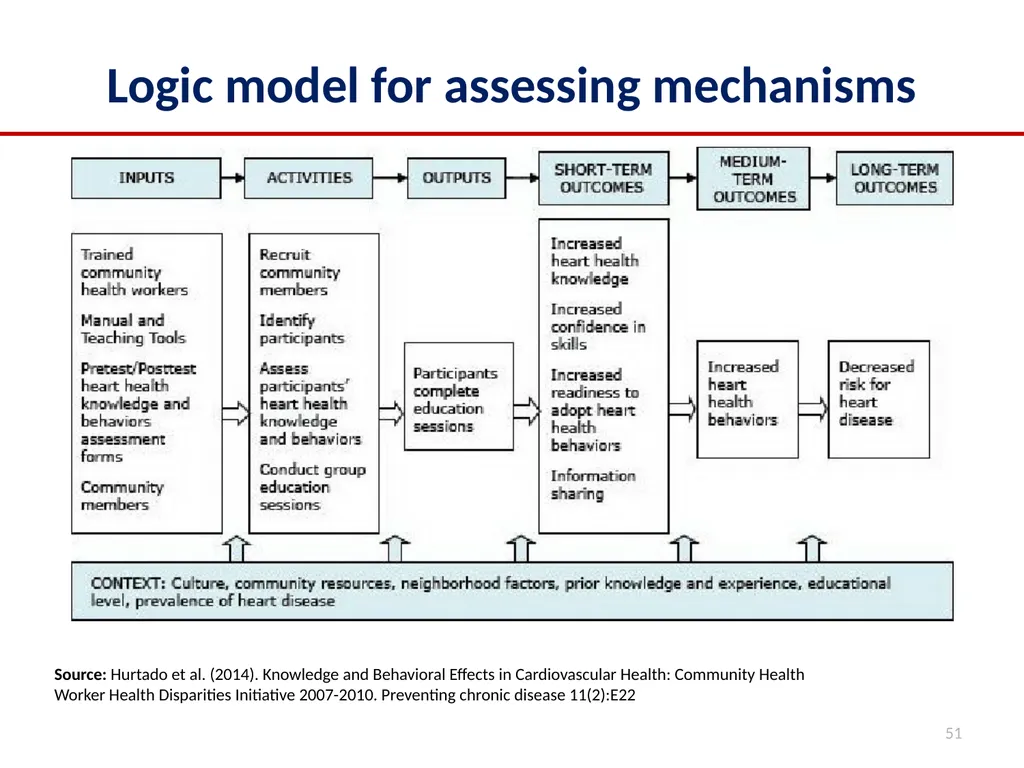
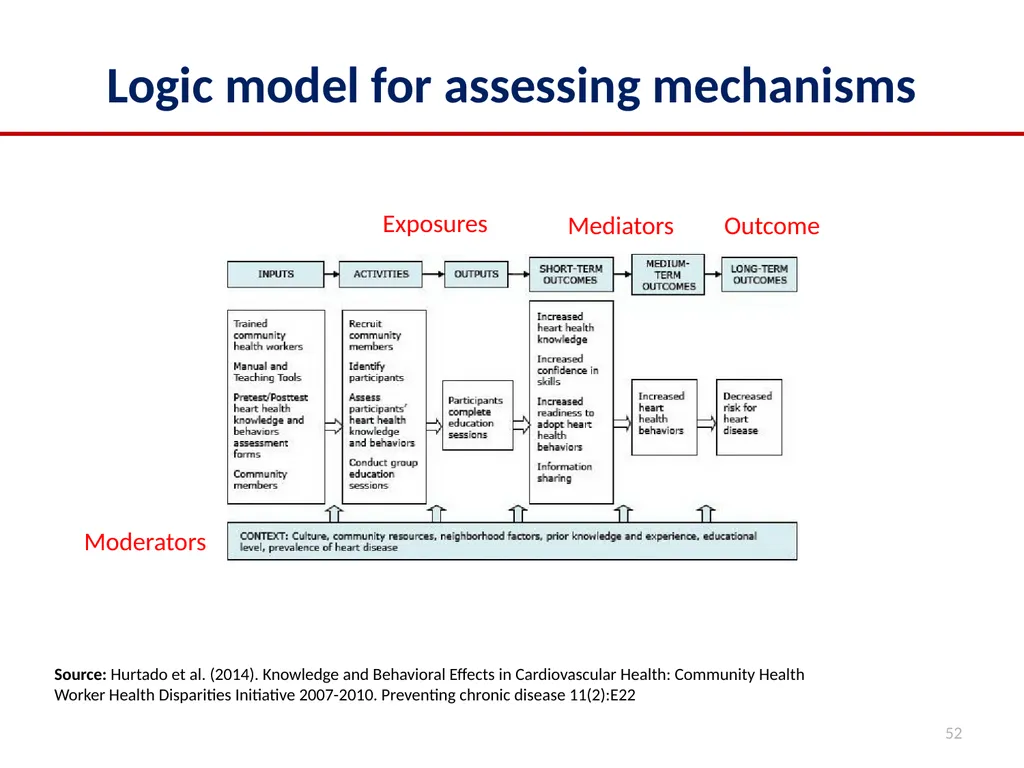
Logic model for assessing mechanisms 51 Source: Hurtado et al. (2014). Knowledge and Behavioral Effects in Cardiovascular Health: Community Health Worker Health Disparities Initiative 2007-2010. Preventing chronic disease 11(2):E22<br>
51
Logic model for assessing mechanisms 52 Source: Hurtado et al. (2014). Knowledge and Behavioral Effects in Cardiovascular Health: Community Health Worker Health Disparities Initiative 2007-2010. Preventing chronic disease 11(2):E22 Mediators Outcome Moderators Exposures<br>
52
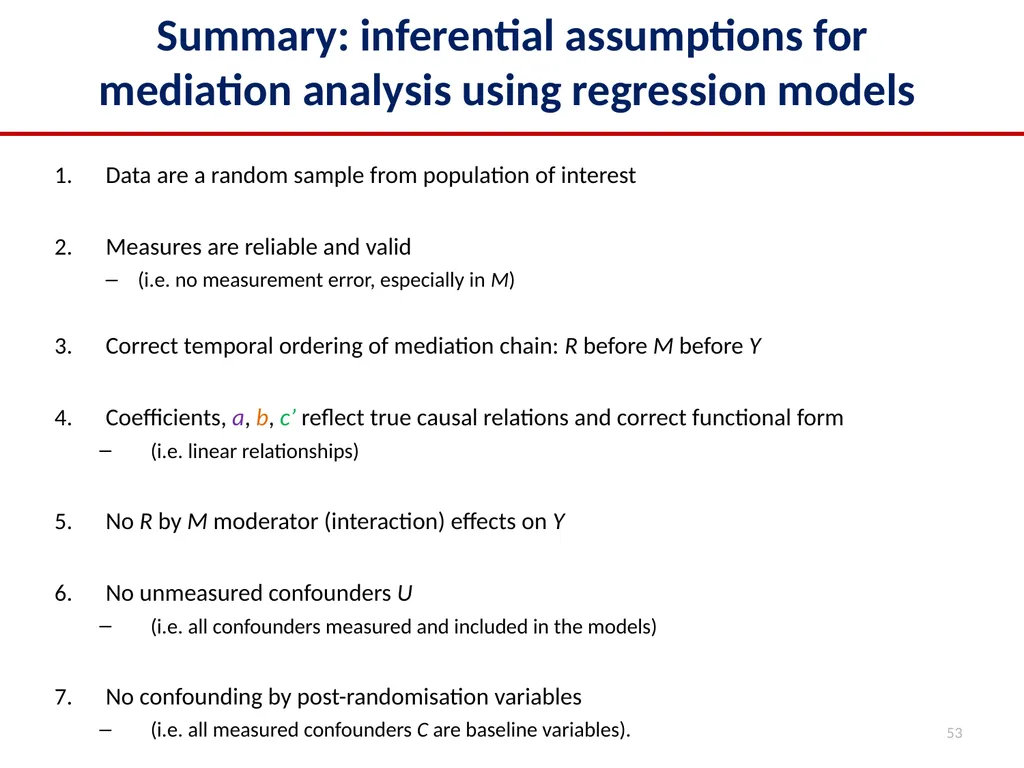
Summary: inferential assumptions for mediation analysis using regression models Data are a random sample from population of interest
Measures are reliable and valid
(i.e. no measurement error, especially in M)
Correct temporal ordering of mediation chain: R before M before Y
Coefficients, a, b, c’ reflect true causal relations and correct functional form
(i.e. linear relationships)
No R by M moderator (interaction) effects on Y
No unmeasured confounders U
(i.e. all confounders measured and included in the models)
No confounding by post-randomisation variables
(i.e. all measured confounders C are baseline variables). 53<br>
Measures are reliable and valid
(i.e. no measurement error, especially in M)
Correct temporal ordering of mediation chain: R before M before Y
Coefficients, a, b, c’ reflect true causal relations and correct functional form
(i.e. linear relationships)
No R by M moderator (interaction) effects on Y
No unmeasured confounders U
(i.e. all confounders measured and included in the models)
No confounding by post-randomisation variables
(i.e. all measured confounders C are baseline variables). 53<br>
53
Extensions to multilevel models 54<br>
54
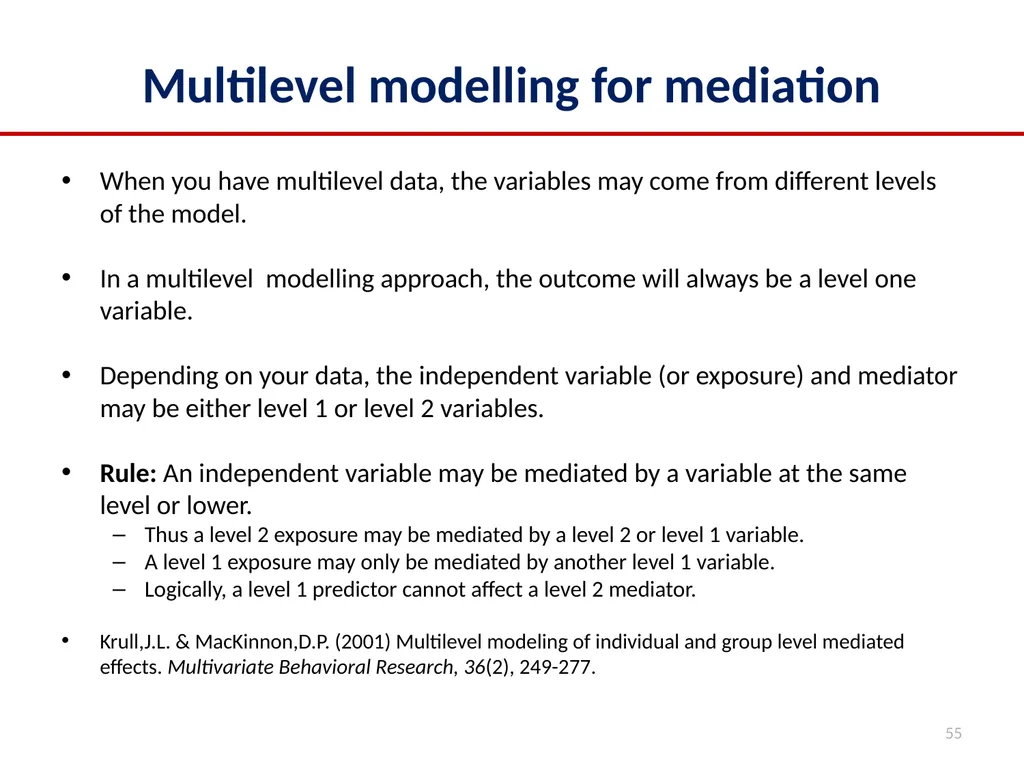
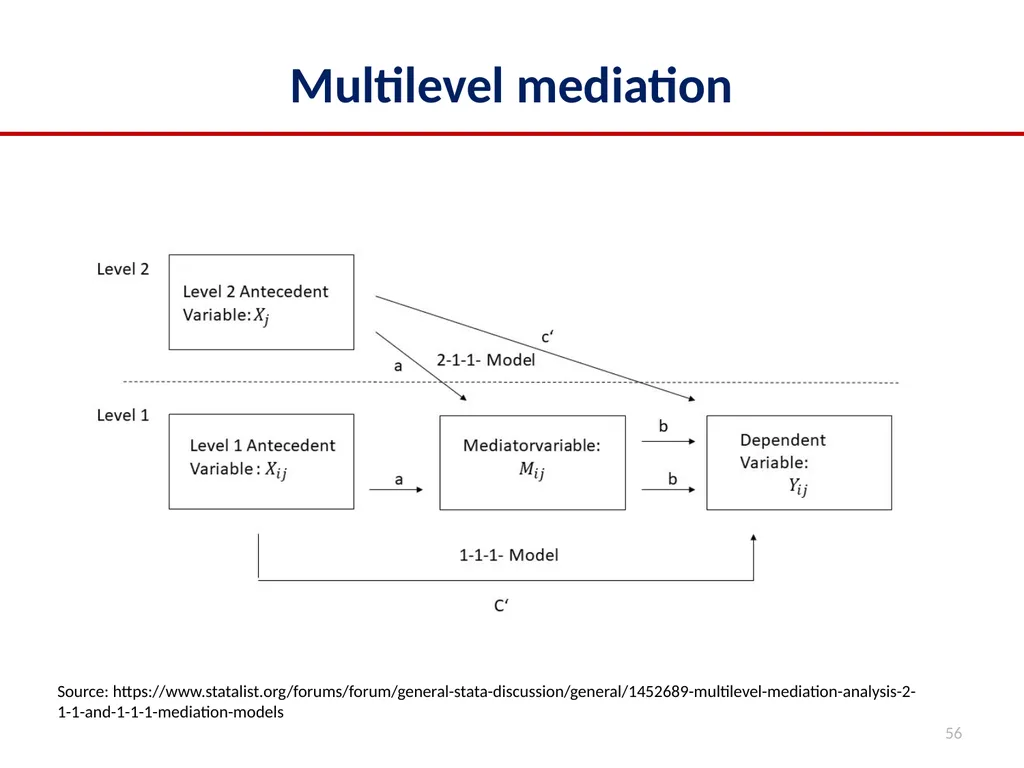
Multilevel modelling for mediation When you have multilevel data, the variables may come from different levels of the model.
In a multilevel modelling approach, the outcome will always be a level one variable.
Depending on your data, the independent variable (or exposure) and mediator may be either level 1 or level 2 variables.
Rule: An independent variable may be mediated by a variable at the same level or lower.
Thus a level 2 exposure may be mediated by a level 2 or level 1 variable.
A level 1 exposure may only be mediated by another level 1 variable.
Logically, a level 1 predictor cannot affect a level 2 mediator.
Krull,J.L. & MacKinnon,D.P. (2001) Multilevel modeling of individual and group level mediated effects. Multivariate Behavioral Research, 36(2), 249-277. 55<br>
In a multilevel modelling approach, the outcome will always be a level one variable.
Depending on your data, the independent variable (or exposure) and mediator may be either level 1 or level 2 variables.
Rule: An independent variable may be mediated by a variable at the same level or lower.
Thus a level 2 exposure may be mediated by a level 2 or level 1 variable.
A level 1 exposure may only be mediated by another level 1 variable.
Logically, a level 1 predictor cannot affect a level 2 mediator.
Krull,J.L. & MacKinnon,D.P. (2001) Multilevel modeling of individual and group level mediated effects. Multivariate Behavioral Research, 36(2), 249-277. 55<br>
55
Multilevel mediation 56 Source: https://www.statalist.org/forums/forum/general-stata-discussion/general/1452689-multilevel-mediation-analysis-2-1-1-and-1-1-1-mediation-models<br>
56
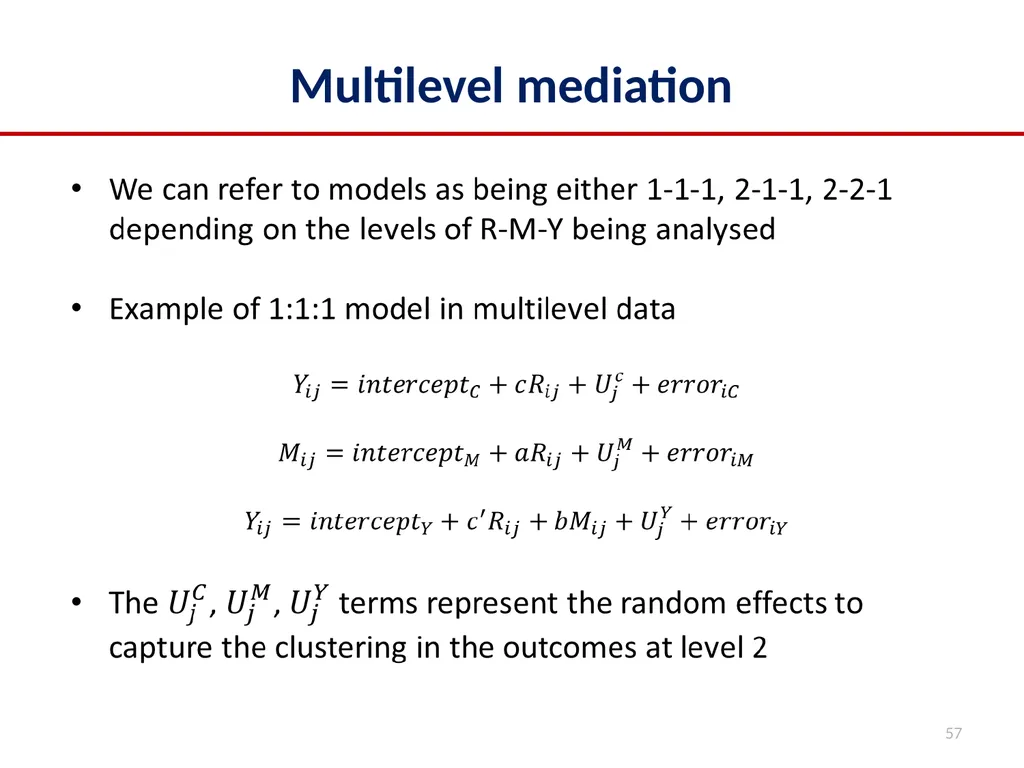
Multilevel mediation 57<br>
57
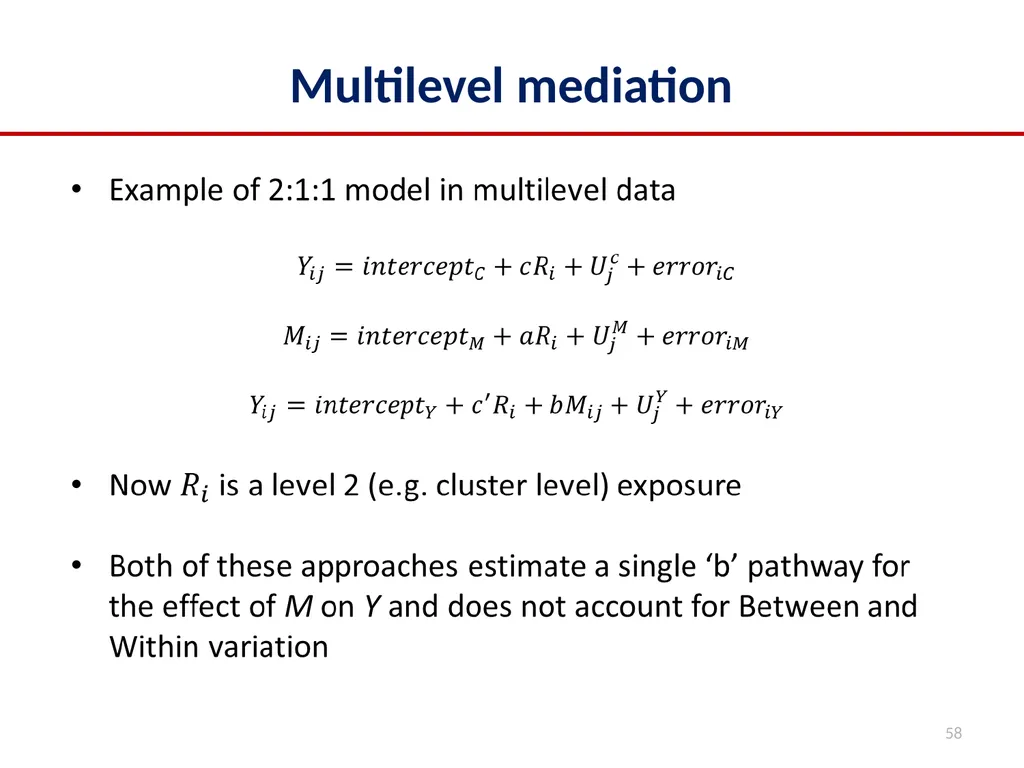
Multilevel mediation 58<br>
58
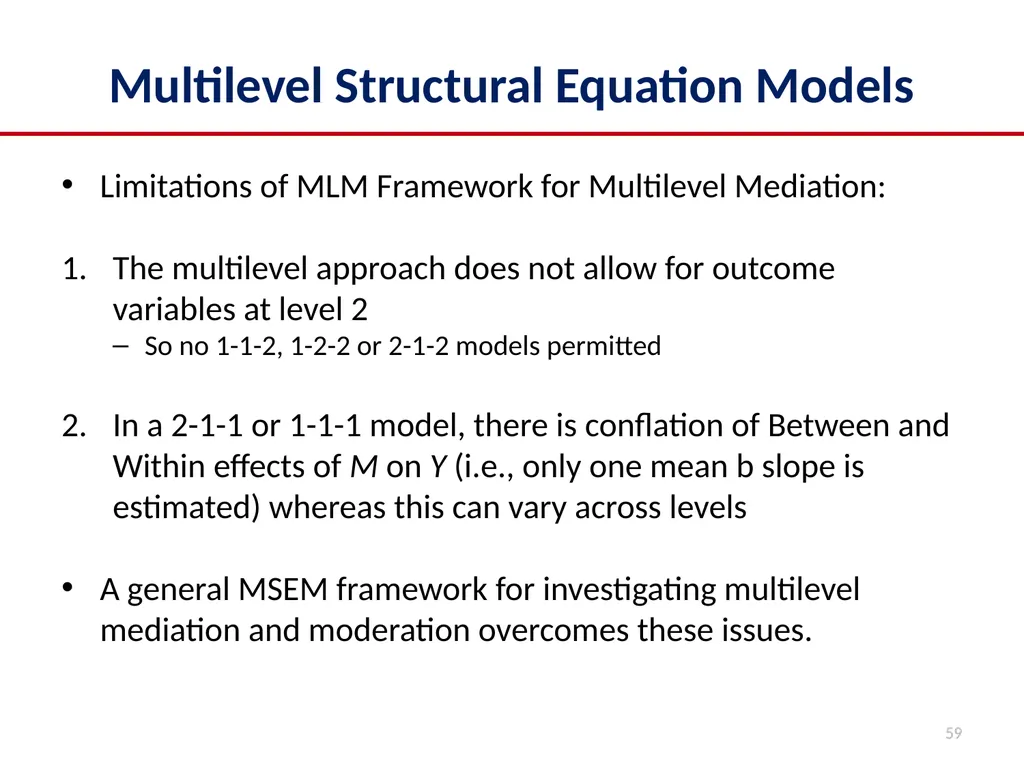
Multilevel Structural Equation Models Limitations of MLM Framework for Multilevel Mediation:
The multilevel approach does not allow for outcome variables at level 2
So no 1-1-2, 1-2-2 or 2-1-2 models permitted
In a 2-1-1 or 1-1-1 model, there is conflation of Between and Within effects of M on Y (i.e., only one mean b slope is estimated) whereas this can vary across levels
A general MSEM framework for investigating multilevel mediation and moderation overcomes these issues. 59<br>
The multilevel approach does not allow for outcome variables at level 2
So no 1-1-2, 1-2-2 or 2-1-2 models permitted
In a 2-1-1 or 1-1-1 model, there is conflation of Between and Within effects of M on Y (i.e., only one mean b slope is estimated) whereas this can vary across levels
A general MSEM framework for investigating multilevel mediation and moderation overcomes these issues. 59<br>
59
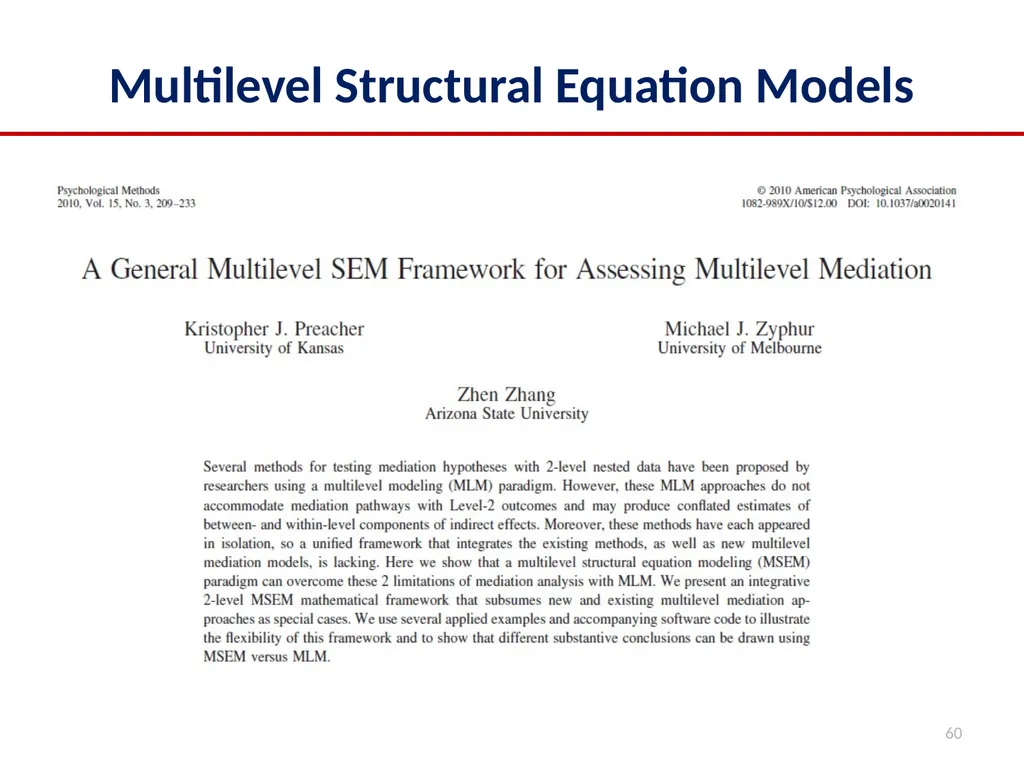
Multilevel Structural Equation Models 60<br>
60
Session summary Evaluation of moderation or effect modification can be assessed by including interaction effects in regression models
Can be used in mediation models as well e.g. mediated moderation and moderated mediation
In a randomised trial, if the treatment doesn’t effect the mediator, then there can’t be mediation through that variable.
Only aspect which can be tested unbiasedly?
The models for mediation should be the same as used for modelling the outcomes
This is particularly important for multilevel interventions that require multilevel modelling to account for different levels of exposures, mediators and outcomes
Mediation analysis contains a lot of implicit assumptions but validity of the estimates depend on these assumptions! 61<br>
Can be used in mediation models as well e.g. mediated moderation and moderated mediation
In a randomised trial, if the treatment doesn’t effect the mediator, then there can’t be mediation through that variable.
Only aspect which can be tested unbiasedly?
The models for mediation should be the same as used for modelling the outcomes
This is particularly important for multilevel interventions that require multilevel modelling to account for different levels of exposures, mediators and outcomes
Mediation analysis contains a lot of implicit assumptions but validity of the estimates depend on these assumptions! 61<br>
61
Thank you for the invite and your attention Email: richard.emsley@kcl.ac.uk
Twitter: @richardaemsley<br>
Twitter: @richardaemsley<br>