01
A Practical Workshop on EXAFS Shell Fitting for Environmental Samples Matt Siebecker, PhD
Delaware Environmental Institute
August 19, 2016 Part 2<br>
02
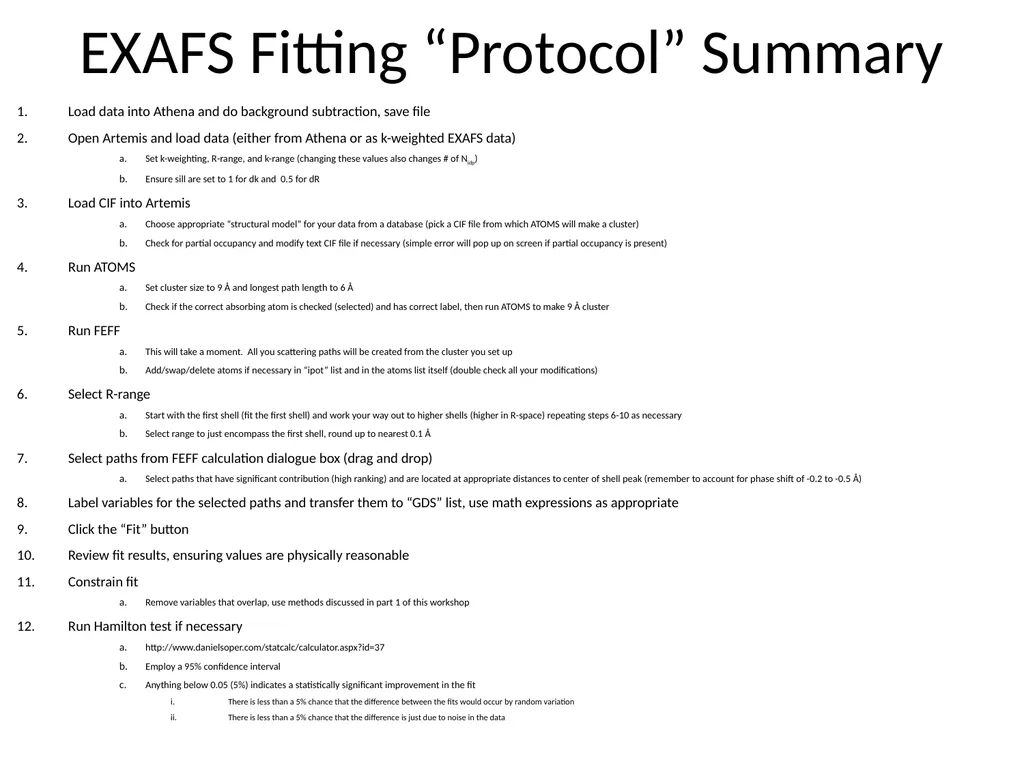
EXAFS Fitting “Protocol” Summary Load data into Athena and do background subtraction, save file
Open Artemis and load data (either from Athena or as k-weighted EXAFS data)
Set k-weighting, R-range, and k-range (changing these values also changes # of Nidp)
Ensure sill are set to 1 for dk and 0.5 for dR
Load CIF into Artemis
Choose appropriate “structural model” for your data from a database (pick a CIF file from which ATOMS will make a cluster)
Check for partial occupancy and modify text CIF file if necessary (simple error will pop up on screen if partial occupancy is present)
Run ATOMS
Set cluster size to 9 Å and longest path length to 6 Å
Check if the correct absorbing atom is checked (selected) and has correct label, then run ATOMS to make 9 Å cluster
Run FEFF
This will take a moment. All you scattering paths will be created from the cluster you set up
Add/swap/delete atoms if necessary in “ipot” list and in the atoms list itself (double check all your modifications)
Select R-range
Start with the first shell (fit the first shell) and work your way out to higher shells (higher in R-space) repeating steps 6-10 as necessary
Select range to just encompass the first shell, round up to nearest 0.1 Å
Select paths from FEFF calculation dialogue box (drag and drop)
Select paths that have significant contribution (high ranking) and are located at appropriate distances to center of shell peak (remember to account for phase shift of -0.2 to -0.5 Å)
Label variables for the selected paths and transfer them to “GDS” list, use math expressions as appropriate
Click the “Fit” button
Review fit results, ensuring values are physically reasonable
Constrain fit
Remove variables that overlap, use methods discussed in part 1 of this workshop
Run Hamilton test if necessary
http://www.danielsoper.com/statcalc/calculator.aspx?id=37
Employ a 95% confidence interval
Anything below 0.05 (5%) indicates a statistically significant improvement in the fit
There is less than a 5% chance that the difference between the fits would occur by random variation
There is less than a 5% chance that the difference is just due to noise in the data<br>