
Attribute Control Charts (p Chart) When to use
Description: Attribute Control Charts (p Chart) When to use this tool Use the p Chart to assess trends and patterns in counts of binary events (e.g., successes, failures, defectives) over time. The p Chart plots the proportion of events in subgroups of
Related Topics
Download Presentation
"Attribute Control Charts (p Chart) When to use" is the property of its rightful owner. Permission is granted to download and print the materials on this website for personal, non-commercial use only, and to display it on your personal computer provided you do not modify the materials and that you retain all copyright notices contained in the materials. By downloading content from our website, you accept the terms of this agreement.
Presentation Transcript
slide1. Attribute Control Charts (p Chart) When to use this tool
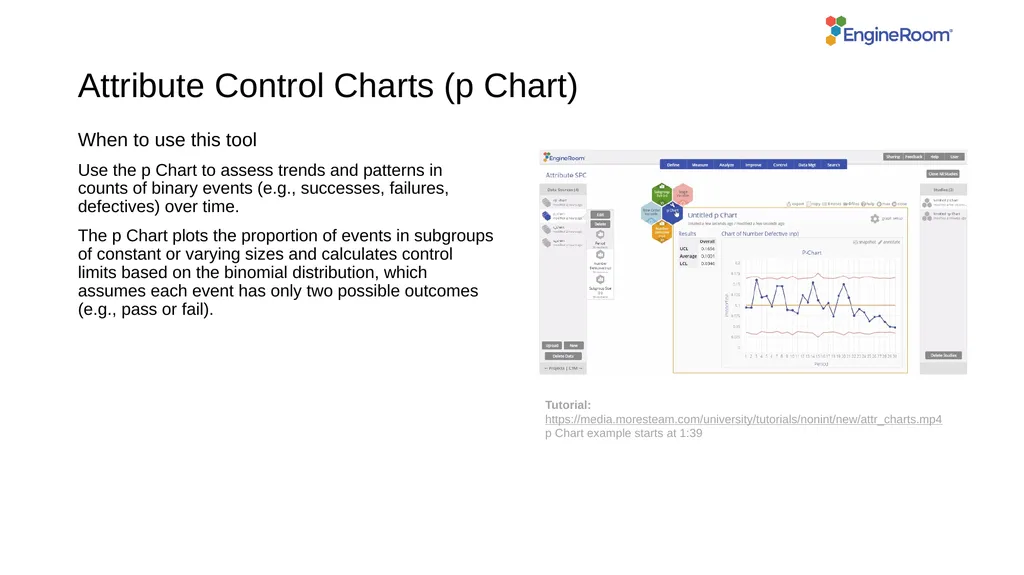
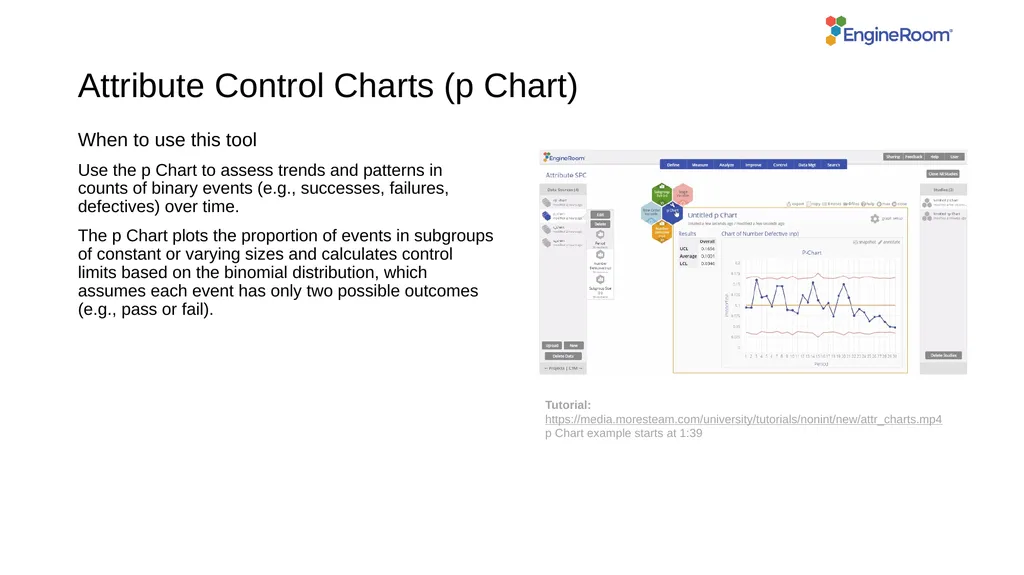
Use the p Chart to assess trends and patterns in counts of binary events (e.g., successes, failures, defectives) over time.
The p Chart plots the proportion of events in subgroups of constant or varying sizes and calculates control limits based on the binomial distribution, which assumes each event has only two possible outcomes (e.g., pass or fail). Tutorial:
https://media.moresteam.com/university/tutorials/nonint/new/attr_charts.mp4
p Chart example starts at 1:39<br>
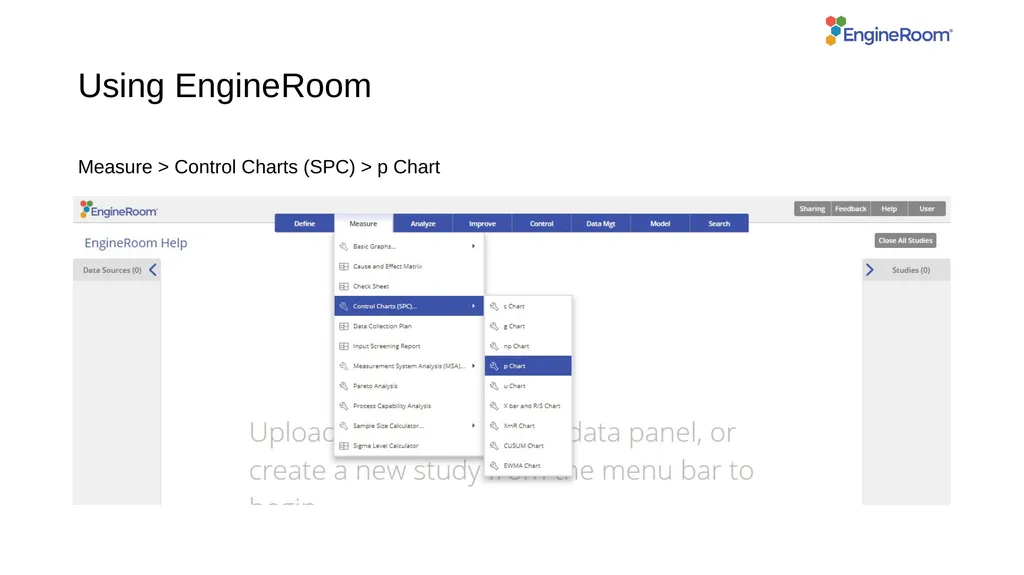
slide2. Using EngineRoom Measure > Control Charts (SPC) > p Chart<br>
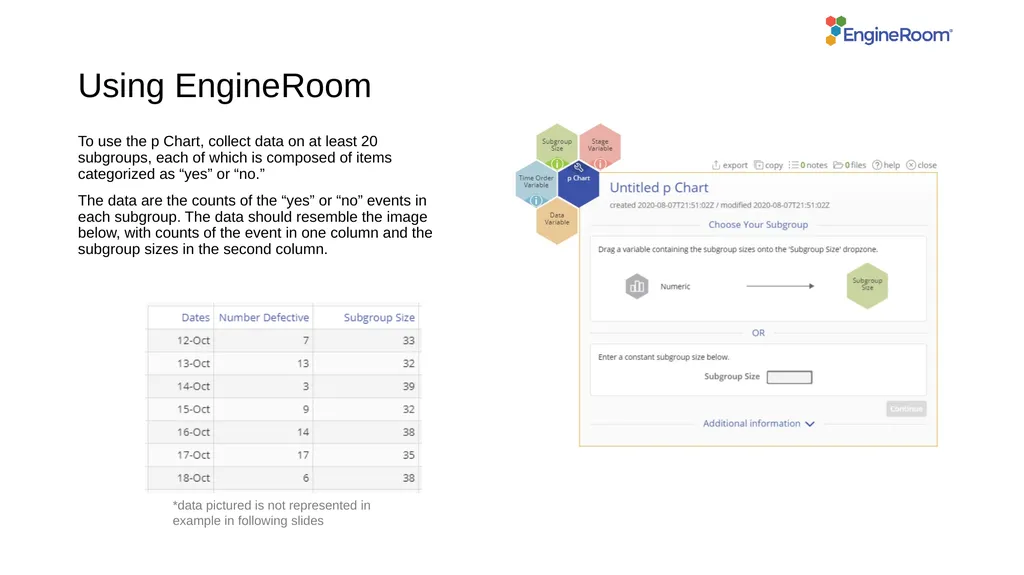
slide3. Using EngineRoom To use the p Chart, collect data on at least 20 subgroups, each of which is composed of items categorized as “yes” or “no.”
The data are the counts of the “yes” or “no” events in each subgroup. The data should resemble the image below, with counts of the event in one column and the subgroup sizes in the second column. *data pictured is not represented in example in following slides<br>
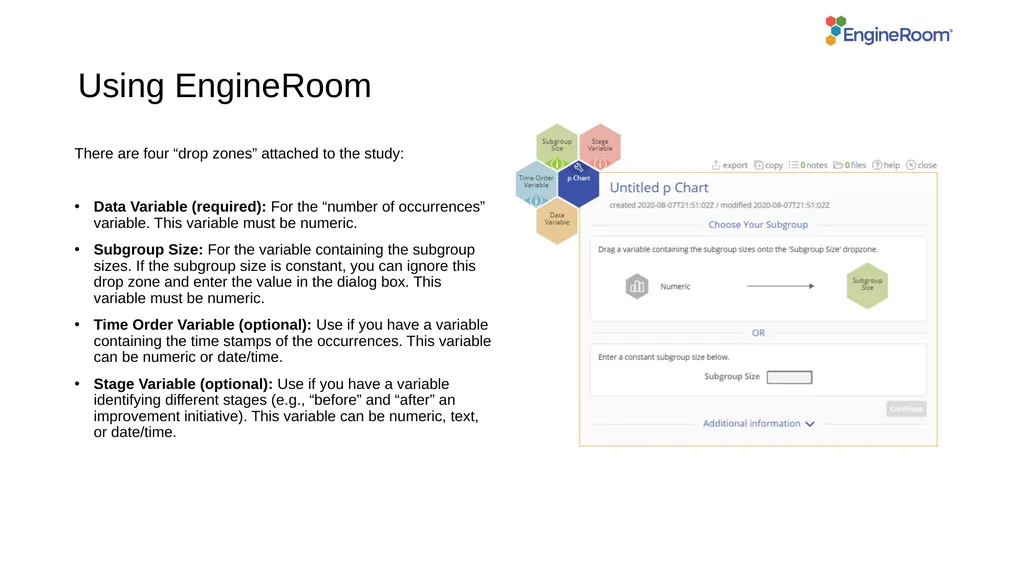
slide4. Using EngineRoom There are four “drop zones” attached to the study:
Data Variable (required): For the “number of occurrences” variable. This variable must be numeric.
Subgroup Size: For the variable containing the subgroup sizes. If the subgroup size is constant, you can ignore this drop zone and enter the value in the dialog box. This variable must be numeric.
Time Order Variable (optional): Use if you have a variable containing the time stamps of the occurrences. This variable can be numeric or date/time.
Stage Variable (optional): Use if you have a variable identifying different stages (e.g., “before” and “after” an improvement initiative). This variable can be numeric, text, or date/time.<br>
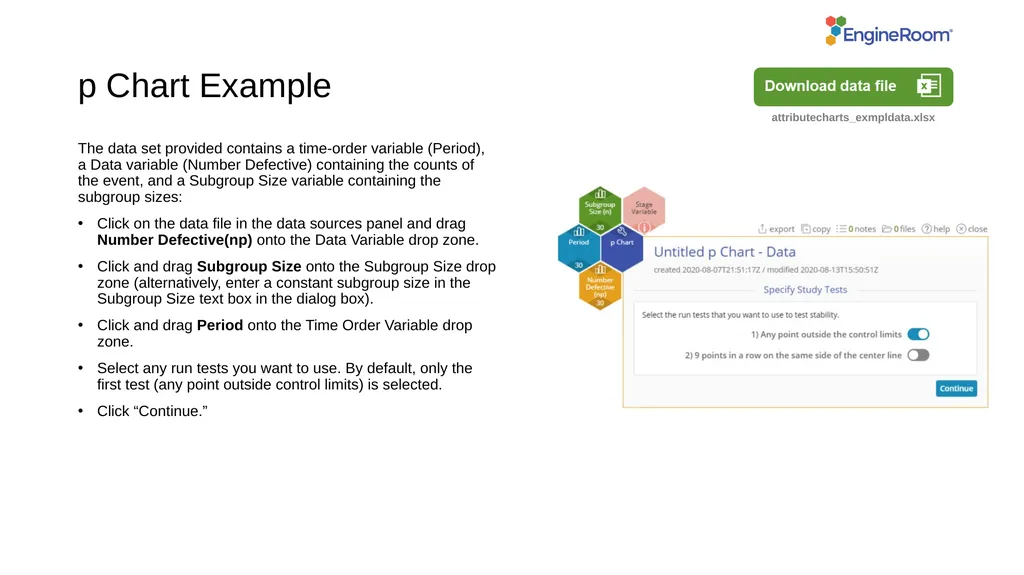
slide5. p Chart Example The data set provided contains a time-order variable (Period), a Data variable (Number Defective) containing the counts of the event, and a Subgroup Size variable containing the subgroup sizes:
Click on the data file in the data sources panel and drag Number Defective(np) onto the Data Variable drop zone.
Click and drag Subgroup Size onto the Subgroup Size drop zone (alternatively, enter a constant subgroup size in the Subgroup Size text box in the dialog box).
Click and drag Period onto the Time Order Variable drop zone.
Select any run tests you want to use. By default, only the first test (any point outside control limits) is selected.
Click “Continue.” attributecharts_exmpldata.xlsx<br>
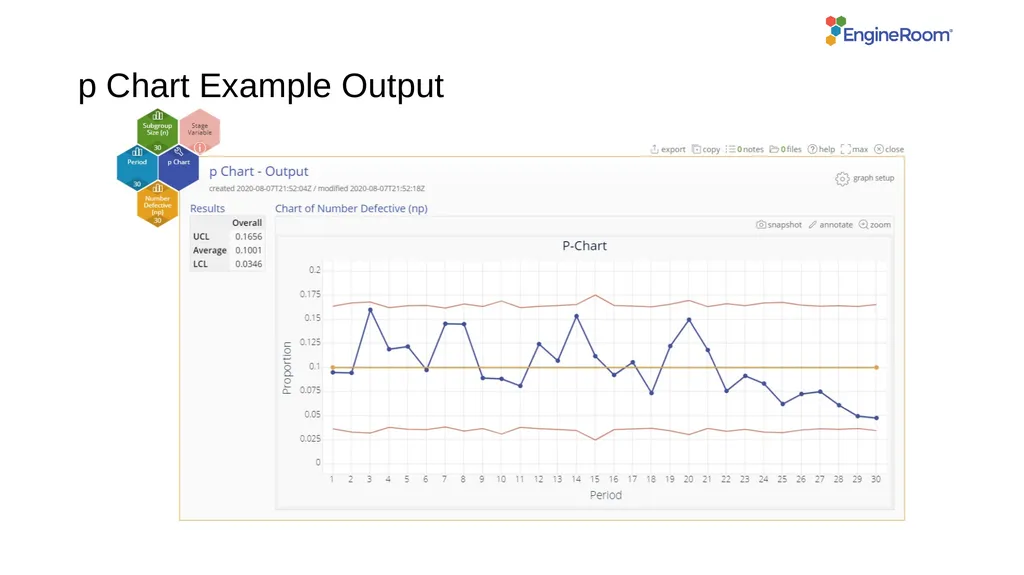
slide6. p Chart Example Output<br>
Use the p Chart to assess trends and patterns in counts of binary events (e.g., successes, failures, defectives) over time.
The p Chart plots the proportion of events in subgroups of constant or varying sizes and calculates control limits based on the binomial distribution, which assumes each event has only two possible outcomes (e.g., pass or fail). Tutorial:
https://media.moresteam.com/university/tutorials/nonint/new/attr_charts.mp4
p Chart example starts at 1:39<br>
slide2. Using EngineRoom Measure > Control Charts (SPC) > p Chart<br>
slide3. Using EngineRoom To use the p Chart, collect data on at least 20 subgroups, each of which is composed of items categorized as “yes” or “no.”
The data are the counts of the “yes” or “no” events in each subgroup. The data should resemble the image below, with counts of the event in one column and the subgroup sizes in the second column. *data pictured is not represented in example in following slides<br>
slide4. Using EngineRoom There are four “drop zones” attached to the study:
Data Variable (required): For the “number of occurrences” variable. This variable must be numeric.
Subgroup Size: For the variable containing the subgroup sizes. If the subgroup size is constant, you can ignore this drop zone and enter the value in the dialog box. This variable must be numeric.
Time Order Variable (optional): Use if you have a variable containing the time stamps of the occurrences. This variable can be numeric or date/time.
Stage Variable (optional): Use if you have a variable identifying different stages (e.g., “before” and “after” an improvement initiative). This variable can be numeric, text, or date/time.<br>
slide5. p Chart Example The data set provided contains a time-order variable (Period), a Data variable (Number Defective) containing the counts of the event, and a Subgroup Size variable containing the subgroup sizes:
Click on the data file in the data sources panel and drag Number Defective(np) onto the Data Variable drop zone.
Click and drag Subgroup Size onto the Subgroup Size drop zone (alternatively, enter a constant subgroup size in the Subgroup Size text box in the dialog box).
Click and drag Period onto the Time Order Variable drop zone.
Select any run tests you want to use. By default, only the first test (any point outside control limits) is selected.
Click “Continue.” attributecharts_exmpldata.xlsx<br>
slide6. p Chart Example Output<br>