Black Belt Project Storyboard Template Visit GoLeanSixSigma.com for more Lean Six Sigma Resources Storyboard: The 5 Tenets Tell Your Story Make sure the flow is logical and the pictures do most of the work make it clear to the reader what
"Black Belt Project Storyboard Template Visit" is the property of its rightful owner. Permission is granted to
download and print the materials on this website for personal, non-commercial use only, and to display it
on your personal computer provided you do not modify the materials and that you retain all copyright
notices contained in the materials. By downloading content from our website, you accept the terms of this
agreement.
Presentation Transcript
01
Black Belt Project Storyboard Template Visit GoLeanSixSigma.com for more Lean Six Sigma Resources<br>
02
Storyboard: The 5 Tenets Tell Your Story
Make sure the flow is logical and the pictures do most of the work – make it clear to the reader what you learned at each step
Use the Tools
Show that you understand the DMAIC method and made good use of the tools and templates available to you
Label Your Graphs
List the metric name, the time frame and the takeaways for each chart
Show the Improvement
Make accomplishments clear – list each waste reduction, savings, revenue increase, cycle time reduction and customer satisfaction
Use the Appendix
Save back-up documentation, reference material and any extra graphs and tools in case readers would like more information<br>
03
Executive Summary Questions & Activities to Address:
Use the Executive Summary template
Business Case: List the Business Case or Problem Statement from the Project Charter
Goal: List the Goal Statement from the Project Charter
Finding Highlights: List a bulleted list of Quick Wins, discoveries and other improvements that resulted from the project
Results: List the project savings, gains, cost avoidance, cycle time reduction, customer satisfaction, etc.<br>
04
Key Words List all words and acronyms that are specific to your industry and key to understanding your project
Provide a brief description or definition of each term
List in alphabetical order
Keep in mind that this document will be viewed by those who are not in your industry or familiar with your process or industry<br>
05
Define Phase Questions & Activities to Address:
How and why the project was selected?
Who was the customer and what did they require?
Was the process data or process driven?
What kind of map did you use (Swimlane, Value Stream, etc.)
Did you complete an 8 Wastes assessment of the process?
Did you complete a 5S Assessment (or in the Improve Phase)?<br>
06
Potential Define Visuals Project Charter or A3
SIPOC
Swimlane Process Map, Value Stream Map, other
VOC Translation Matrix
Primary Metric Chart (Baseline data if available)
8 Wastes Checksheet
5S Transactional Assessment
5S Manufacturing Assessment<br>
07
Define Phase Tollgate Verify the project has a Champion/Sponsor and leadership backing
Get approval from a finance partner for the potential savings or projected revenue
Complete the elements of the Project Charter
Collect the Voice of the Customer and uncover any unknown requirements
Make customer requirements measurable
Create a high-level map of the process
Facilitate a team a Process Walk
Develop and verify a detailed map of the process
Conduct Stakeholder Analysis and develop an influence and communication plan<br>
08
Measure Phase Questions & Activities to Address:
What was the approach to Data Collection? (Who measured, when, for how long?)
What was the approach taken to validate that data collection method produces accurate results? (Measurement Systems Analysis?)
What is the understanding of the process baseline(s) measures and what is the gap between the baseline and the goal?
What were the results of the Process Walk?
What is the understanding of the potential issues?<br>
09
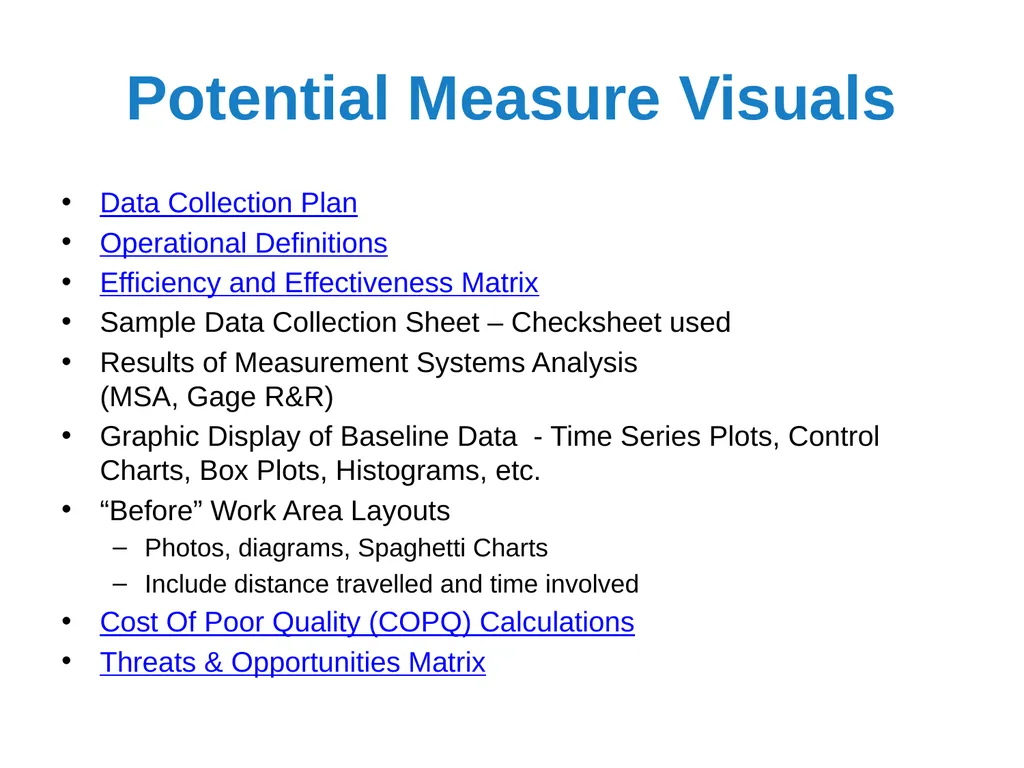
Potential Measure Visuals Data Collection Plan
Operational Definitions
Efficiency and Effectiveness Matrix
Sample Data Collection Sheet – Checksheet used
Results of Measurement Systems Analysis (MSA, Gage R&R)
Graphic Display of Baseline Data - Time Series Plots, Control Charts, Box Plots, Histograms, etc.
“Before” Work Area Layouts
Photos, diagrams, Spaghetti Charts
Include distance travelled and time involved
Cost Of Poor Quality (COPQ) Calculations
Threats & Opportunities Matrix<br>
10
Measure Phase Tollgate Select Baseline Measurements
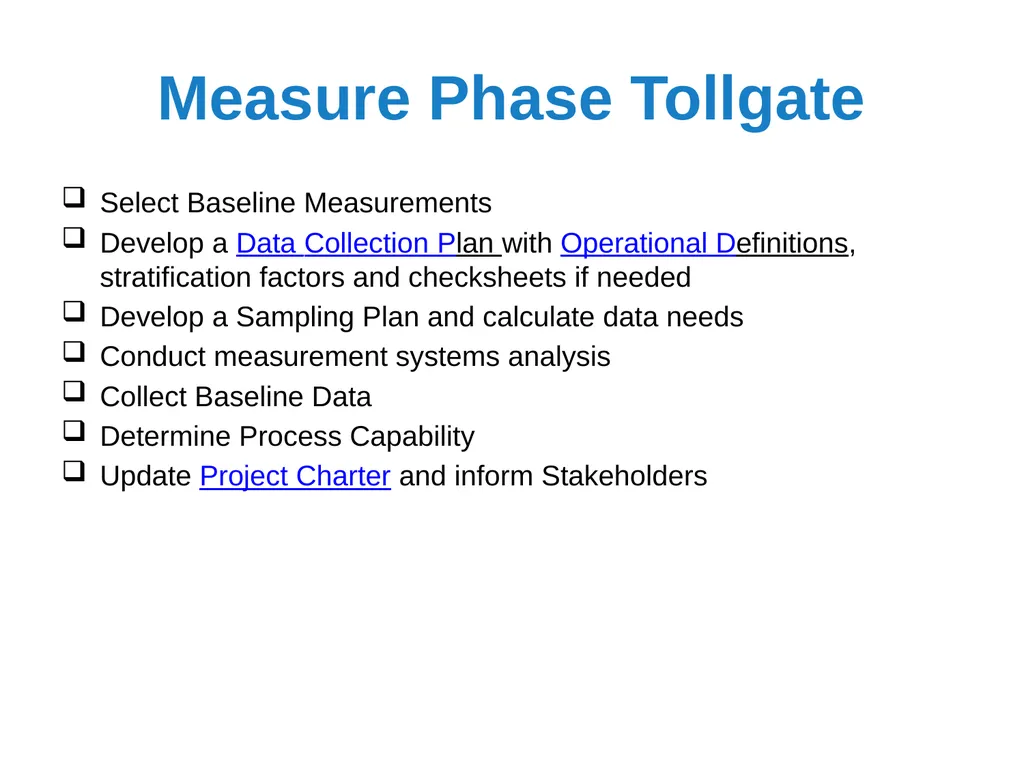
Develop a Data Collection Plan with Operational Definitions, stratification factors and checksheets if needed
Develop a Sampling Plan and calculate data needs
Conduct measurement systems analysis
Collect Baseline Data
Determine Process Capability
Update Project Charter and inform Stakeholders<br>
11
Analyze Questions & Activities to Address:
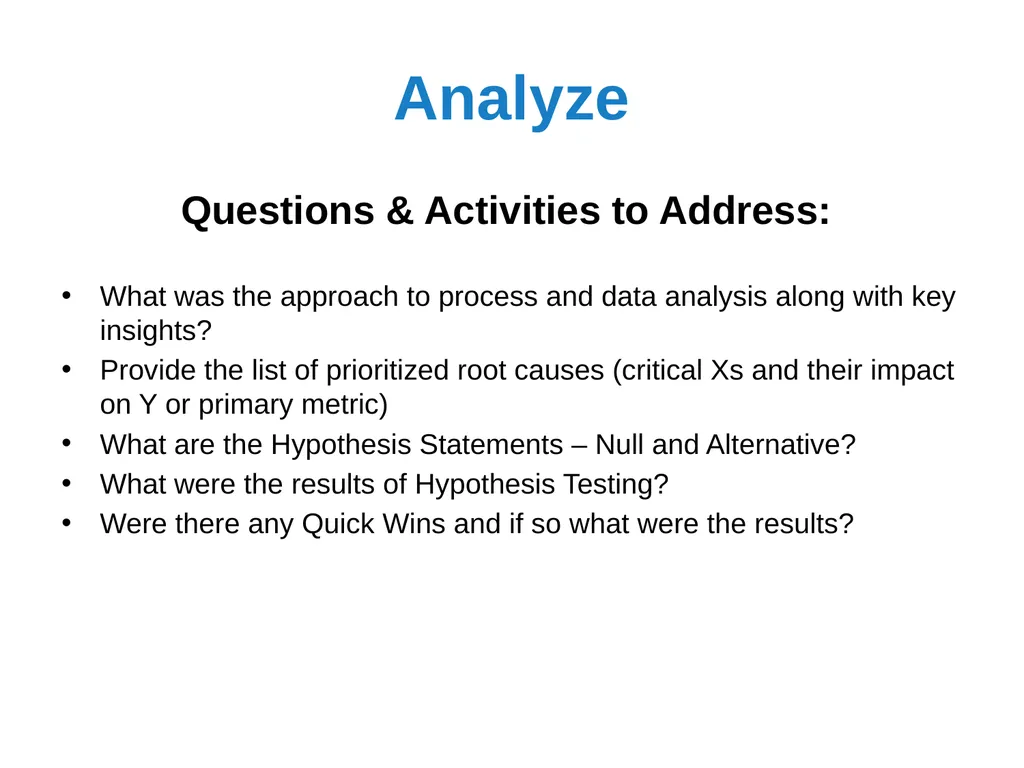
What was the approach to process and data analysis along with key insights?
Provide the list of prioritized root causes (critical Xs and their impact on Y or primary metric)
What are the Hypothesis Statements – Null and Alternative?
What were the results of Hypothesis Testing?
Were there any Quick Wins and if so what were the results?<br>
12
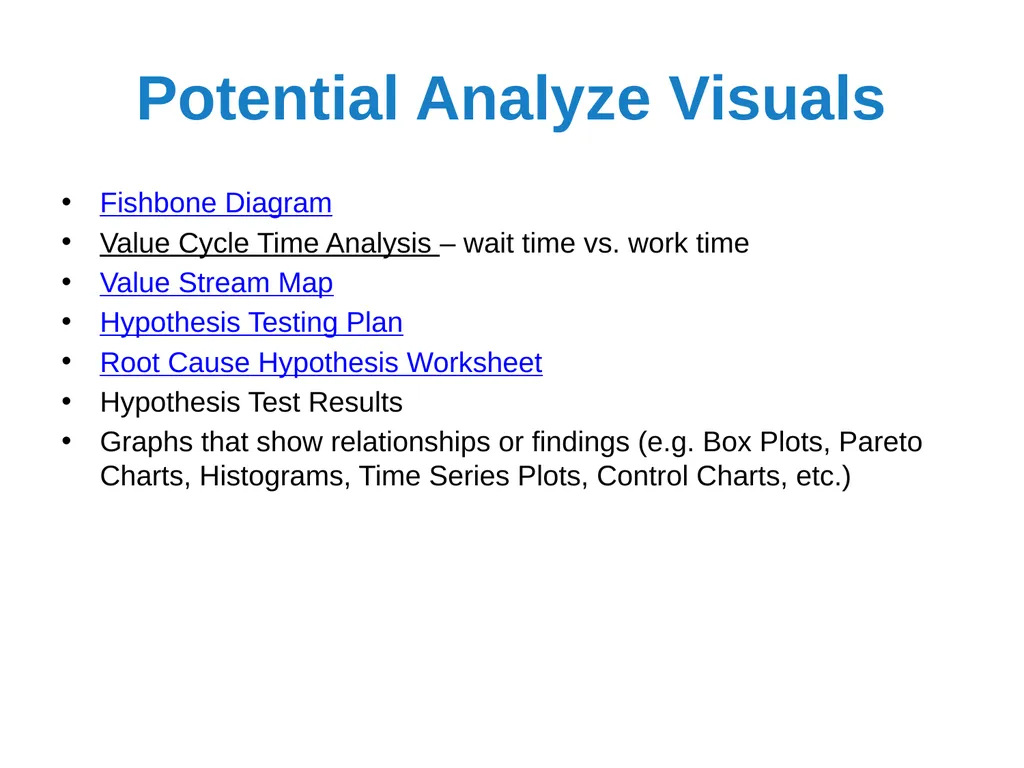
Potential Analyze Visuals Fishbone Diagram
Value Cycle Time Analysis – wait time vs. work time
Value Stream Map
Hypothesis Testing Plan
Root Cause Hypothesis Worksheet
Hypothesis Test Results
Graphs that show relationships or findings (e.g. Box Plots, Pareto Charts, Histograms, Time Series Plots, Control Charts, etc.)<br>
13
Analyze Tollgate Checklist Conduct Value and Cycle Time Analysis of the process to identify opportunities to reduce waste
Identify root causes using data analysis, process maps, Five Whys and Fishbone Diagrams
Develop a Root Cause Hypothesis and formal hypothesis statements
Collect data to run statistical tests and prove or disprove Root Cause Hypotheses
Check if the team has enough confidence in the analysis to move to the Improve Phase
Update the Project Charter and inform Stakeholders<br>
14
Improve Questions & Activities to Address:
Provide a list of improvements made and to-be made
Describe the approach to prioritizing and selecting solutions that eliminated root causes
Barriers and efforts to overcome them
Mistake-proofing and other risk management methods employed
Pilot results and changes made to solutions
Describe the Implementation Plan and results<br>
15
Potential Improve Visuals 5S Transactional Assessment
5S Manufacturing Assessment
Impact Effort Matrix
Weighted Criteria Matrix
Final Workplace Layout (updated Spaghetti Chart)
Cross Training Matrix
Training Plan
Pilot Plan
FMEA
Implementation Plan
Graphic display of change to Primary Metric (before and after)
Future State Map<br>
16
Improve Tollgate Checklist Use team brainstorming to generate solutions to address the root cause
Run a pilot of the solutions if needed
Create a Design of Experiments where appropriate
Assess and mitigate risk of process changes
Implement solutions to address root cause
Confirm that implemented solutions sufficiently affect the output Y
Celebrate with the team and recognize them for their efforts<br>
17
Control Questions & Activities to Address:
How the project will be monitored and what are the Response Plans?
Who is doing the monitoring, how often and how
Are the Trigger Measures based on Control Charts?
Will there be ongoing 5S inspections?
Describe the Control Plan that ensures the gains are maintained over the long term
What documentation and standardization has been completed regarding the improved process?
What visual management techniques will ensure adoption of process changes? (include pictures where appropriate)
How will you demonstrate improved process performance over baseline?
Control Charts, other
How has the Process Owner been prepared for hand-off and what is the Communication Plan?
What were the lessons learned?<br>
18
Potential Control Visuals Monitoring Plan
Response Plan
Control Plan
Control Chart and/or other graphical tacking methods
New Procedure Audit
Communication Plan
Innovation Transfer Opportunities
Executive Summary<br>
19
Control Tollgate Checklist Create a system and/or process to monitor results
Utilize Control Charts for ongoing monitoring of the output and key leading indicators
Finalize visual management of the process
Create Response Plans in case there is a drop in performance
Complete the Storyboard of the project
Assess innovation transfer opportunities
Hand over formal ownership to the process owner<br>
20
Appendix In the appendix, include any supporting documentation, process maps and data charts that you may use in your panel review to respond to questions or provide evidence of tool applications. Visit GoLeanSixSigma.com for more Lean Six Sigma Resources<br>