
Chapter 8 Relationships among Inflation, Interest
NS
Published · 38 slides · 0 views
1 / 1
Description
Chapter 8 Relationships among Inflation, Interest Rates and Exchange Rates Jeff Madura, International Financial Management, 14th Edition. 2021 Cengage. All Rights Reserved. May not be scanned, copied or duplicated, or posted to a publicly
Related Topics
Share
Embed code
Download this presentation From Below
"Chapter 8 Relationships among Inflation, Interest" is the property of its rightful owner. Permission is granted to download and print the materials on this website for personal, non-commercial use only, and to display it on your personal computer provided you do not modify the materials and that you retain all copyright notices contained in the materials. By downloading content from our website, you accept the terms of this agreement.
Presentation Transcript
01
Chapter 8 Relationships among Inflation, Interest Rates and Exchange Rates Jeff Madura, International Financial Management, 14th Edition. © 2021 Cengage. All Rights Reserved. May not be scanned, copied or duplicated, or posted to a publicly accessible website, in whole or in part.<br>
02
Chapter Objectives Explain the purchasing power parity (P P P) theory and its implications for exchange rate changes.
Explain the International Fisher effect (I F E) theory and its implications for exchange rate changes. 2<br>
Explain the International Fisher effect (I F E) theory and its implications for exchange rate changes. 2<br>
03
Purchasing Power Parity (P P P) (1 of 10) Interpretations of Purchasing Power Parity
Absolute Form of P P P: Without international barriers, consumers shift their demand to wherever prices are lower. Prices of the same basket of products in two different countries should be equal when measured in common currency.
Relative Form of P P P: Due to market imperfections, prices of the same basket of products in different countries will not necessarily be the same, but the rate of change in prices should be similar when measured in common currency 3<br>
Absolute Form of P P P: Without international barriers, consumers shift their demand to wherever prices are lower. Prices of the same basket of products in two different countries should be equal when measured in common currency.
Relative Form of P P P: Due to market imperfections, prices of the same basket of products in different countries will not necessarily be the same, but the rate of change in prices should be similar when measured in common currency 3<br>
04
Purchasing Power Parity (P P P) (2 of 10) Relative P P P Theory (continued)
Exchange rate adjustment is necessary for the relative purchasing power to be the same whether buying products locally or from another country.
If the purchasing power is not equal, consumers will shift purchases to wherever products are cheaper until the purchasing power is equal. 4<br>
Exchange rate adjustment is necessary for the relative purchasing power to be the same whether buying products locally or from another country.
If the purchasing power is not equal, consumers will shift purchases to wherever products are cheaper until the purchasing power is equal. 4<br>
05
Purchasing Power Parity (P P P) (3 of 10) Derivation of Purchasing Power Parity
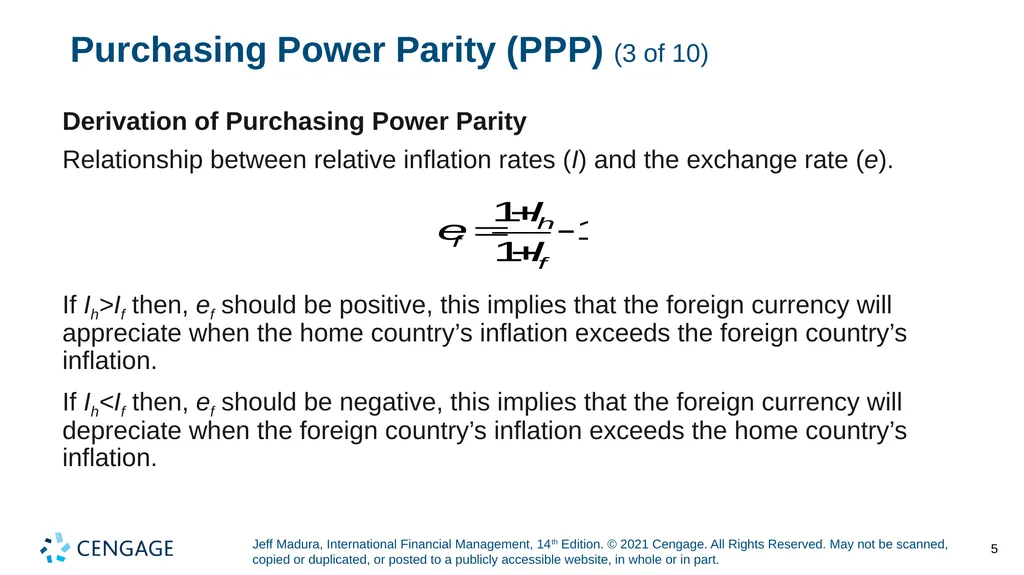
Relationship between relative inflation rates (I) and the exchange rate (e). If Ih>If then, ef should be positive, this implies that the foreign currency will appreciate when the home country’s inflation exceeds the foreign country’s inflation.
If Ih<If then, ef should be negative, this implies that the foreign currency will depreciate when the foreign country’s inflation exceeds the home country’s inflation. 5<br>
Relationship between relative inflation rates (I) and the exchange rate (e). If Ih>If then, ef should be positive, this implies that the foreign currency will appreciate when the home country’s inflation exceeds the foreign country’s inflation.
If Ih<If then, ef should be negative, this implies that the foreign currency will depreciate when the foreign country’s inflation exceeds the home country’s inflation. 5<br>
06
Purchasing Power Parity (P P P) (4 of 10) Using P P P to Estimate Exchange Rate Effects
The relative form of P P P can be used to estimate how an exchange rate will change in response to differential inflation rates between countries.
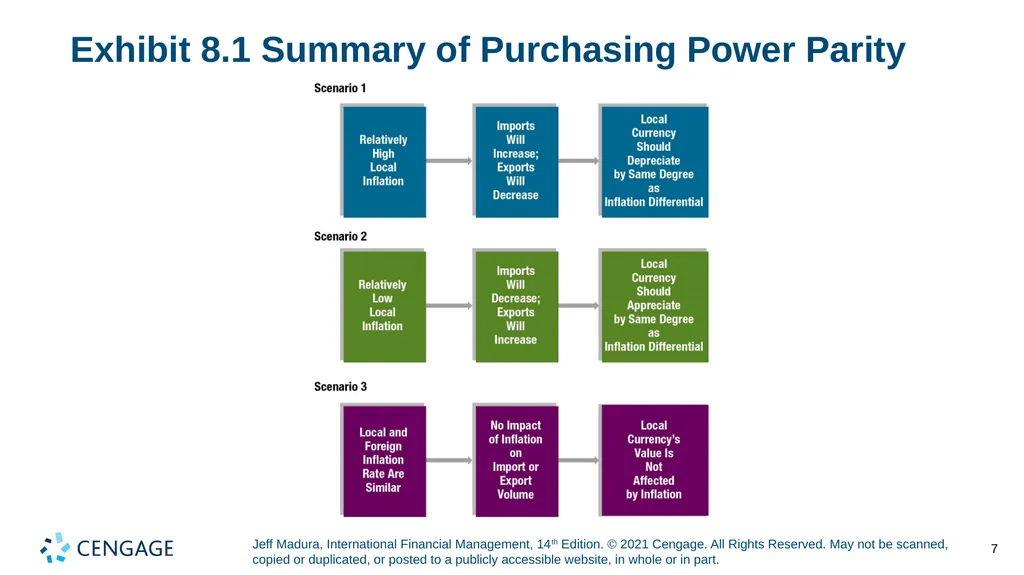
International trade is the mechanism by which the inflation differential affects the exchange rate according to this theory (Exhibit 8.1)
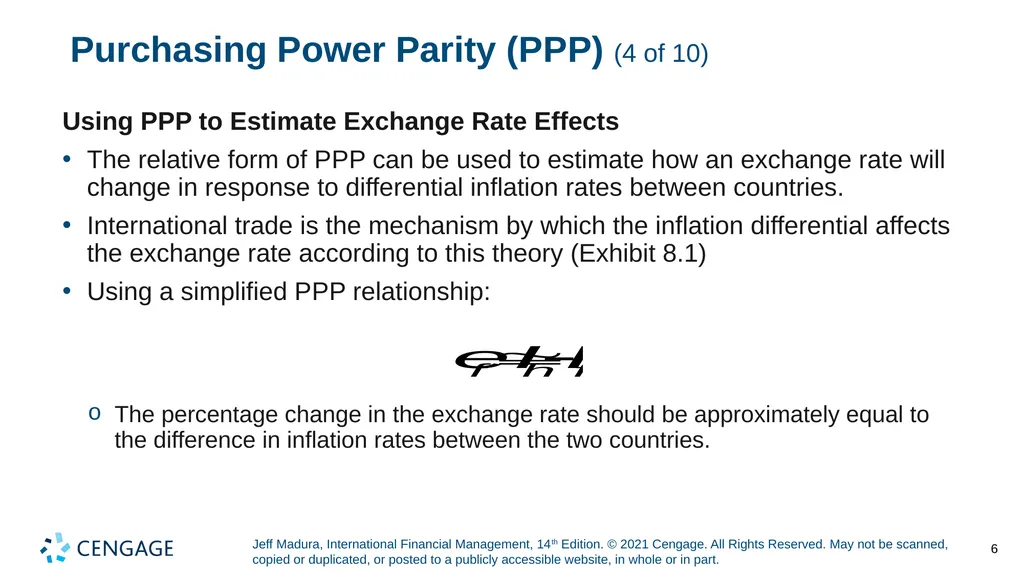
Using a simplified P P P relationship: The percentage change in the exchange rate should be approximately equal to the difference in inflation rates between the two countries. 6<br>
The relative form of P P P can be used to estimate how an exchange rate will change in response to differential inflation rates between countries.
International trade is the mechanism by which the inflation differential affects the exchange rate according to this theory (Exhibit 8.1)
Using a simplified P P P relationship: The percentage change in the exchange rate should be approximately equal to the difference in inflation rates between the two countries. 6<br>
07
Exhibit 8.1 Summary of Purchasing Power Parity 7<br>
08
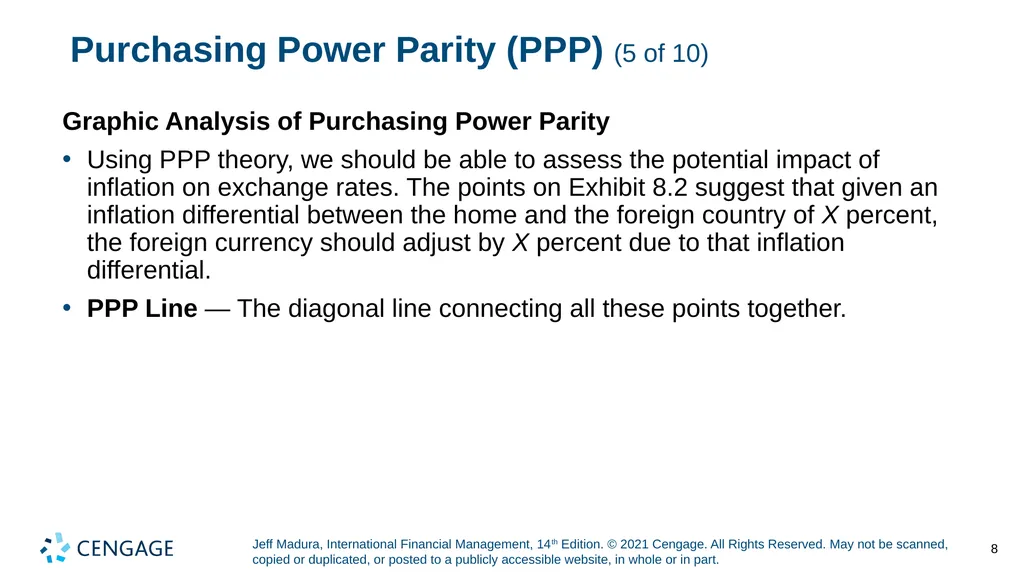
Purchasing Power Parity (P P P) (5 of 10) Graphic Analysis of Purchasing Power Parity
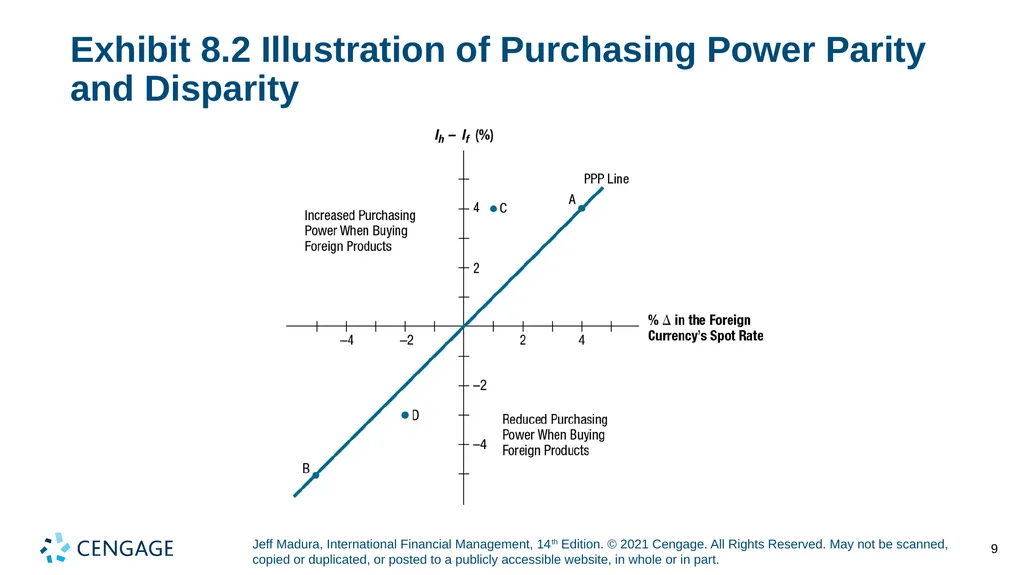
Using P P P theory, we should be able to assess the potential impact of inflation on exchange rates. The points on Exhibit 8.2 suggest that given an inflation differential between the home and the foreign country of X percent, the foreign currency should adjust by X percent due to that inflation differential.
P P P Line — The diagonal line connecting all these points together. 8<br>
Using P P P theory, we should be able to assess the potential impact of inflation on exchange rates. The points on Exhibit 8.2 suggest that given an inflation differential between the home and the foreign country of X percent, the foreign currency should adjust by X percent due to that inflation differential.
P P P Line — The diagonal line connecting all these points together. 8<br>
09
Exhibit 8.2 Illustration of Purchasing Power Parity and Disparity 9<br>
10
Purchasing Power Parity (P P P) (6 of 10) Graphic Analysis of Purchasing Power Parity (continued)
Purchasing Power Disparity
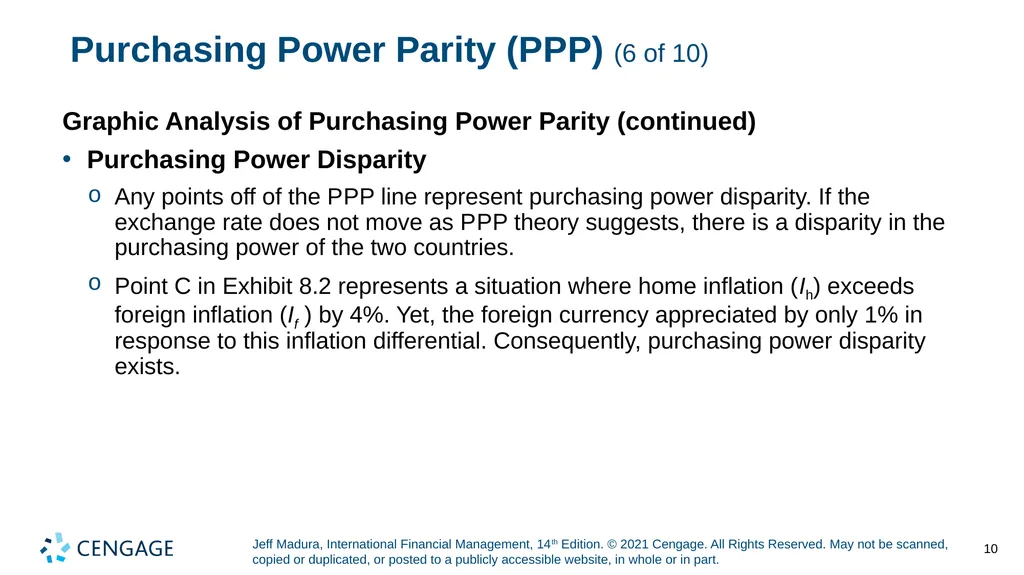
Any points off of the P P P line represent purchasing power disparity. If the exchange rate does not move as P P P theory suggests, there is a disparity in the purchasing power of the two countries.
Point C in Exhibit 8.2 represents a situation where home inflation (I h) exceeds foreign inflation (I f ) by 4%. Yet, the foreign currency appreciated by only 1% in response to this inflation differential. Consequently, purchasing power disparity exists. 10<br>
Purchasing Power Disparity
Any points off of the P P P line represent purchasing power disparity. If the exchange rate does not move as P P P theory suggests, there is a disparity in the purchasing power of the two countries.
Point C in Exhibit 8.2 represents a situation where home inflation (I h) exceeds foreign inflation (I f ) by 4%. Yet, the foreign currency appreciated by only 1% in response to this inflation differential. Consequently, purchasing power disparity exists. 10<br>
11
Purchasing Power Parity (P P P) (7 of 10) Testing the Purchasing Power Parity Theory
Simple test of P P P
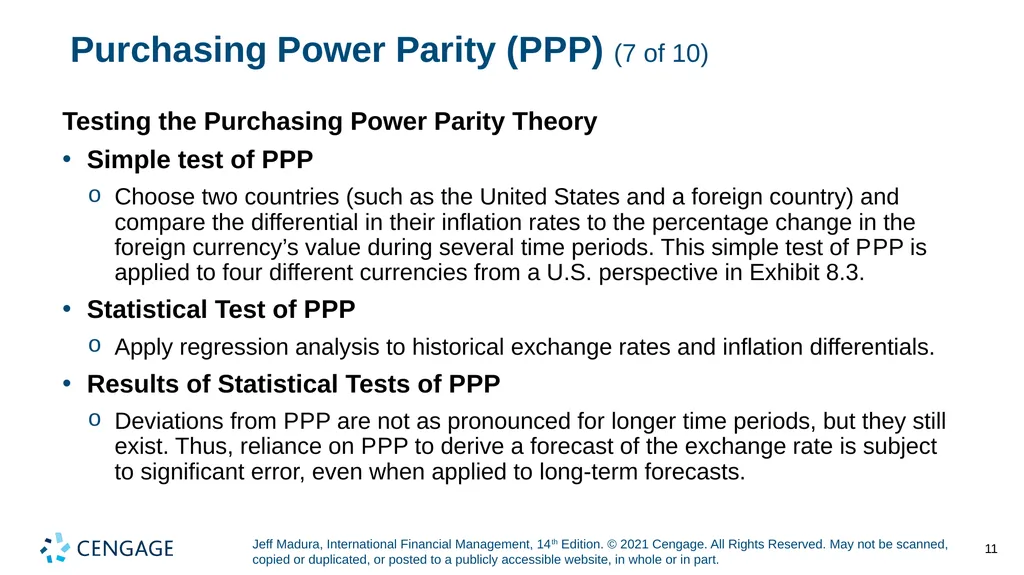
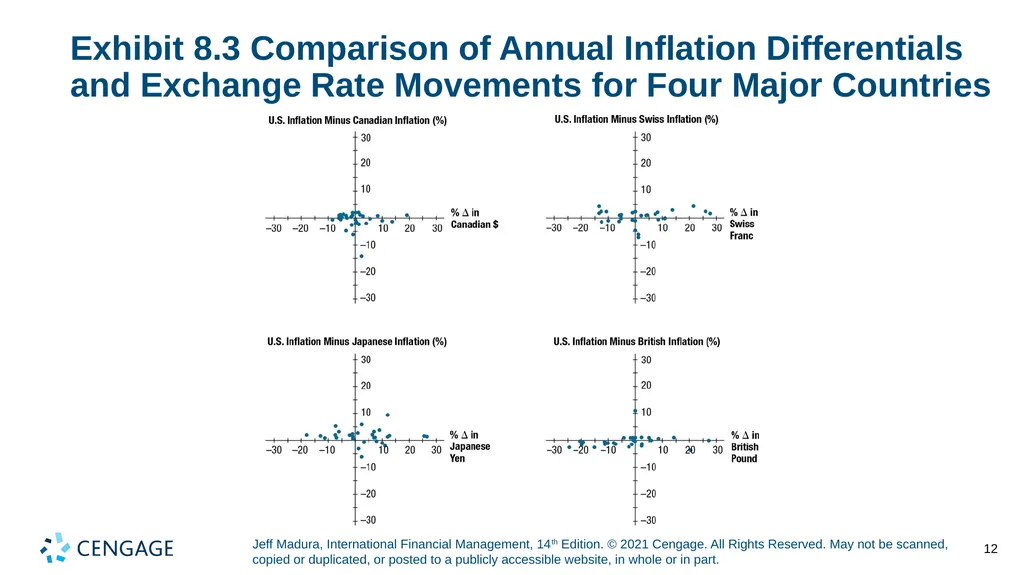
Choose two countries (such as the United States and a foreign country) and compare the differential in their inflation rates to the percentage change in the foreign currency’s value during several time periods. This simple test of P P P is applied to four different currencies from a U.S. perspective in Exhibit 8.3.
Statistical Test of P P P
Apply regression analysis to historical exchange rates and inflation differentials.
Results of Statistical Tests of P P P
Deviations from P P P are not as pronounced for longer time periods, but they still exist. Thus, reliance on P P P to derive a forecast of the exchange rate is subject to significant error, even when applied to long-term forecasts. 11<br>
Simple test of P P P
Choose two countries (such as the United States and a foreign country) and compare the differential in their inflation rates to the percentage change in the foreign currency’s value during several time periods. This simple test of P P P is applied to four different currencies from a U.S. perspective in Exhibit 8.3.
Statistical Test of P P P
Apply regression analysis to historical exchange rates and inflation differentials.
Results of Statistical Tests of P P P
Deviations from P P P are not as pronounced for longer time periods, but they still exist. Thus, reliance on P P P to derive a forecast of the exchange rate is subject to significant error, even when applied to long-term forecasts. 11<br>
12
Exhibit 8.3 Comparison of Annual Inflation Differentials and Exchange Rate Movements for Four Major Countries 12<br>
13
Purchasing Power Parity (P P P) (8 of 10) Testing the Purchasing Power Parity Theory (continued)
Limitation of P P P Tests
Results vary with the base period used. The base period chosen should reflect an equilibrium position since subsequent periods are evaluated in comparison to it. If a base period is used when the foreign currency was relatively weak for reasons other than high inflation, most subsequent periods could show higher appreciation of that currency than what would be predicted by P P P. 13<br>
Limitation of P P P Tests
Results vary with the base period used. The base period chosen should reflect an equilibrium position since subsequent periods are evaluated in comparison to it. If a base period is used when the foreign currency was relatively weak for reasons other than high inflation, most subsequent periods could show higher appreciation of that currency than what would be predicted by P P P. 13<br>
14
Purchasing Power Parity (P P P) (9 of 10) Why Purchasing Power Parity Does Not Hold
Confounding effects
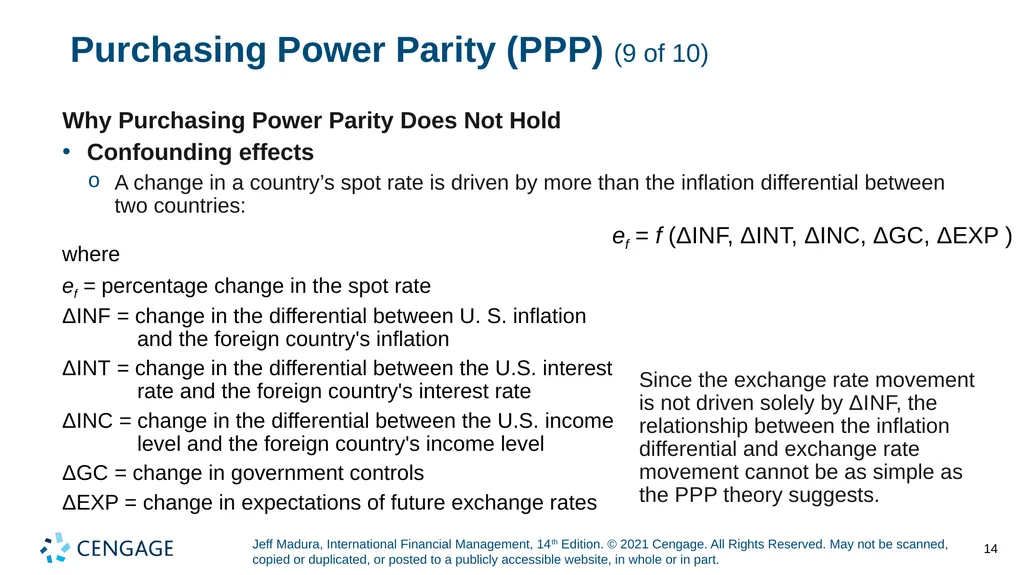
A change in a country’s spot rate is driven by more than the inflation differential between two countries: ef = f (ΔI N F, ΔI N T, ΔINC, ΔGC, ΔEXP ) where
ef = percentage change in the spot rate
ΔINF = change in the differential between U. S. inflation and the foreign country's inflation
ΔINT = change in the differential between the U.S. interest rate and the foreign country's interest rate
ΔINC = change in the differential between the U.S. income level and the foreign country's income level
ΔGC = change in government controls
ΔEXP = change in expectations of future exchange rates Since the exchange rate movement is not driven solely by ΔI N F, the relationship between the inflation differential and exchange rate movement cannot be as simple as the P P P theory suggests. 14<br>
Confounding effects
A change in a country’s spot rate is driven by more than the inflation differential between two countries: ef = f (ΔI N F, ΔI N T, ΔINC, ΔGC, ΔEXP ) where
ef = percentage change in the spot rate
ΔINF = change in the differential between U. S. inflation and the foreign country's inflation
ΔINT = change in the differential between the U.S. interest rate and the foreign country's interest rate
ΔINC = change in the differential between the U.S. income level and the foreign country's income level
ΔGC = change in government controls
ΔEXP = change in expectations of future exchange rates Since the exchange rate movement is not driven solely by ΔI N F, the relationship between the inflation differential and exchange rate movement cannot be as simple as the P P P theory suggests. 14<br>
15
Purchasing Power Parity (P P P) (10 of 10) Why Purchasing Power Parity Does Not Hold
No Substitutes for Traded Goods
If substitute goods are not available domestically, consumers may not stop buying imported goods. 15<br>
No Substitutes for Traded Goods
If substitute goods are not available domestically, consumers may not stop buying imported goods. 15<br>
16
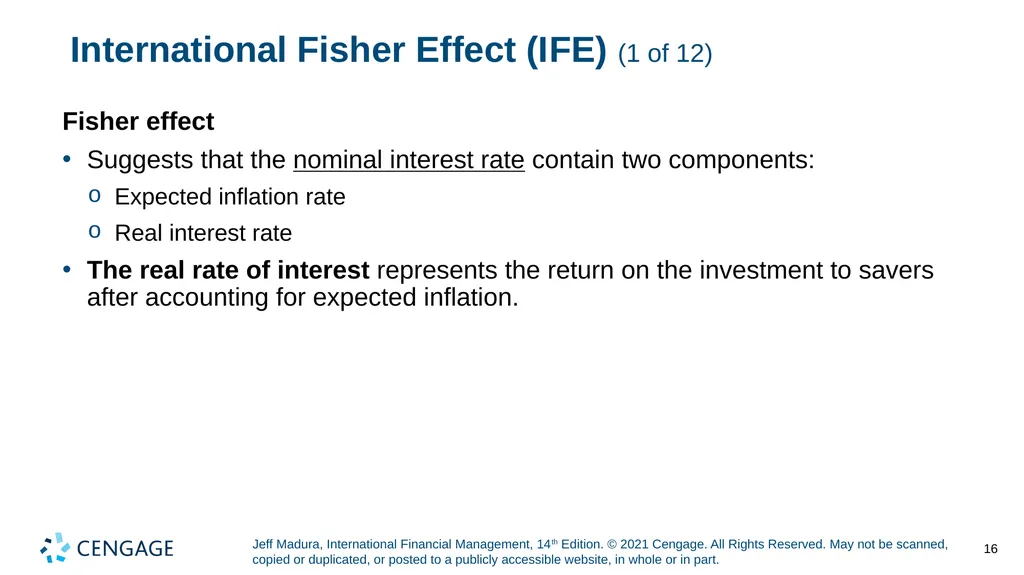
International Fisher Effect (I F E) (1 of 12) Fisher effect
Suggests that the nominal interest rate contain two components:
Expected inflation rate
Real interest rate
The real rate of interest represents the return on the investment to savers after accounting for expected inflation. 16<br>
Suggests that the nominal interest rate contain two components:
Expected inflation rate
Real interest rate
The real rate of interest represents the return on the investment to savers after accounting for expected inflation. 16<br>
17
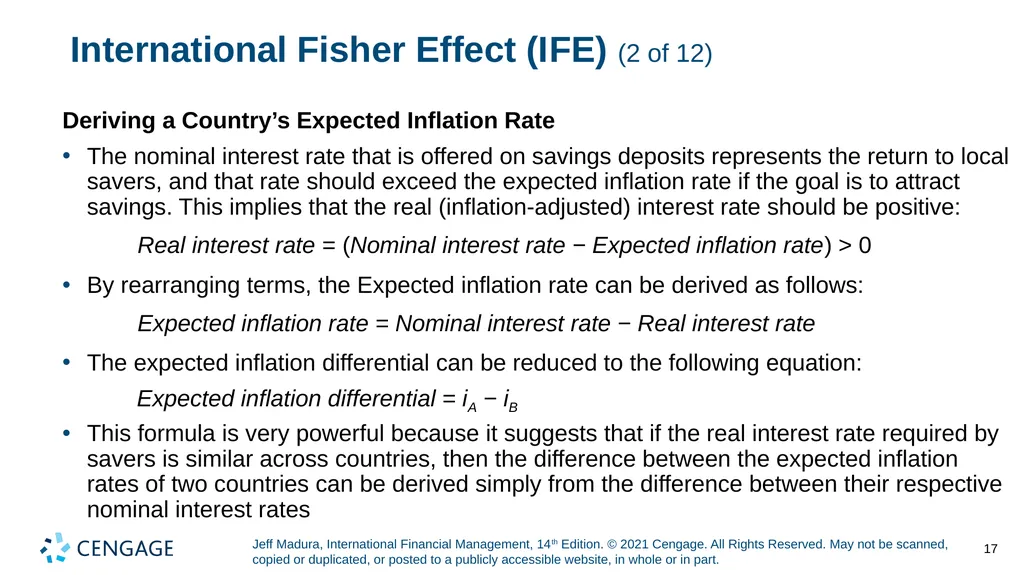
International Fisher Effect (I F E) (2 of 12) Deriving a Country’s Expected Inflation Rate
The nominal interest rate that is offered on savings deposits represents the return to local savers, and that rate should exceed the expected inflation rate if the goal is to attract savings. This implies that the real (inflation-adjusted) interest rate should be positive: Real interest rate = (Nominal interest rate − Expected inflation rate) > 0 By rearranging terms, the Expected inflation rate can be derived as follows: Expected inflation rate = Nominal interest rate − Real interest rate The expected inflation differential can be reduced to the following equation: Expected inflation differential = iA − iB This formula is very powerful because it suggests that if the real interest rate required by savers is similar across countries, then the difference between the expected inflation rates of two countries can be derived simply from the difference between their respective nominal interest rates 17<br>
The nominal interest rate that is offered on savings deposits represents the return to local savers, and that rate should exceed the expected inflation rate if the goal is to attract savings. This implies that the real (inflation-adjusted) interest rate should be positive: Real interest rate = (Nominal interest rate − Expected inflation rate) > 0 By rearranging terms, the Expected inflation rate can be derived as follows: Expected inflation rate = Nominal interest rate − Real interest rate The expected inflation differential can be reduced to the following equation: Expected inflation differential = iA − iB This formula is very powerful because it suggests that if the real interest rate required by savers is similar across countries, then the difference between the expected inflation rates of two countries can be derived simply from the difference between their respective nominal interest rates 17<br>
18
International Fisher Effect (I F E) (3 of 12) Estimating the Expected Exchange Rate Movement
Once the expected inflation rates of two countries have been derived from the nominal interest rates (based on the international Fisher effect) as just described, P P P theory can be applied to estimate how the expected inflation rate differential will affect exchange rates. 18<br>
Once the expected inflation rates of two countries have been derived from the nominal interest rates (based on the international Fisher effect) as just described, P P P theory can be applied to estimate how the expected inflation rate differential will affect exchange rates. 18<br>
19
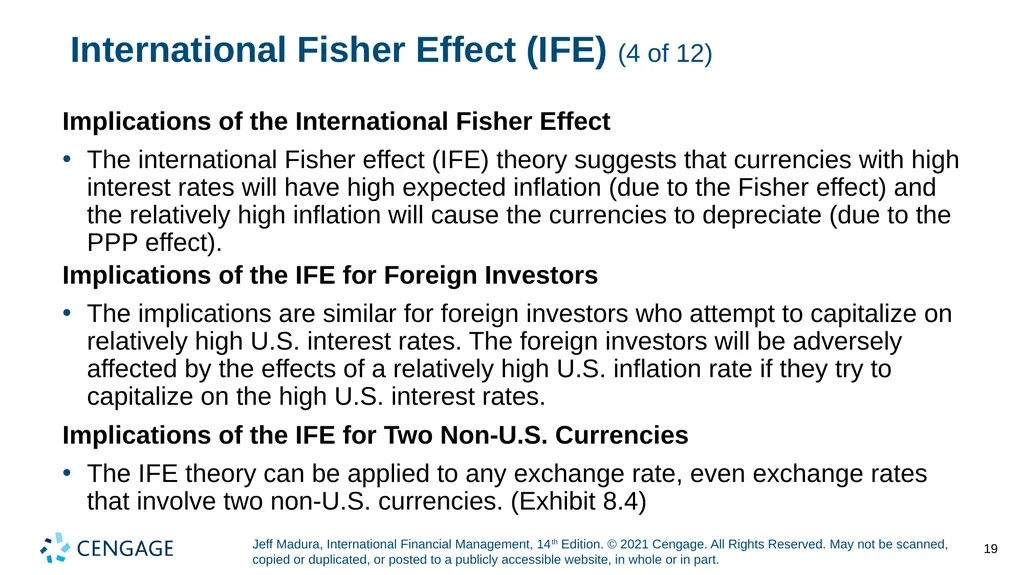
International Fisher Effect (I F E) (4 of 12) Implications of the International Fisher Effect
The international Fisher effect (I F E) theory suggests that currencies with high interest rates will have high expected inflation (due to the Fisher effect) and the relatively high inflation will cause the currencies to depreciate (due to the P P P effect). Implications of the I F E for Foreign Investors
The implications are similar for foreign investors who attempt to capitalize on relatively high U.S. interest rates. The foreign investors will be adversely affected by the effects of a relatively high U.S. inflation rate if they try to capitalize on the high U.S. interest rates. Implications of the I F E for Two Non-U.S. Currencies
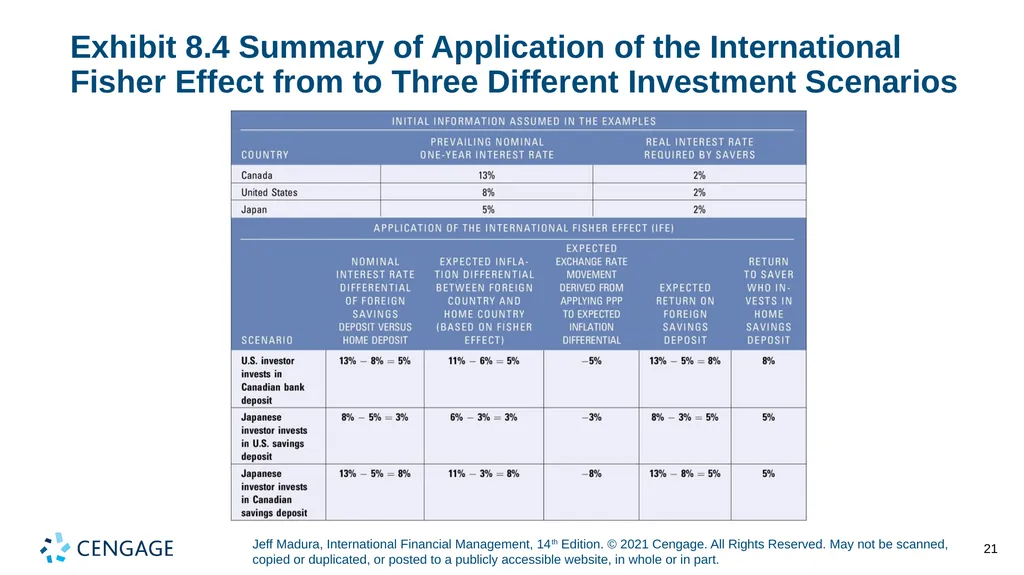
The I F E theory can be applied to any exchange rate, even exchange rates that involve two non-U.S. currencies. (Exhibit 8.4) 19<br>
The international Fisher effect (I F E) theory suggests that currencies with high interest rates will have high expected inflation (due to the Fisher effect) and the relatively high inflation will cause the currencies to depreciate (due to the P P P effect). Implications of the I F E for Foreign Investors
The implications are similar for foreign investors who attempt to capitalize on relatively high U.S. interest rates. The foreign investors will be adversely affected by the effects of a relatively high U.S. inflation rate if they try to capitalize on the high U.S. interest rates. Implications of the I F E for Two Non-U.S. Currencies
The I F E theory can be applied to any exchange rate, even exchange rates that involve two non-U.S. currencies. (Exhibit 8.4) 19<br>
20
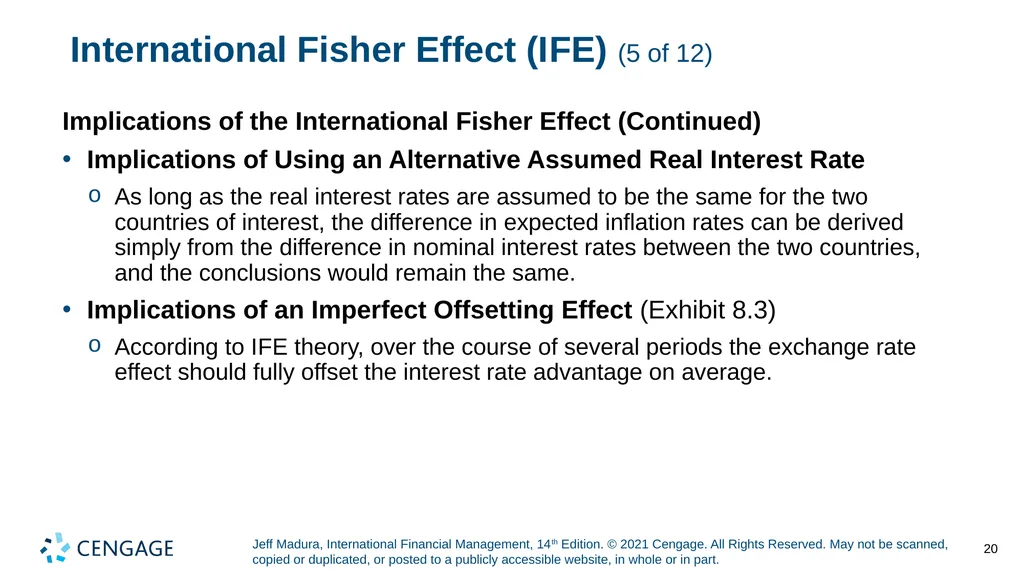
International Fisher Effect (I F E) (5 of 12) Implications of the International Fisher Effect (Continued)
Implications of Using an Alternative Assumed Real Interest Rate
As long as the real interest rates are assumed to be the same for the two countries of interest, the difference in expected inflation rates can be derived simply from the difference in nominal interest rates between the two countries, and the conclusions would remain the same.
Implications of an Imperfect Offsetting Effect (Exhibit 8.3)
According to I F E theory, over the course of several periods the exchange rate effect should fully offset the interest rate advantage on average. 20<br>
Implications of Using an Alternative Assumed Real Interest Rate
As long as the real interest rates are assumed to be the same for the two countries of interest, the difference in expected inflation rates can be derived simply from the difference in nominal interest rates between the two countries, and the conclusions would remain the same.
Implications of an Imperfect Offsetting Effect (Exhibit 8.3)
According to I F E theory, over the course of several periods the exchange rate effect should fully offset the interest rate advantage on average. 20<br>
21
Exhibit 8.4 Summary of Application of the International Fisher Effect from to Three Different Investment Scenarios 21<br>
22
International Fisher Effect (I F E) (6 of 12) Derivation of the International Fisher Effect
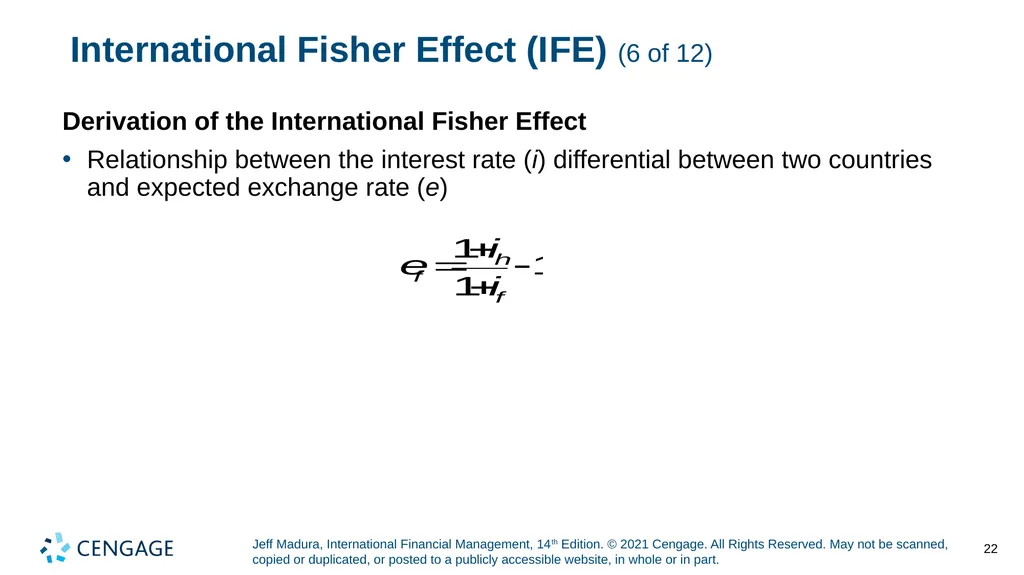
Relationship between the interest rate (i) differential between two countries and expected exchange rate (e) 22<br>
Relationship between the interest rate (i) differential between two countries and expected exchange rate (e) 22<br>
23
International Fisher Effect (I F E) (7 of 12) Derivation of the International Fisher Effect (continued)
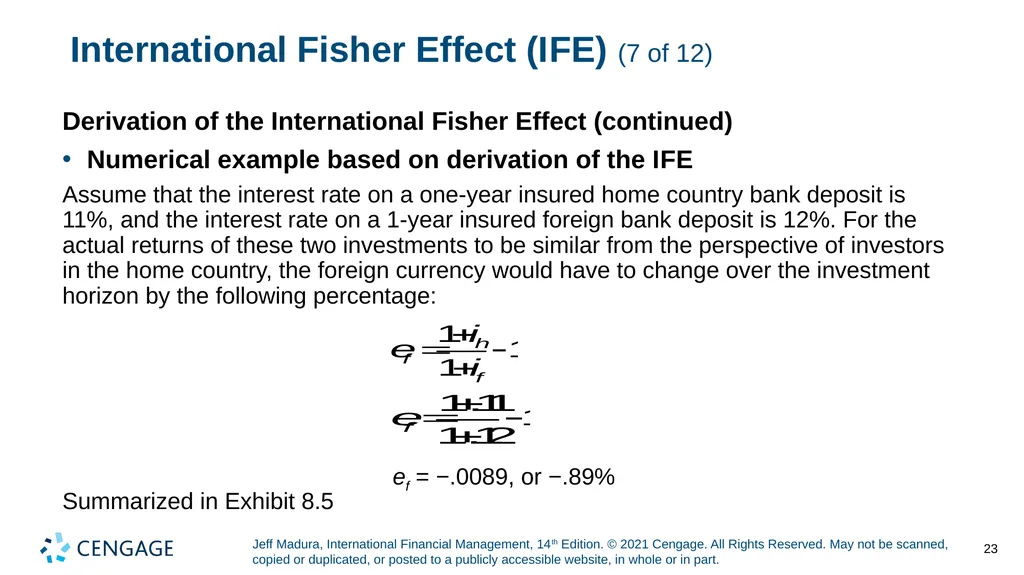
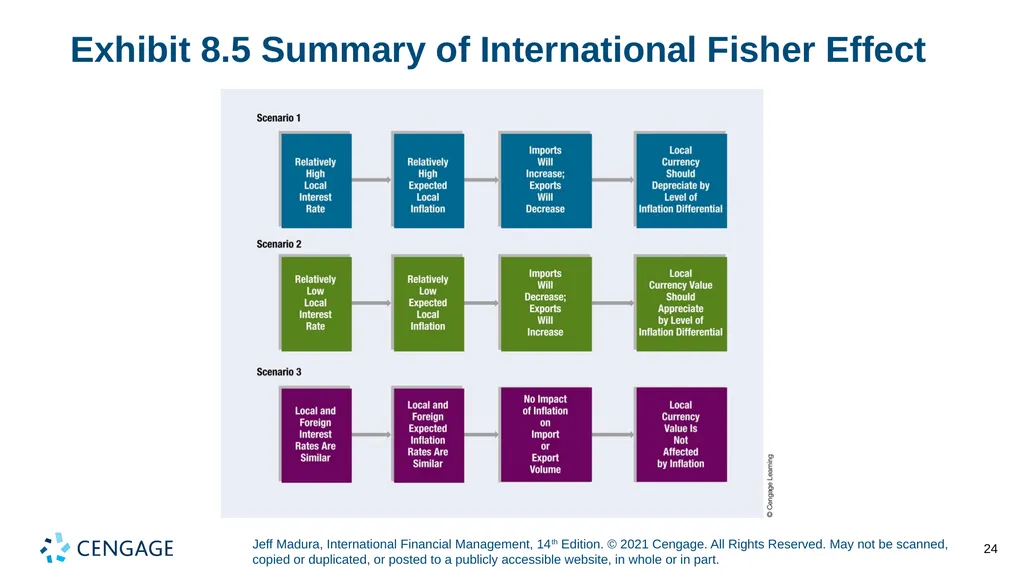
Numerical example based on derivation of the I F E Assume that the interest rate on a one-year insured home country bank deposit is 11%, and the interest rate on a 1-year insured foreign bank deposit is 12%. For the actual returns of these two investments to be similar from the perspective of investors in the home country, the foreign currency would have to change over the investment horizon by the following percentage: ef = −.0089, or −.89% Summarized in Exhibit 8.5 23<br>
Numerical example based on derivation of the I F E Assume that the interest rate on a one-year insured home country bank deposit is 11%, and the interest rate on a 1-year insured foreign bank deposit is 12%. For the actual returns of these two investments to be similar from the perspective of investors in the home country, the foreign currency would have to change over the investment horizon by the following percentage: ef = −.0089, or −.89% Summarized in Exhibit 8.5 23<br>
24
Exhibit 8.5 Summary of International Fisher Effect 24<br>
25
International Fisher Effect (I F E) (8 of 12) Derivation of the International Fisher Effect (continued)
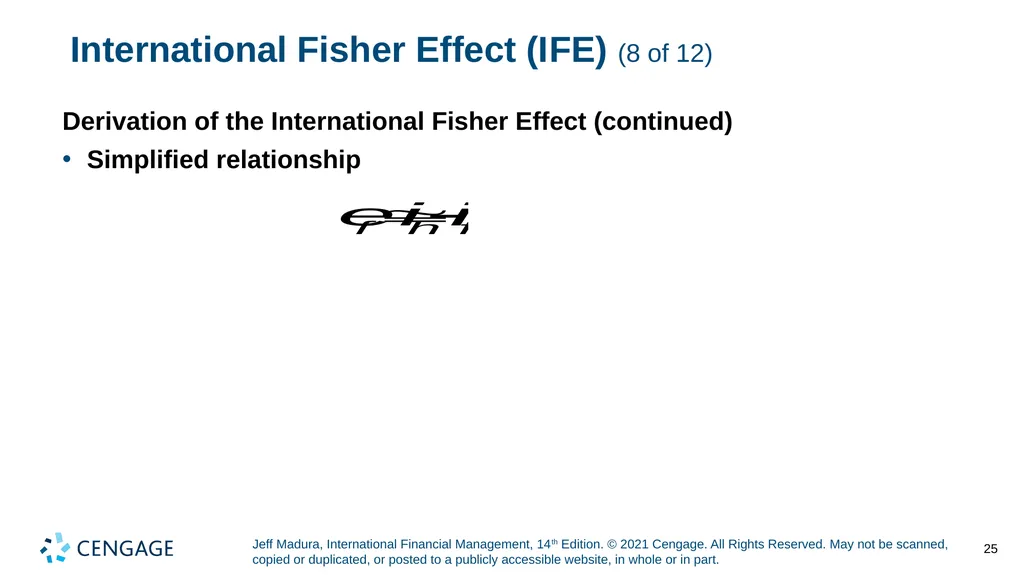
Simplified relationship 25<br>
Simplified relationship 25<br>
26
International Fisher Effect (I F E) (9 of 12) Graphic Analysis of the International Fisher Effect
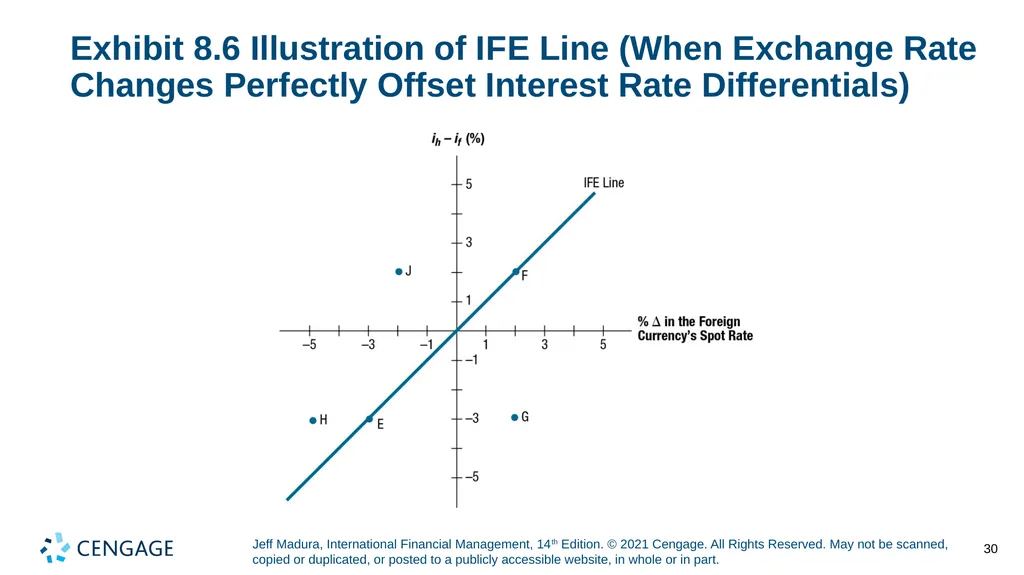
Point E in Exhibit 8.6 reflects a situation where the foreign interest rate exceeds the home interest rate by three percentage points. The foreign currency has depreciated by 3% to offset its interest rate advantage.
Point F represents a home interest rate 2% above the foreign interest rate. I F E theory suggests that the currency should appreciate by 2% to offset the interest rate disadvantage.
Point F illustrates the I F E from a foreign investor’s perspective. The home interest rate will appear attractive to the foreign investor. However, I F E theory suggests that the foreign currency will appreciate by 2%. 26<br>
Point E in Exhibit 8.6 reflects a situation where the foreign interest rate exceeds the home interest rate by three percentage points. The foreign currency has depreciated by 3% to offset its interest rate advantage.
Point F represents a home interest rate 2% above the foreign interest rate. I F E theory suggests that the currency should appreciate by 2% to offset the interest rate disadvantage.
Point F illustrates the I F E from a foreign investor’s perspective. The home interest rate will appear attractive to the foreign investor. However, I F E theory suggests that the foreign currency will appreciate by 2%. 26<br>
27
International Fisher Effect (I F E) (10 of 12) Graphic Analysis of the International Fisher Effect (continued)
Points on the I F E Line
All the points along the I F E line reflect exchange rate adjustments to offset the differential in interest rates. This means investors will end up achieving the same yield (adjusted for exchange rate fluctuations) whether they invest at home or in a foreign country.
Points below the I F E Line
Points below the I F E line generally reflect the higher returns from investing in foreign deposits.
Points above the I F E Line
Points above the I F E line generally reflect returns from foreign deposits that are lower than the returns possible domestically. 27<br>
Points on the I F E Line
All the points along the I F E line reflect exchange rate adjustments to offset the differential in interest rates. This means investors will end up achieving the same yield (adjusted for exchange rate fluctuations) whether they invest at home or in a foreign country.
Points below the I F E Line
Points below the I F E line generally reflect the higher returns from investing in foreign deposits.
Points above the I F E Line
Points above the I F E line generally reflect returns from foreign deposits that are lower than the returns possible domestically. 27<br>
28
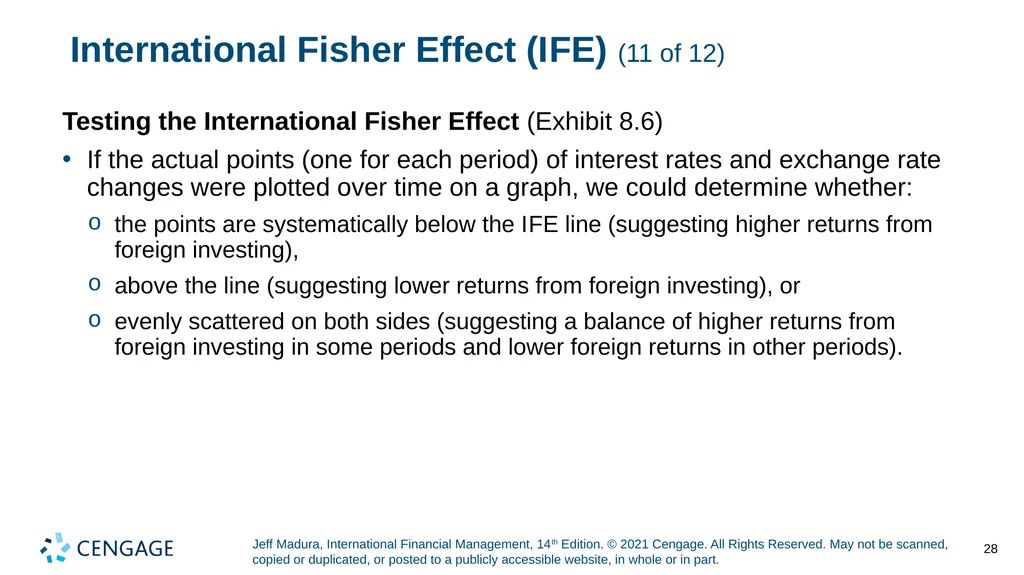
International Fisher Effect (I F E) (11 of 12) Testing the International Fisher Effect (Exhibit 8.6)
If the actual points (one for each period) of interest rates and exchange rate changes were plotted over time on a graph, we could determine whether:
the points are systematically below the I F E line (suggesting higher returns from foreign investing),
above the line (suggesting lower returns from foreign investing), or
evenly scattered on both sides (suggesting a balance of higher returns from foreign investing in some periods and lower foreign returns in other periods). 28<br>
If the actual points (one for each period) of interest rates and exchange rate changes were plotted over time on a graph, we could determine whether:
the points are systematically below the I F E line (suggesting higher returns from foreign investing),
above the line (suggesting lower returns from foreign investing), or
evenly scattered on both sides (suggesting a balance of higher returns from foreign investing in some periods and lower foreign returns in other periods). 28<br>
29
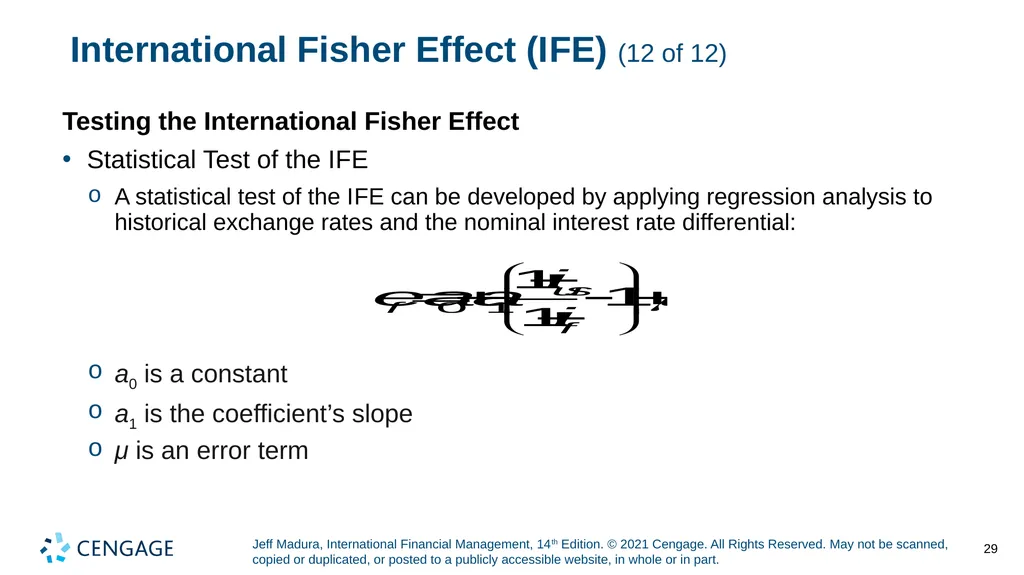
International Fisher Effect (I F E) (12 of 12) Testing the International Fisher Effect
Statistical Test of the I F E
A statistical test of the I F E can be developed by applying regression analysis to historical exchange rates and the nominal interest rate differential: a0 is a constant
a1 is the coefficient’s slope
μ is an error term 29<br>
Statistical Test of the I F E
A statistical test of the I F E can be developed by applying regression analysis to historical exchange rates and the nominal interest rate differential: a0 is a constant
a1 is the coefficient’s slope
μ is an error term 29<br>
30
Exhibit 8.6 Illustration of I F E Line (When Exchange Rate Changes Perfectly Offset Interest Rate Differentials) 30<br>
31
Tests of the International Fisher Effect (1 of 2) Limitations of the I F E
The I F E theory relies on the Fisher effect and P P P
Limitation of the Fisher Effect
The difference between the nominal interest rate and actual inflation rate is not consistent. Thus, while the Fisher effect can effectively use nominal interest rates to estimate the market’s expected inflation over a particular period, the market may be wrong.
Limitation of P P P
Other country characteristics besides inflation (income levels, government controls) can affect exchange rate movements. Even if the expected inflation derived from the Fisher effect properly reflects the actual inflation rate over the period, relying solely on inflation to forecast the future exchange rate is subject to error. 31<br>
The I F E theory relies on the Fisher effect and P P P
Limitation of the Fisher Effect
The difference between the nominal interest rate and actual inflation rate is not consistent. Thus, while the Fisher effect can effectively use nominal interest rates to estimate the market’s expected inflation over a particular period, the market may be wrong.
Limitation of P P P
Other country characteristics besides inflation (income levels, government controls) can affect exchange rate movements. Even if the expected inflation derived from the Fisher effect properly reflects the actual inflation rate over the period, relying solely on inflation to forecast the future exchange rate is subject to error. 31<br>
32
Tests of the International Fisher Effect (2 of 2) I F E Theory versus Reality
The I F E theory contradicts how a country with a high interest rate can attract more capital flows and therefore cause the local currency’s value to strengthen (Ch. 4).
I F E theory also contradicts how central banks may purposely try to raise interest rates in order to attract funds and strengthen the value of their local currencies (Ch. 6).
Whether the I F E holds in reality is dependent on the countries involved and the period assessed.
The I F E theory may be especially meaningful to situations in which the M N Cs and large investors consider investing in countries where the prevailing interest rates are very high. 32<br>
The I F E theory contradicts how a country with a high interest rate can attract more capital flows and therefore cause the local currency’s value to strengthen (Ch. 4).
I F E theory also contradicts how central banks may purposely try to raise interest rates in order to attract funds and strengthen the value of their local currencies (Ch. 6).
Whether the I F E holds in reality is dependent on the countries involved and the period assessed.
The I F E theory may be especially meaningful to situations in which the M N Cs and large investors consider investing in countries where the prevailing interest rates are very high. 32<br>
33
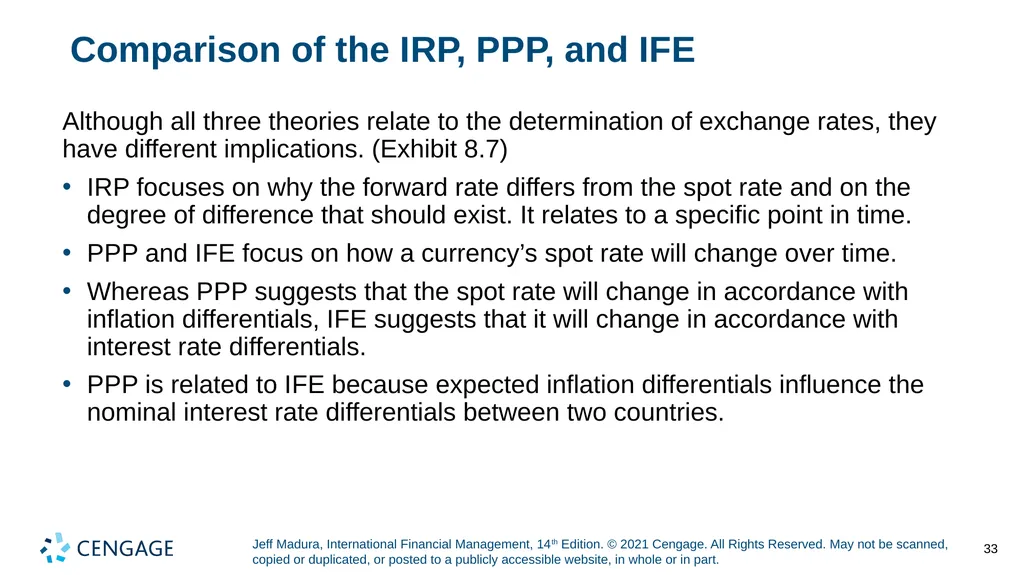
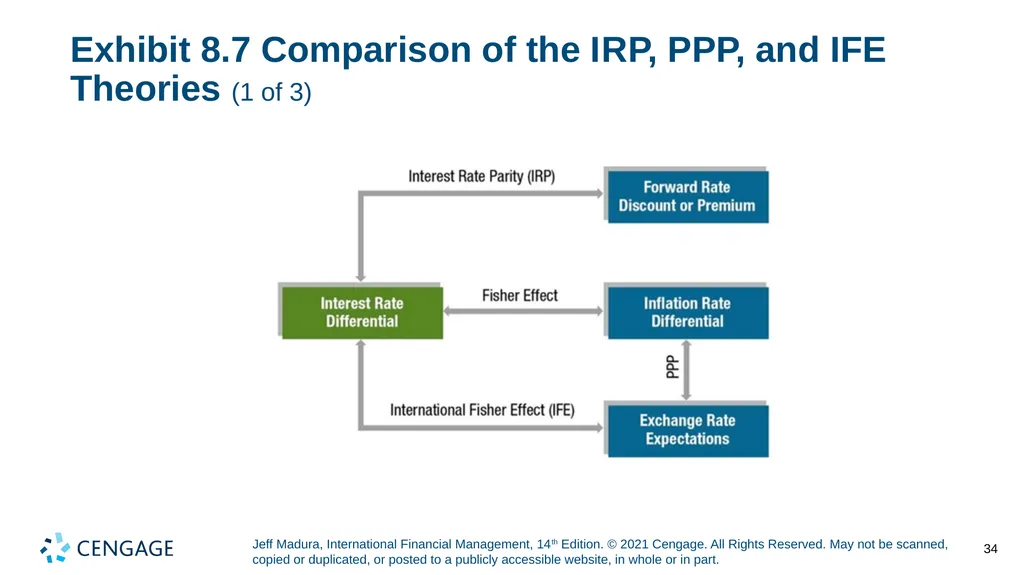
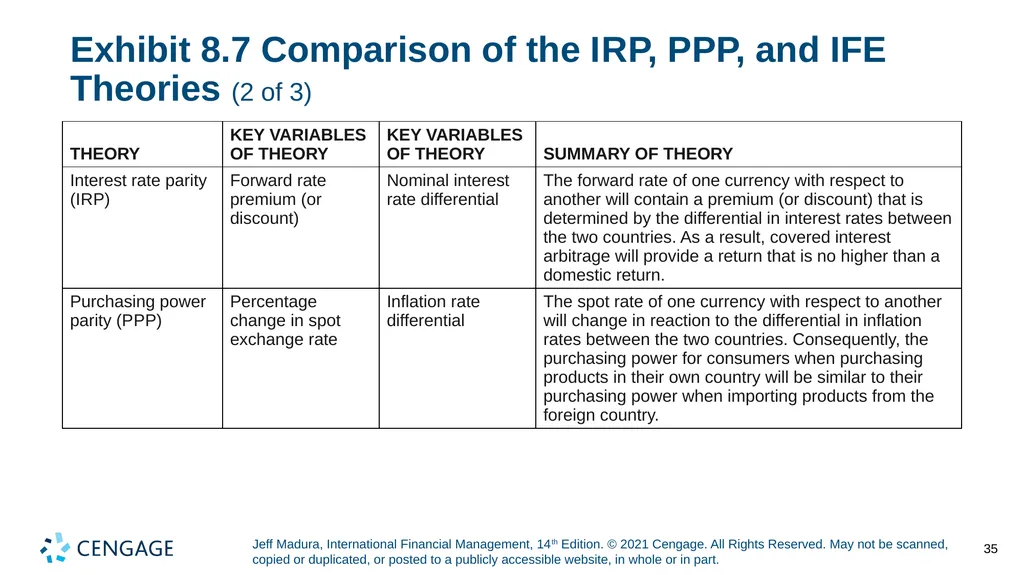
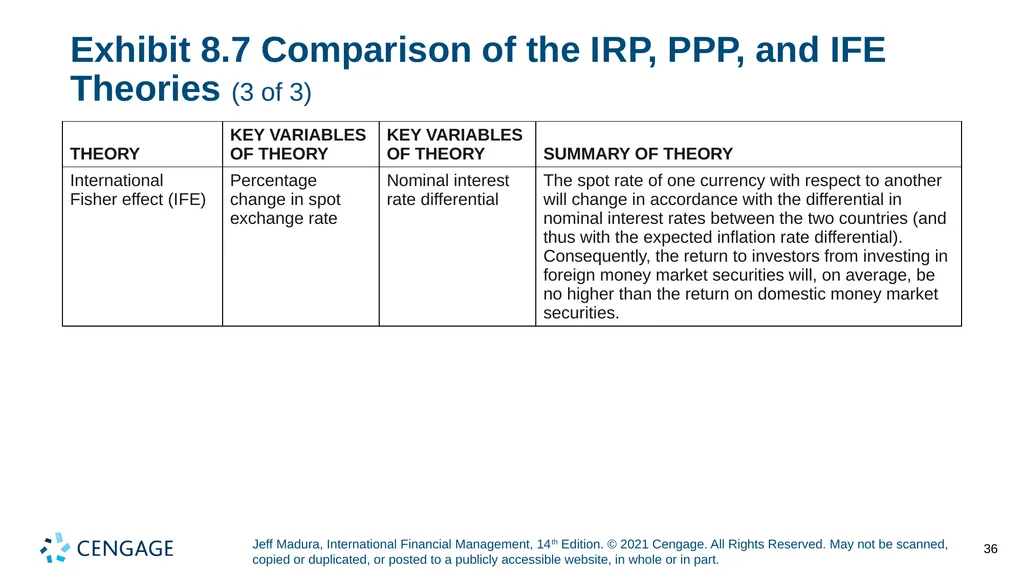
Comparison of the I R P, P P P, and I F E Although all three theories relate to the determination of exchange rates, they have different implications. (Exhibit 8.7)
I R P focuses on why the forward rate differs from the spot rate and on the degree of difference that should exist. It relates to a specific point in time.
P P P and I F E focus on how a currency’s spot rate will change over time.
Whereas P P P suggests that the spot rate will change in accordance with inflation differentials, I F E suggests that it will change in accordance with interest rate differentials.
P P P is related to I F E because expected inflation differentials influence the nominal interest rate differentials between two countries. 33<br>
I R P focuses on why the forward rate differs from the spot rate and on the degree of difference that should exist. It relates to a specific point in time.
P P P and I F E focus on how a currency’s spot rate will change over time.
Whereas P P P suggests that the spot rate will change in accordance with inflation differentials, I F E suggests that it will change in accordance with interest rate differentials.
P P P is related to I F E because expected inflation differentials influence the nominal interest rate differentials between two countries. 33<br>
34
Exhibit 8.7 Comparison of the I R P, P P P, and I F E Theories (1 of 3) 34<br>
35
Exhibit 8.7 Comparison of the I R P, P P P, and I F E Theories (2 of 3) 35<br>
36
Exhibit 8.7 Comparison of the I R P, P P P, and I F E Theories (3 of 3) 36<br>
37
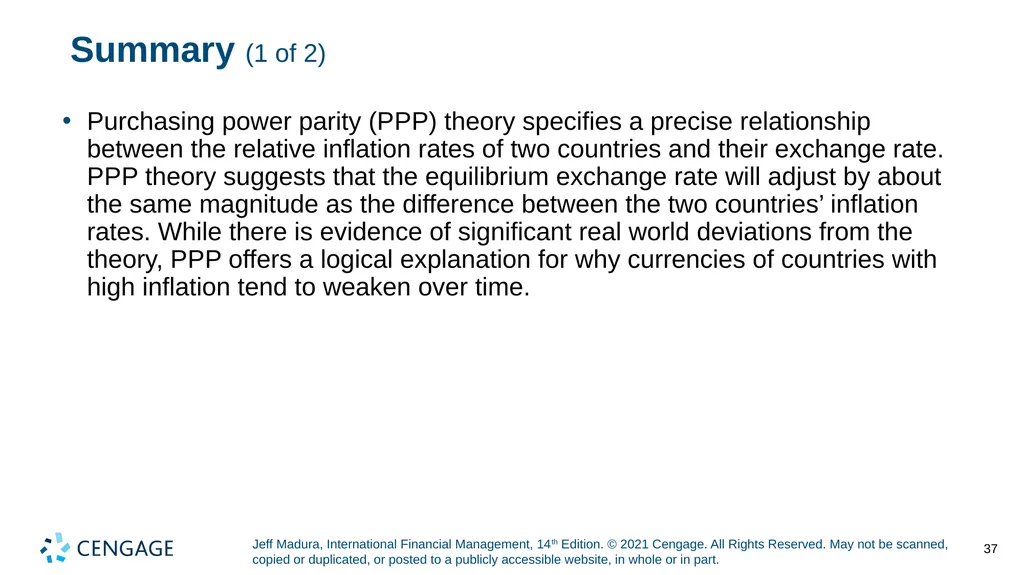
Summary (1 of 2) Purchasing power parity (P P P) theory specifies a precise relationship between the relative inflation rates of two countries and their exchange rate. P P P theory suggests that the equilibrium exchange rate will adjust by about the same magnitude as the difference between the two countries’ inflation rates. While there is evidence of significant real world deviations from the theory, P P P offers a logical explanation for why currencies of countries with high inflation tend to weaken over time. 37<br>
38
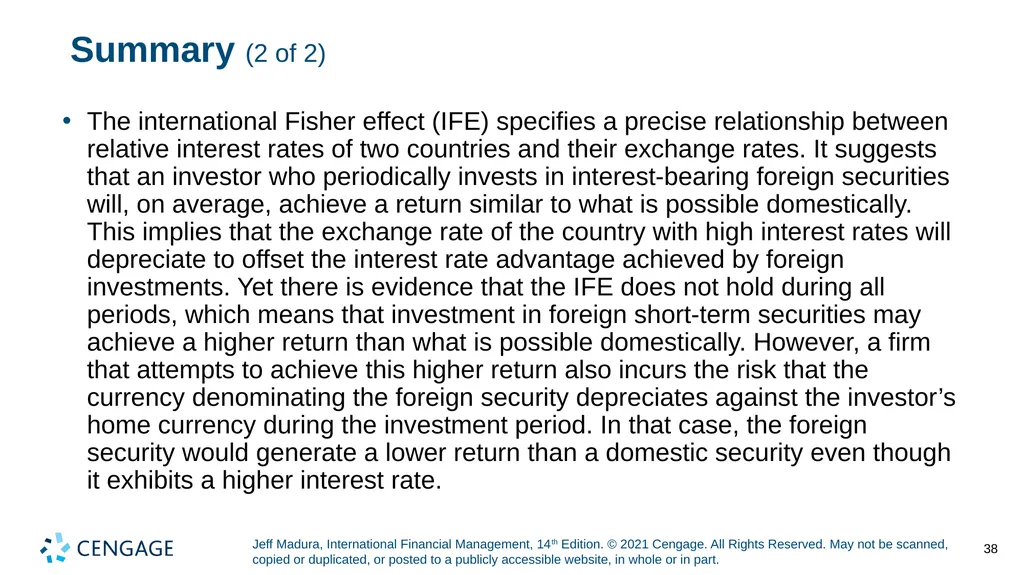
Summary (2 of 2) The international Fisher effect (I F E) specifies a precise relationship between relative interest rates of two countries and their exchange rates. It suggests that an investor who periodically invests in interest-bearing foreign securities will, on average, achieve a return similar to what is possible domestically. This implies that the exchange rate of the country with high interest rates will depreciate to offset the interest rate advantage achieved by foreign investments. Yet there is evidence that the I F E does not hold during all periods, which means that investment in foreign short-term securities may achieve a higher return than what is possible domestically. However, a firm that attempts to achieve this higher return also incurs the risk that the currency denominating the foreign security depreciates against the investor’s home currency during the investment period. In that case, the foreign security would generate a lower return than a domestic security even though it exhibits a higher interest rate. 38<br>