Common Statistical Issues Andy Vail, MDSG meeting, 8th July 2013 Outline MDSG templates Protocol stage Literature review, Structure of comparisons, Outcomes, Risk of Bias, Heterogeneity, Subgroup Sensitivity analyses ReviewUpdate stage
"Common Statistical Issues Andy Vail, MDSG meeting," is the property of its rightful owner. Permission is granted to
download and print the materials on this website for personal, non-commercial use only, and to display it
on your personal computer provided you do not modify the materials and that you retain all copyright
notices contained in the materials. By downloading content from our website, you accept the terms of this
agreement.
Presentation Transcript
01
Common Statistical Issues Andy Vail, MDSG meeting, 8th July 2013<br>
02
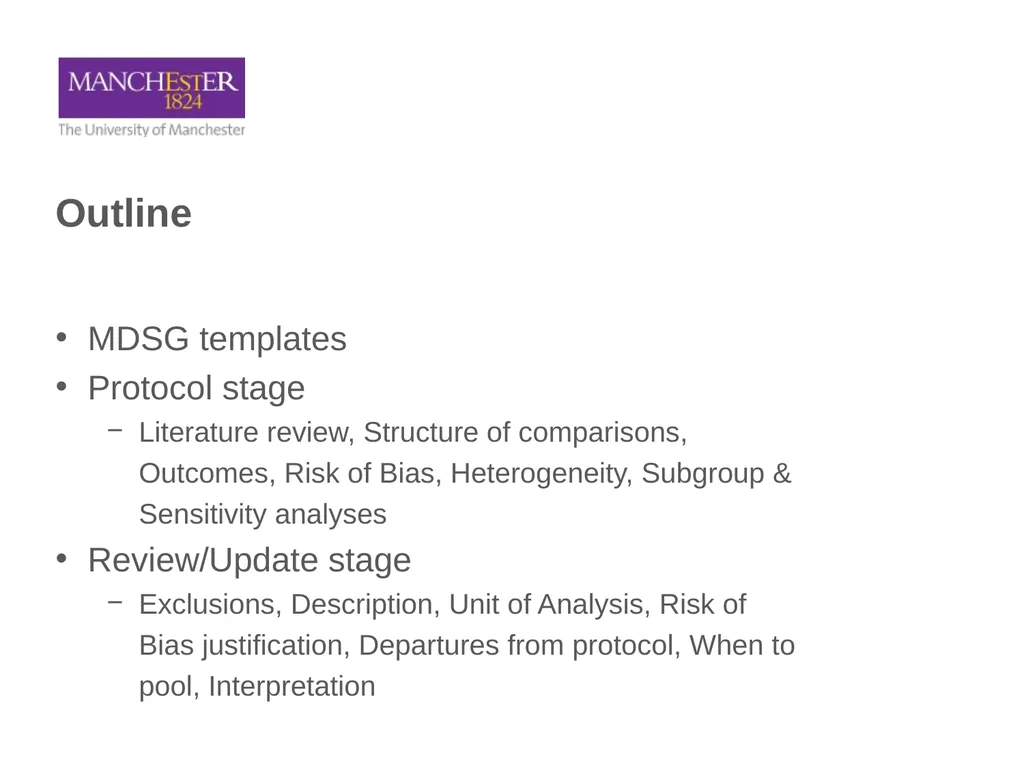
Outline MDSG templates
Protocol stage
Literature review, Structure of comparisons, Outcomes, Risk of Bias, Heterogeneity, Subgroup & Sensitivity analyses
Review/Update stage
Exclusions, Description, Unit of Analysis, Risk of Bias justification, Departures from protocol, When to pool, Interpretation<br>
03
Good News! Structure and recognition
Primary outcomes, Adverse events, RCT designs, Randomisation & Risk of Bias, Summary statistics & Analysis, Confidence
MDSG templates
Methods & Results
Much improved standard and standardisation<br>
04
Templates Please use them or cover same issues
Understand them first
Copy only relevant parts
Do what you copied!<br>
05
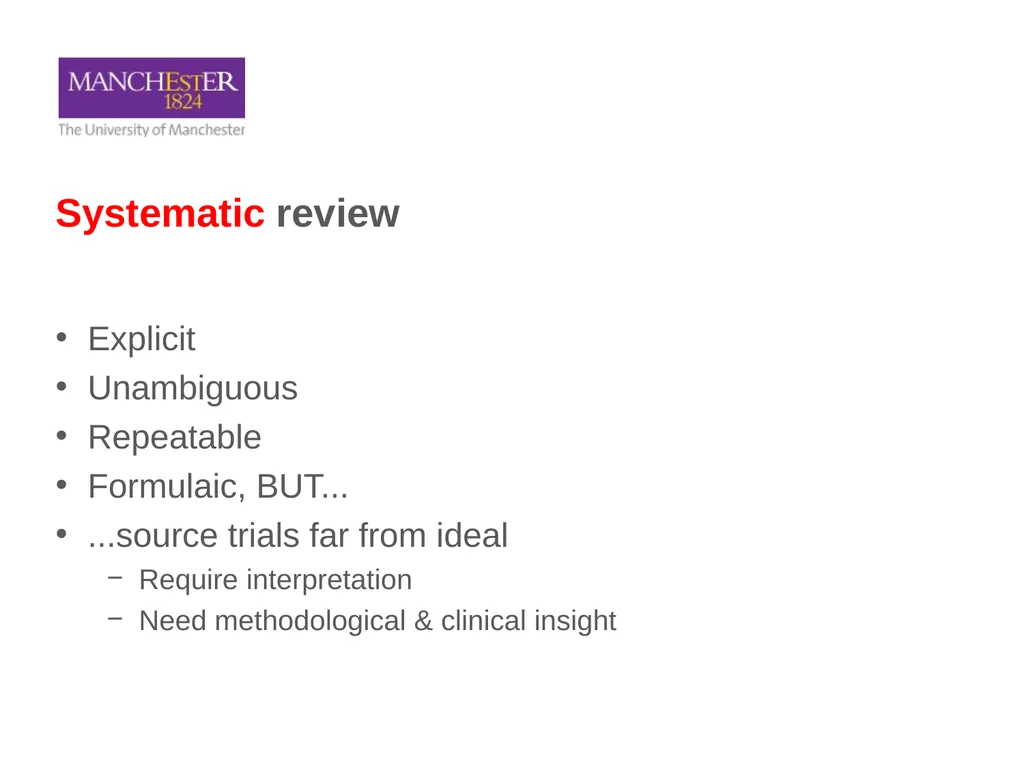
Systematic review Explicit
Unambiguous
Repeatable
Formulaic, BUT...
...source trials far from ideal
Require interpretation
Need methodological & clinical insight<br>
06
PROTOCOL STAGE<br>
07
Literature review Avoid temptation to cite RCTs
Selective citation prejudges review!<br>
08
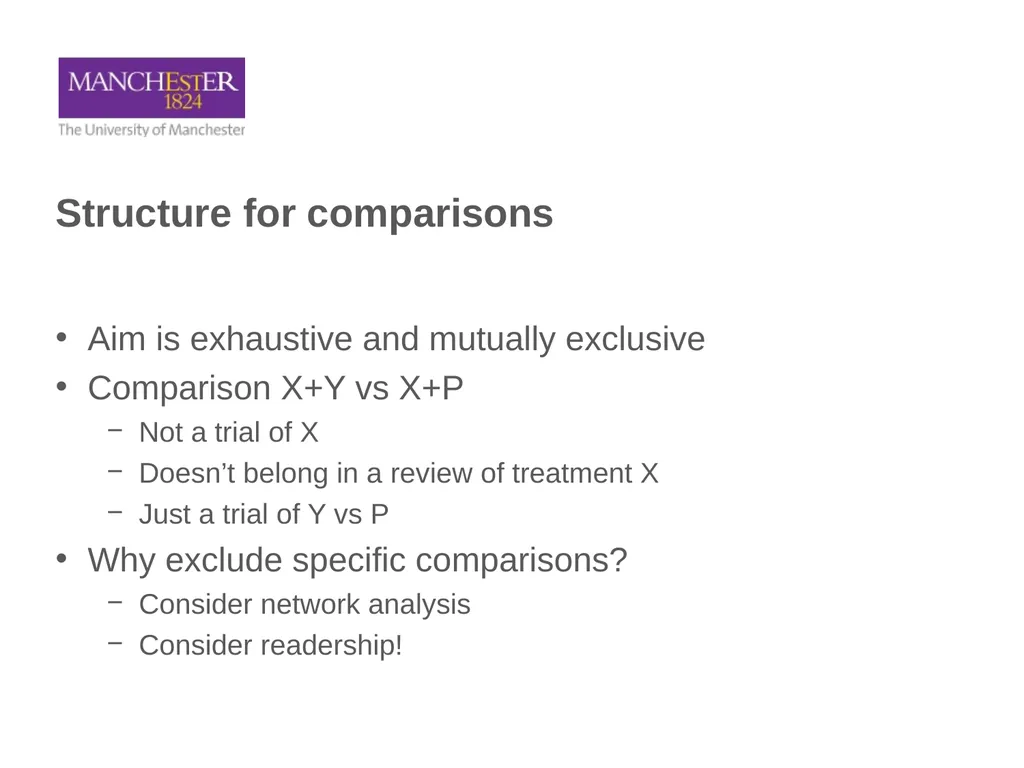
Structure for comparisons Aim is exhaustive and mutually exclusive
Comparison X+Y vs X+P
Not a trial of X
Doesn’t belong in a review of treatment X
Just a trial of Y vs P
Why exclude specific comparisons?
Consider network analysis
Consider readership!<br>
09
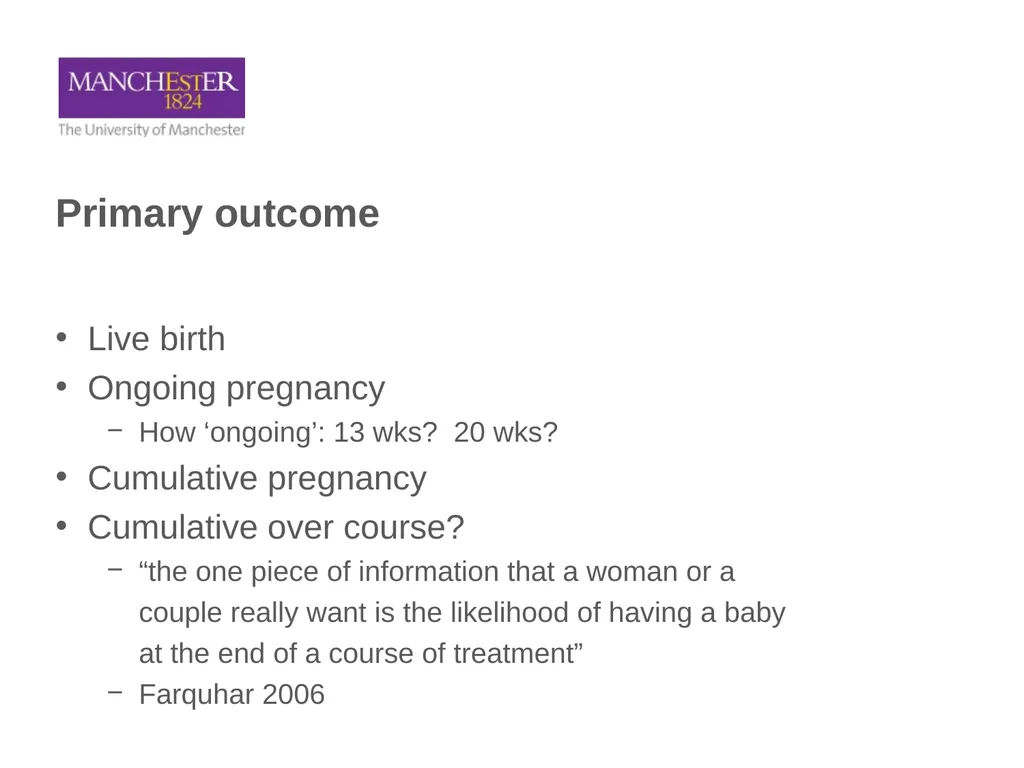
Primary outcome Live birth
Ongoing pregnancy
How ‘ongoing’: 13 wks? 20 wks?
Cumulative pregnancy
Cumulative over course?
“the one piece of information that a woman or a couple really want is the likelihood of having a baby at the end of a course of treatment”
Farquhar 2006<br>
10
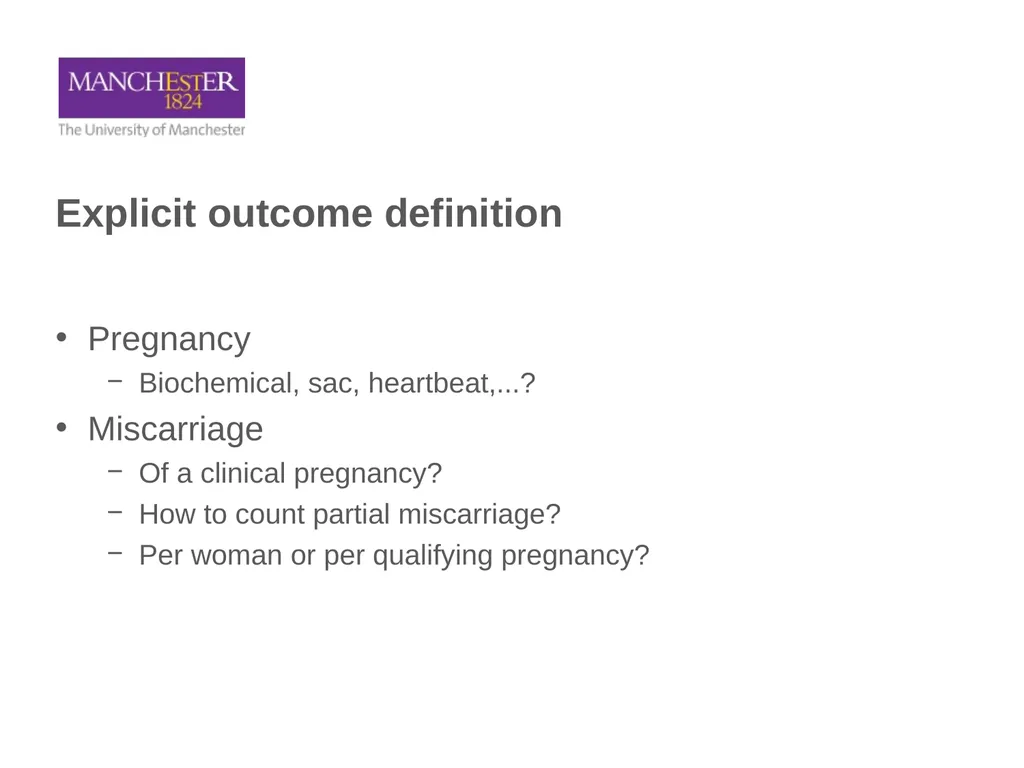
Explicit outcome definition Pregnancy
Biochemical, sac, heartbeat,...?
Miscarriage
Of a clinical pregnancy?
How to count partial miscarriage?
Per woman or per qualifying pregnancy?<br>
11
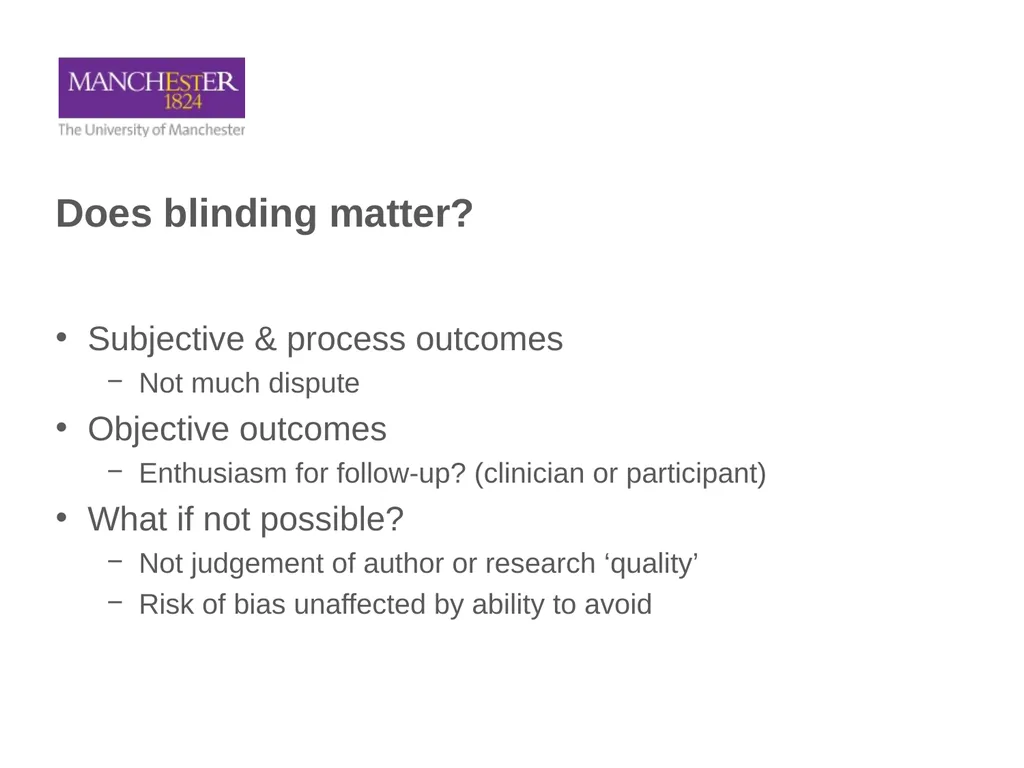
Does blinding matter? Subjective & process outcomes
Not much dispute
Objective outcomes
Enthusiasm for follow-up? (clinician or participant)
What if not possible?
Not judgement of author or research ‘quality’
Risk of bias unaffected by ability to avoid<br>
12
Other risks? Within-study concerns (mainly)
Not ‘quality’ or ‘trustworthiness’
Funding source
Baseline imbalance
Prospective power calculation
More from Vivienne to follow<br>
13
Heterogeneity Interpretation categories for I-squared
Deliberately overlapping to prevent blind copying!
Not really sensible
Size & direction matter<br>
14
Subgroup or Sensitivity analysis? Sensitivity
Is conclusion affected by arbitrary choices made?
Analysis method
Fixed effect, OR, imputation
Eligibility criteria
Risk of bias, clinical criteria
Subgroup
Is effect evident in subgroup of studies?<br>
15
Subgroup or Sensitivity analysis? Sensitivity can be by subgroup analysis
Motive rather than method
Subgroup
Is effect evident in subgroup of studies?<br>
16
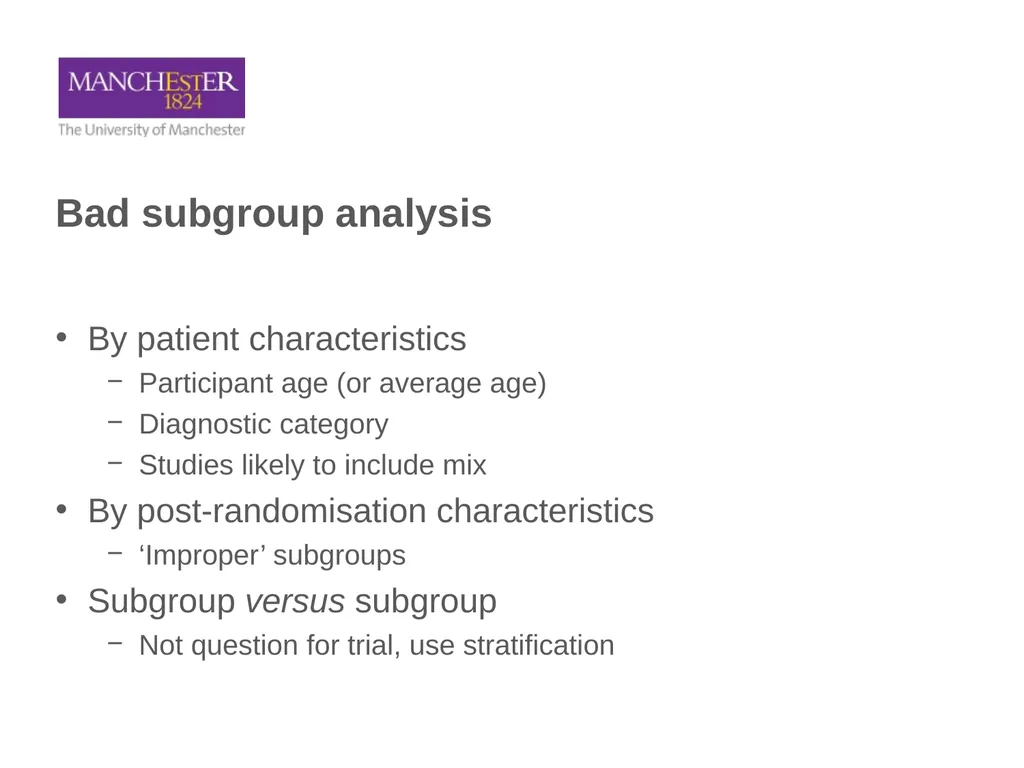
Bad subgroup analysis By patient characteristics
Participant age (or average age)
Diagnostic category
Studies likely to include mix
By post-randomisation characteristics
‘Improper’ subgroups
Subgroup versus subgroup
Not question for trial, use stratification<br>
17
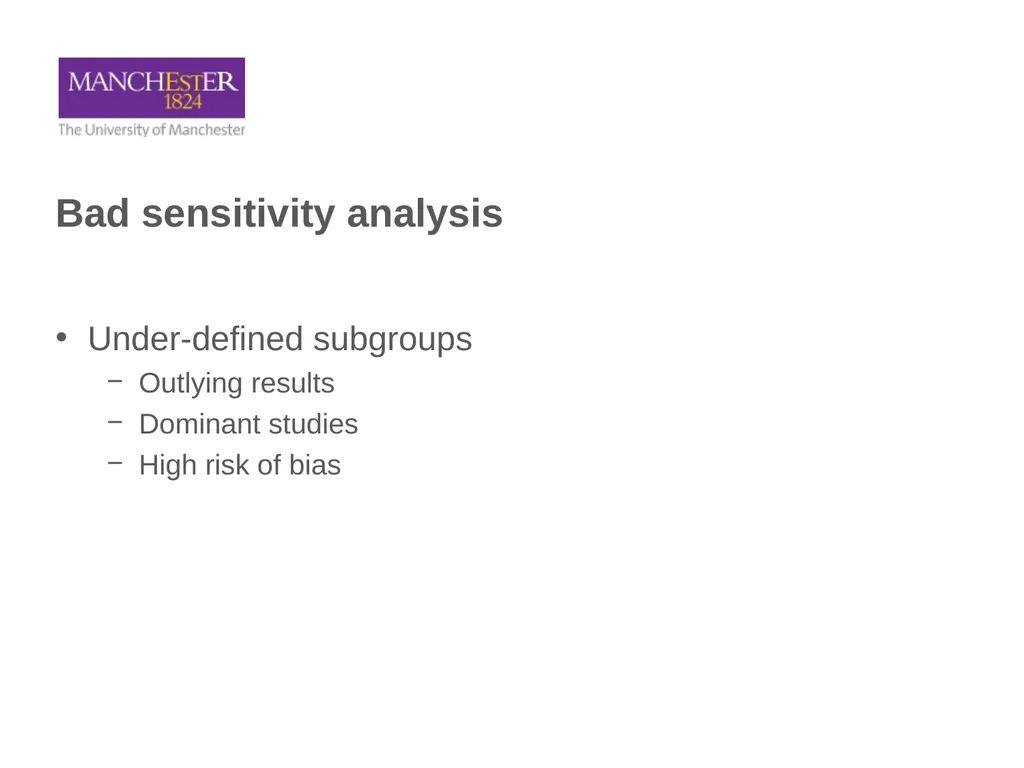
Bad sensitivity analysis Under-defined subgroups
Outlying results
Dominant studies
High risk of bias<br>
18
REVIEW (& UPDATE!) STAGE<br>
19
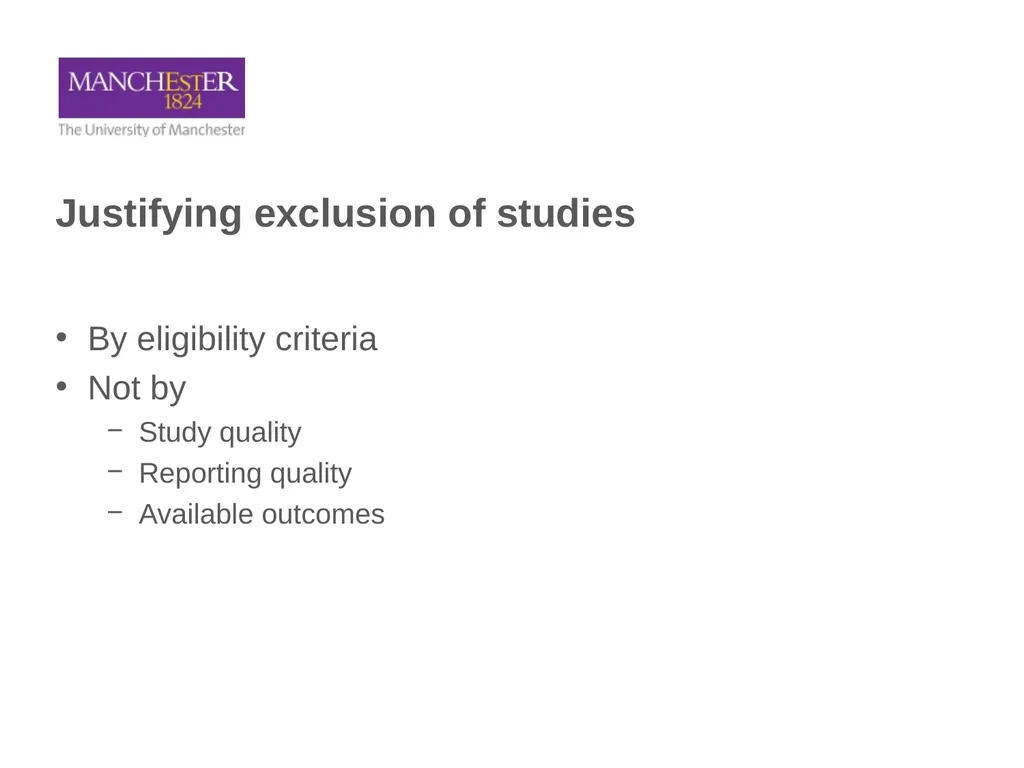
Justifying exclusion of studies By eligibility criteria
Not by
Study quality
Reporting quality
Available outcomes<br>
20
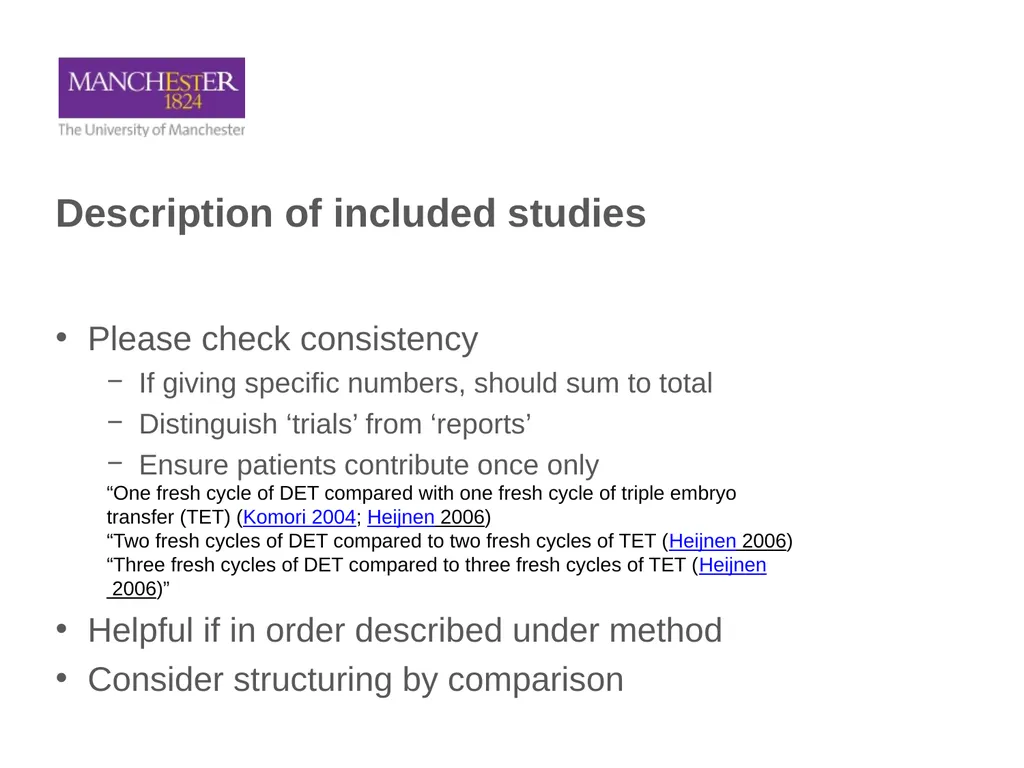
Description of included studies Please check consistency
If giving specific numbers, should sum to total
Distinguish ‘trials’ from ‘reports’
Ensure patients contribute once only
“One fresh cycle of DET compared with one fresh cycle of triple embryo transfer (TET) (Komori 2004; Heijnen 2006)
“Two fresh cycles of DET compared to two fresh cycles of TET (Heijnen 2006)
“Three fresh cycles of DET compared to three fresh cycles of TET (Heijnen 2006)”
Helpful if in order described under method
Consider structuring by comparison<br>
21
Unit of analysis Repetition of participant
Cross-over trials, multiple cycles
Dependence between participants
Cluster trials, surgical/therapy & group interventions
Repetition within participant
Bilateral condition, fertilisation ‘rate’
Post-randomisation exclusion
Mean oocyte retrieval excluding zeros<br>
22
Risk of Bias Justify all decisions explicitly
“Sealed opaque envelopes” not enough for ‘low’
Other domains
Internal validity only
e.g. unadjusted interim analyses
Report efforts to obtain information
Email to arrange a phone call
Use a methodologist<br>
23
Describing results Avoid ambiguity
“no cases were reported”
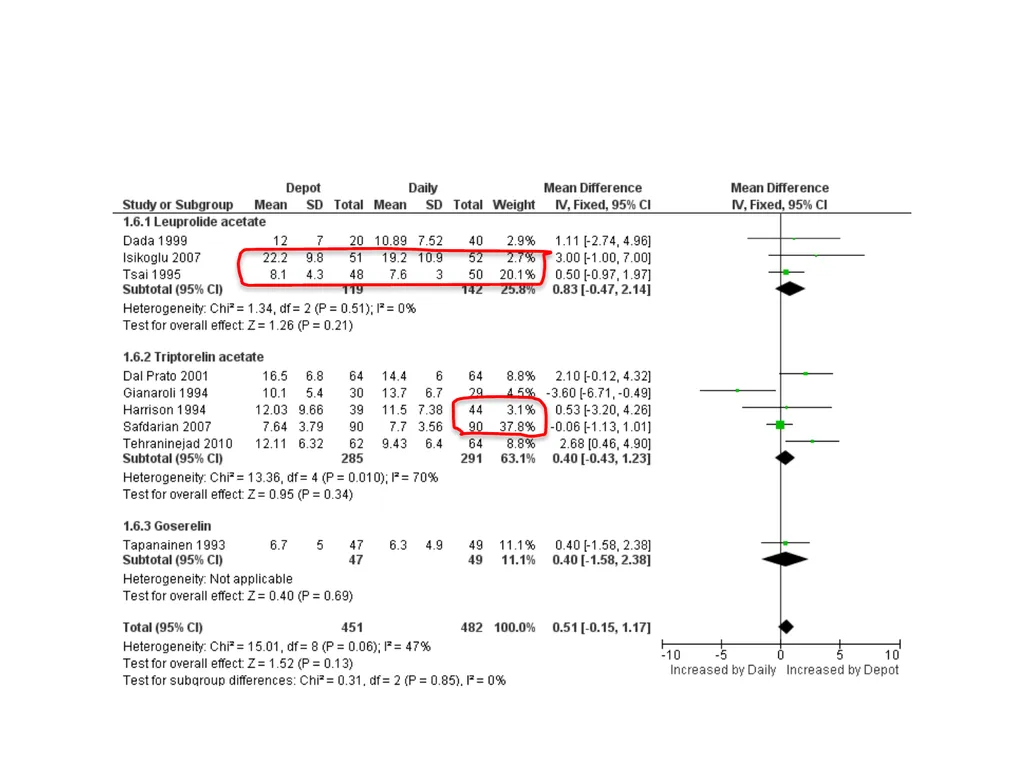
Beware whacky SD
Check relative weight in line with relative size
Trial authors or journal mis-labelled SE?<br>
24
Choosing not to pool data Aim to be systematic
Sometimes turns out to be silly!
“We should be prepared more often to assemble trials but not perform a formal meta-analysis”
“We should acknowledge the difficulties and not pretend that a systematic review is simpler or more objective than it is”
Doug Altman, 2004
Justify any departure from protocol explicitly<br>
25
Reporting analyses Please be systematic
Order of outcomes
Same terminology
Be repetitive!
Reporting scale
Translate analysis statistic for typical controls<br>
26
Translation “The studies do not indicate that there is statistically significant difference... (OR 0.97, 95% CI 0.74 to 1.27)”
Prefer to see:
“This means that for women with a 25% chance of [outcome] using [control intervention] the corresponding chance using [experimental] would be between 16% and 30%”.<br>
27
Inference Fixation with significance
Please interpret via the confidence interval
‘Significant’ does not mean ‘important’
Logic of subgroup comparison
Need stratified analysis to explore differences
Absence of evidence
“We found no effect of...” always unhelpful<br>
28
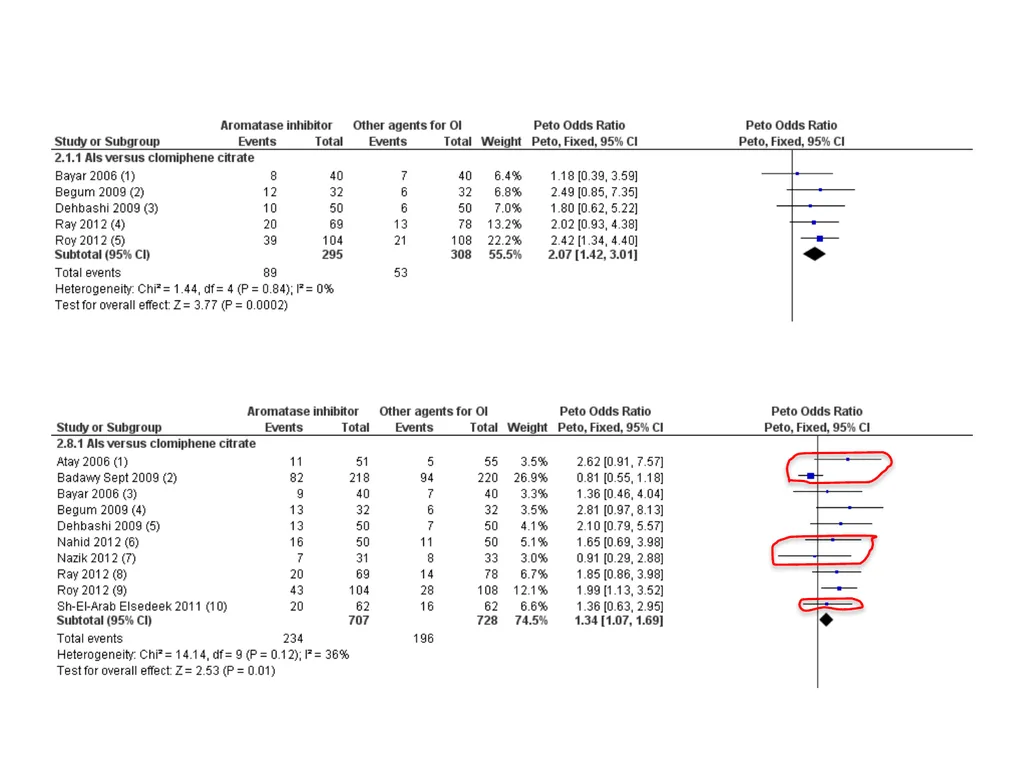
Interpreting partial results Beware outcome reporting bias
Do subset reporting live birth have typical pregnancy data?
Do those reporting both have similar OR for each?<br>
29
Interpretation Precision versus accuracy
Sample size gives precision
Bias affects accuracy
Remember your risk of bias assessment
Meta-analysis results often precisely wrong!<br>
30
Summary Understand & use the templates
Don’t start without a methodologist
Give explicit justification of all decisions
Could others repeat your work from detail given?
Report with painstaking monotony
No prizes for literature!
Resist urge to ‘spin’<br>