
Corporate Finance for Long-Term Value Chapter 4:


Description: Corporate Finance for Long-Term Value Chapter 4: Discount rates and scarcity of capital Chapter 4: Discount rates and scarcity of capital Part 2: Discount rates and valuation methods The BIG Picture 3 Discounting reflects the time value of
Related Topics
Download Presentation
"Corporate Finance for Long-Term Value Chapter 4:" is the property of its rightful owner. Permission is granted to download and print the materials on this website for personal, non-commercial use only, and to display it on your personal computer provided you do not modify the materials and that you retain all copyright notices contained in the materials. By downloading content from our website, you accept the terms of this agreement.
Presentation Transcript
slide1. Corporate Finance for
Long-Term Value Chapter 4: Discount rates and scarcity of capital<br>
slide2. Chapter 4: Discount rates and scarcity of capital Part 2: Discount rates and valuation methods<br>
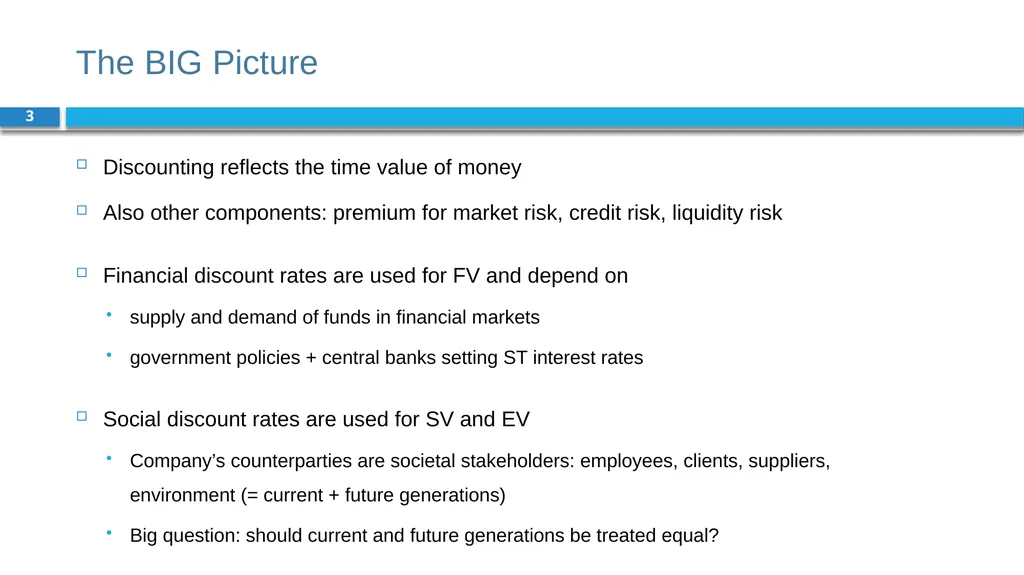
slide3. The BIG Picture 3 Discounting reflects the time value of money
Also other components: premium for market risk, credit risk, liquidity risk
Financial discount rates are used for FV and depend on
supply and demand of funds in financial markets
government policies + central banks setting ST interest rates
Social discount rates are used for SV and EV
Company’s counterparties are societal stakeholders: employees, clients, suppliers, environment (= current + future generations)
Big question: should current and future generations be treated equal?<br>
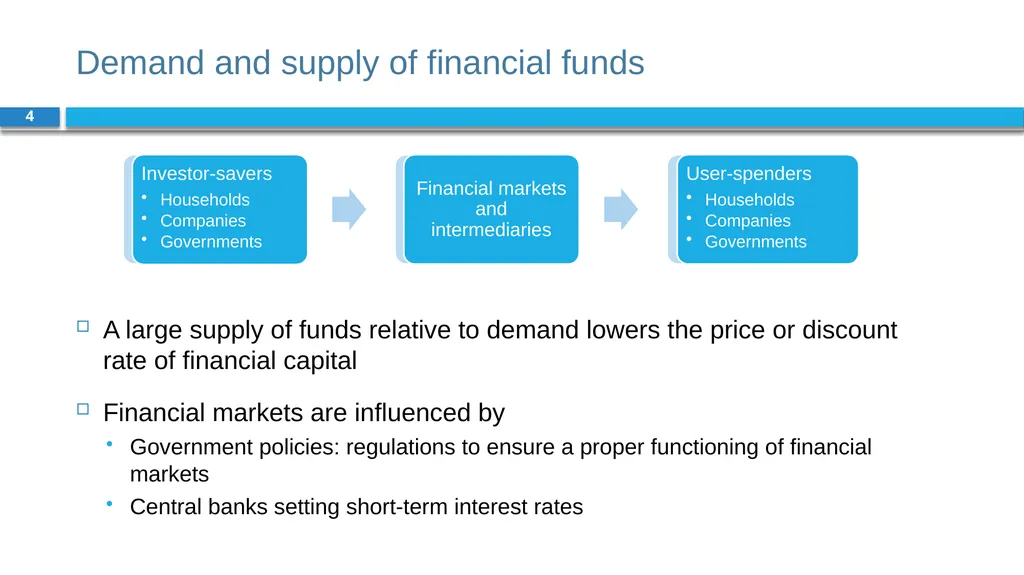
slide4. Demand and supply of financial funds 4 A large supply of funds relative to demand lowers the price or discount rate of financial capital
Financial markets are influenced by
Government policies: regulations to ensure a proper functioning of financial markets
Central banks setting short-term interest rates<br>
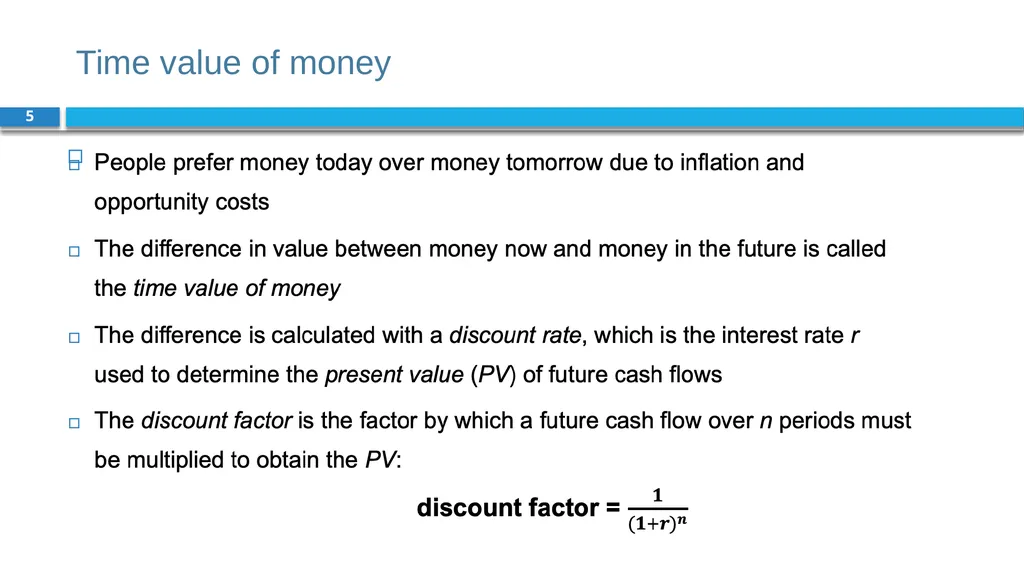
slide5. Time value of money 5<br>
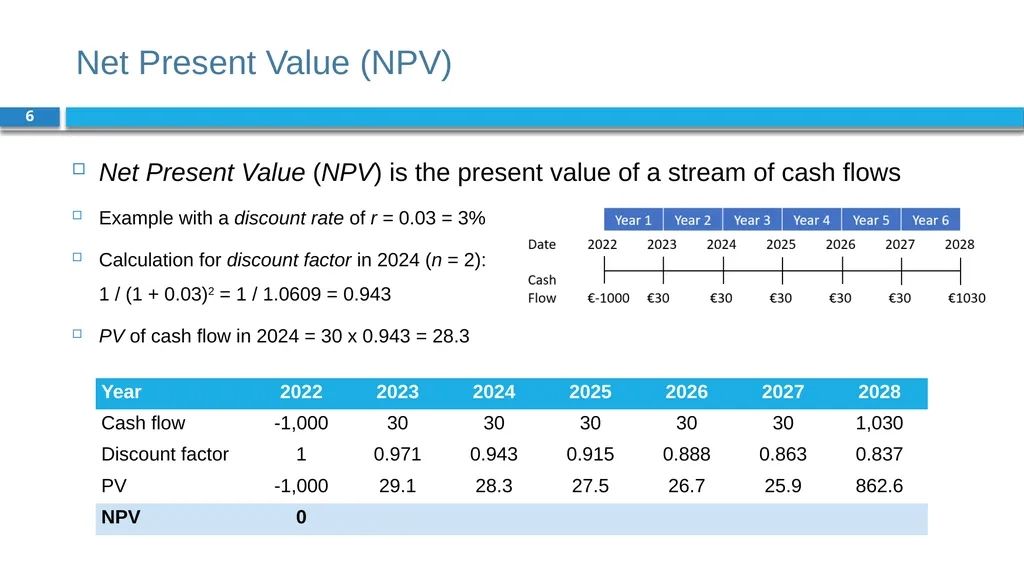
slide6. Net Present Value (NPV) 6 Net Present Value (NPV) is the present value of a stream of cash flows
Example with a discount rate of r = 0.03 = 3%
Calculation for discount factor in 2024 (n = 2): 1 / (1 + 0.03)2 = 1 / 1.0609 = 0.943
PV of cash flow in 2024 = 30 x 0.943 = 28.3<br>
slide7. Arbitrage and law of one price 7 Arbitrage = the buying and selling of ‘equivalent’ or ‘similar’ goods in different markets to benefit from price differences (exceeding transaction costs)
Arbitrage opportunity = situation in which it is possible to make a profit from an investment without taking risk (‘free lunch’)
Arbitrage only works if the law of one price does not hold, which says that the same product should sell at the same price
Finance predicts that arbitrage profits (NPVs) will often be zero: competition between investors will quickly result in the adjustment of prices of over- or under-priced securities<br>
slide8. Law of one price in Finance 8 Finance predicts that arbitrage profits (NPVs) will often be zero: competition between investors will quickly result in the adjustment of prices of over- or under-priced securities
Law of one price is underlying many calculations and valuations -> two securities that generate the same payoff must cost the same
Yields of bonds with same maturity, credit risk and liquidity risk (Ch8)
Modigliani-Miller theorem on capital structure (Ch15)
Options pricing – put-call parity (Ch19)
Etc.<br>
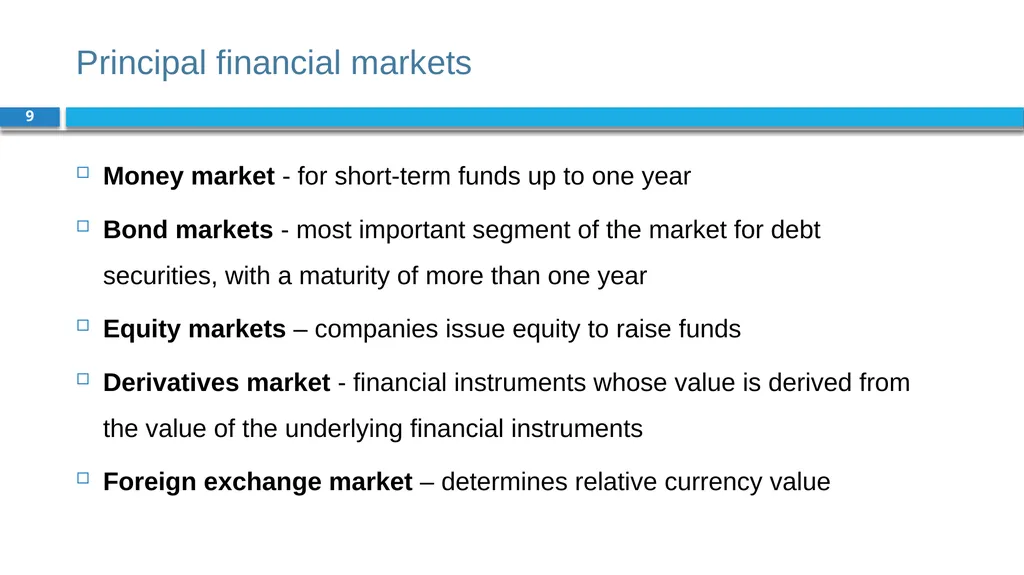
slide9. Principal financial markets 9 Money market - for short-term funds up to one year
Bond markets - most important segment of the market for debt securities, with a maturity of more than one year
Equity markets – companies issue equity to raise funds
Derivatives market - financial instruments whose value is derived from the value of the underlying financial instruments
Foreign exchange market – determines relative currency value<br>
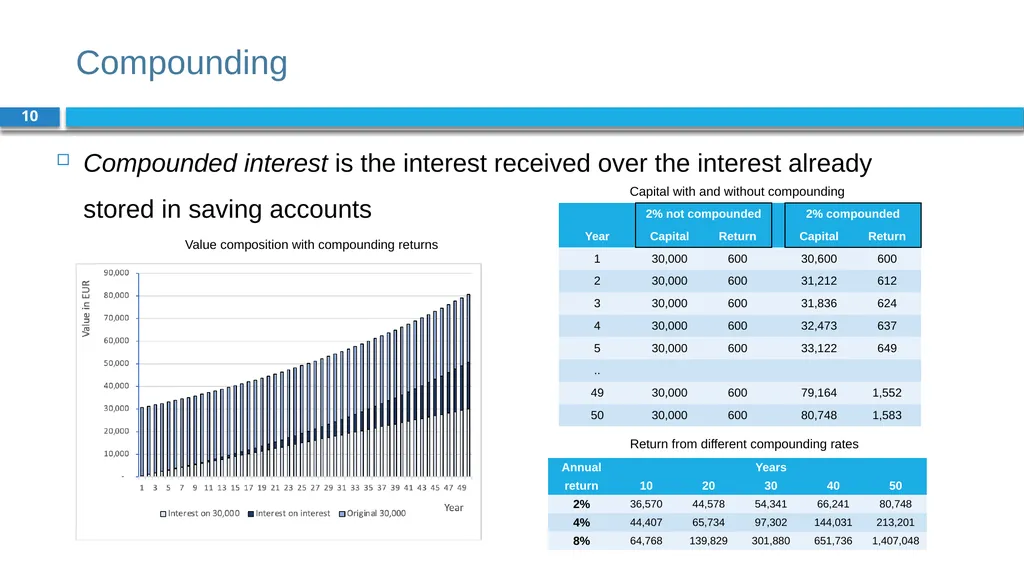
slide10. Compounding 10 Compounded interest is the interest received over the interest already stored in saving accounts Value composition with compounding returns Capital with and without compounding Return from different compounding rates<br>
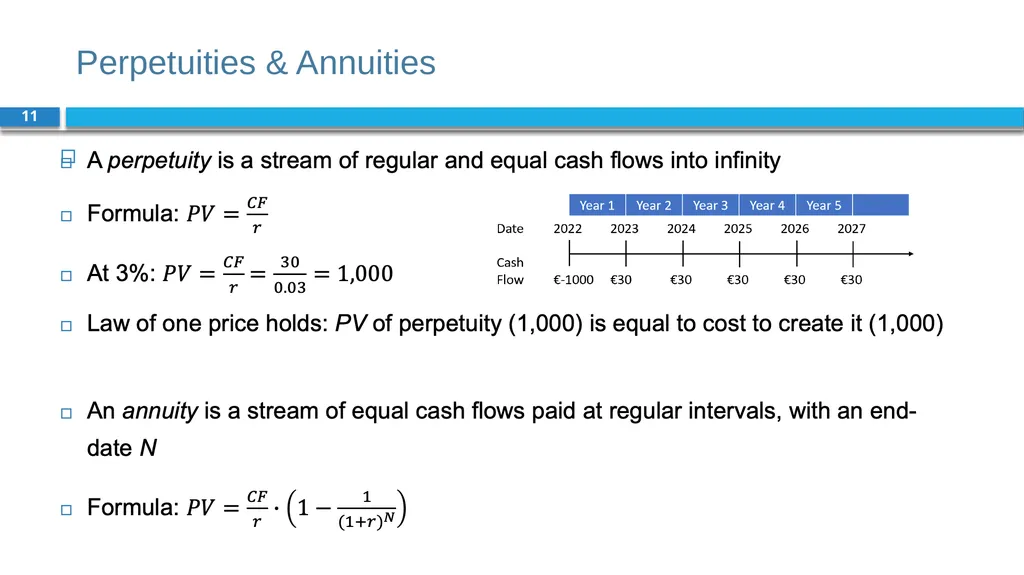
slide11. Perpetuities & Annuities 11<br>
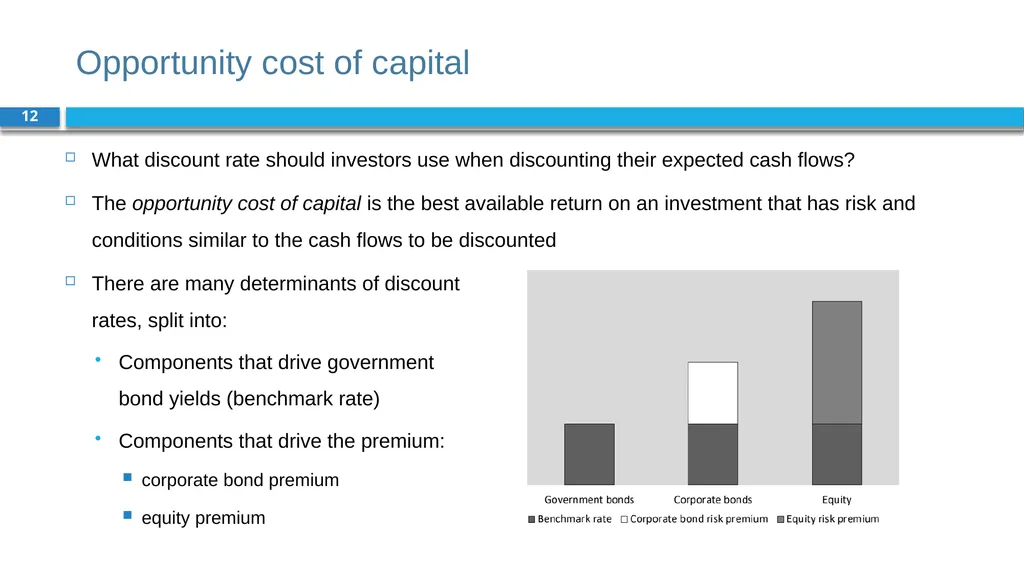
slide12. Opportunity cost of capital 12 What discount rate should investors use when discounting their expected cash flows?
The opportunity cost of capital is the best available return on an investment that has risk and conditions similar to the cash flows to be discounted
There are many determinants of discount rates, split into:
Components that drive government bond yields (benchmark rate)
Components that drive the premium:
corporate bond premium
equity premium<br>
slide13. Benchmark – government bonds 13 The highest quality government securities are considered ‘risk-free’
Market discount rates are the benchmarks against which discount rates are determined
Yields of government bonds are influenced by expected short-term interest rates and the term premium
Risk-averse investors demand a term premium (or risk premium) for investments in long-term bonds
The term premium leads to a positive term spread, which is the difference between yields for bonds with longer maturity and yields for bonds with shorter maturity<br>
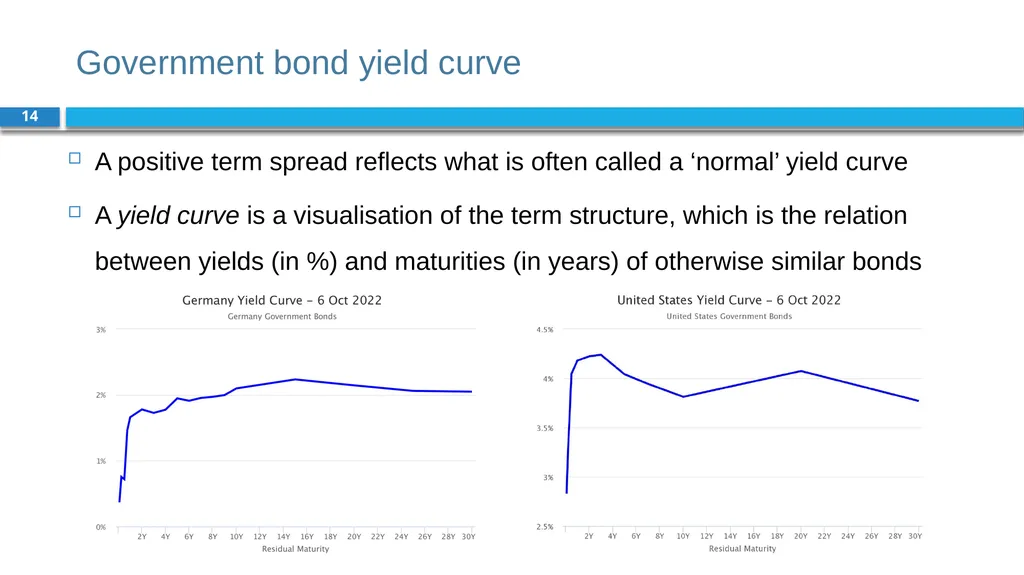
slide14. Government bond yield curve 14 A positive term spread reflects what is often called a ‘normal’ yield curve
A yield curve is a visualisation of the term structure, which is the relation between yields (in %) and maturities (in years) of otherwise similar bonds<br>
slide15. Credit risk 15 Apart from interest rate expectations and the term premium, credit risk and liquidity also influence government bond yields
Credit risk premium is the spread between the yield of a particular bond and the yield of a bond with similar characteristics but without credit risk
Rating agencies (Moody’s, S&P, Fitch) indicate issuers’ credit risk by assigning them a credit rating, (AAA, A+, BBB-, etc.)
Drivers of country credit rating differences: per capita income, GDP growth, inflation, external debt, economic development and default history<br>
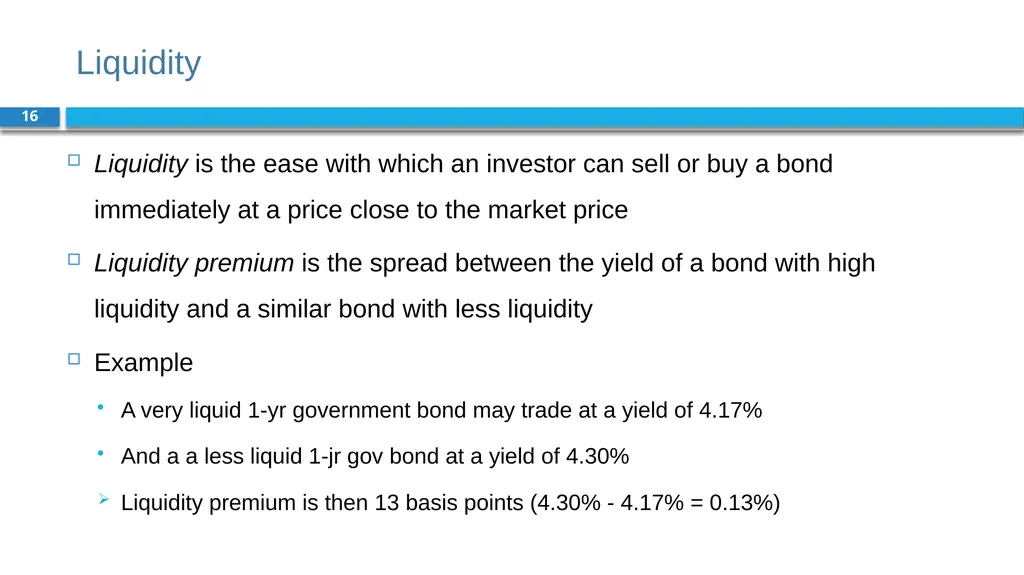
slide16. Liquidity 16 Liquidity is the ease with which an investor can sell or buy a bond immediately at a price close to the market price
Liquidity premium is the spread between the yield of a bond with high liquidity and a similar bond with less liquidity
Example
A very liquid 1-yr government bond may trade at a yield of 4.17%
And a a less liquid 1-jr gov bond at a yield of 4.30%
Liquidity premium is then 13 basis points (4.30% - 4.17% = 0.13%)<br>
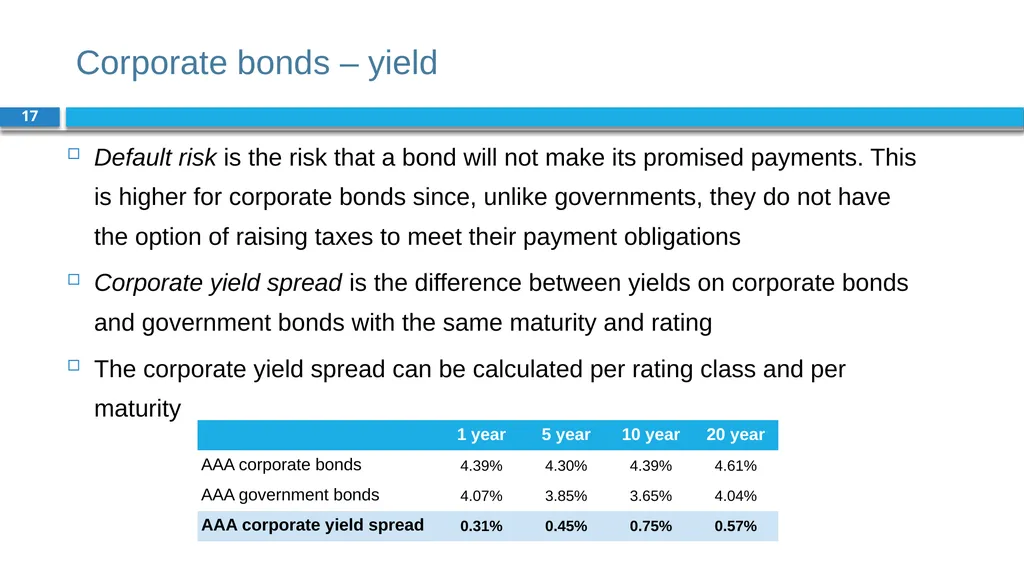
slide17. Corporate bonds – yield 17 Default risk is the risk that a bond will not make its promised payments. This is higher for corporate bonds since, unlike governments, they do not have the option of raising taxes to meet their payment obligations
Corporate yield spread is the difference between yields on corporate bonds and government bonds with the same maturity and rating
The corporate yield spread can be calculated per rating class and per maturity<br>
slide18. Equities – market risk premium 18 Shareholders are residual claimants as they are paid only after other stakeholders have been paid
As a result, equity typically carries a higher risk than corporate bonds
The equity risk premium is the expected excess return of equities over the risk-free rate
The equity risk premium tends to be higher for smaller companies, more cyclical companies, and companies with weaker corporate governance<br>
slide19. Discounting social and environmental capital 19 The counterparty of companies’ social and environmental capital is the wider society, representing current and future generations. This raises two fundamental and ethical questions:
Should current and future generations be treated equally?
What is the appropriate discount rate for society (the social discount rate)?
Equal treatment of current and future generations implies a zero time preference between current and future generations<br>
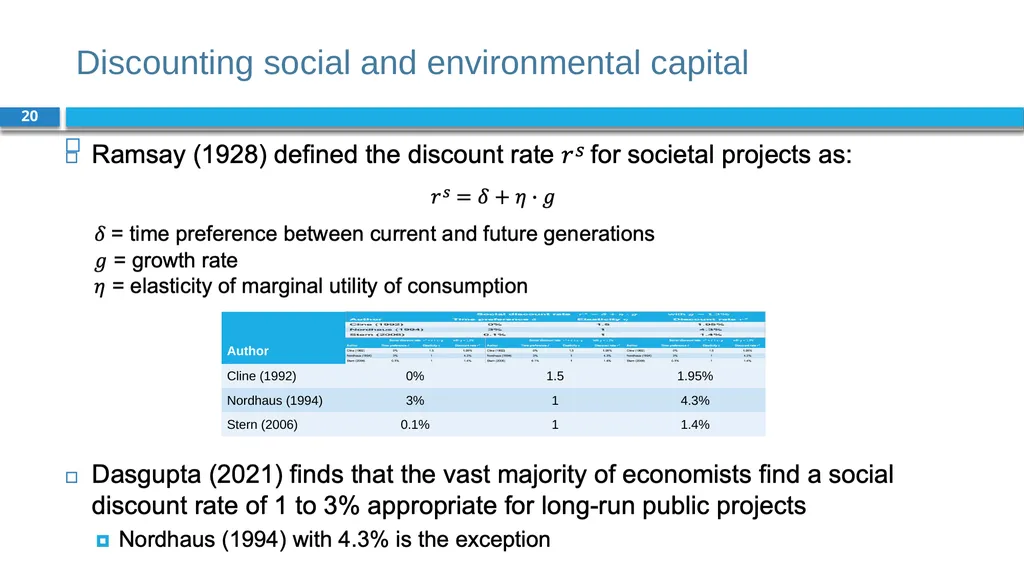
slide20. Discounting social and environmental capital 20<br>
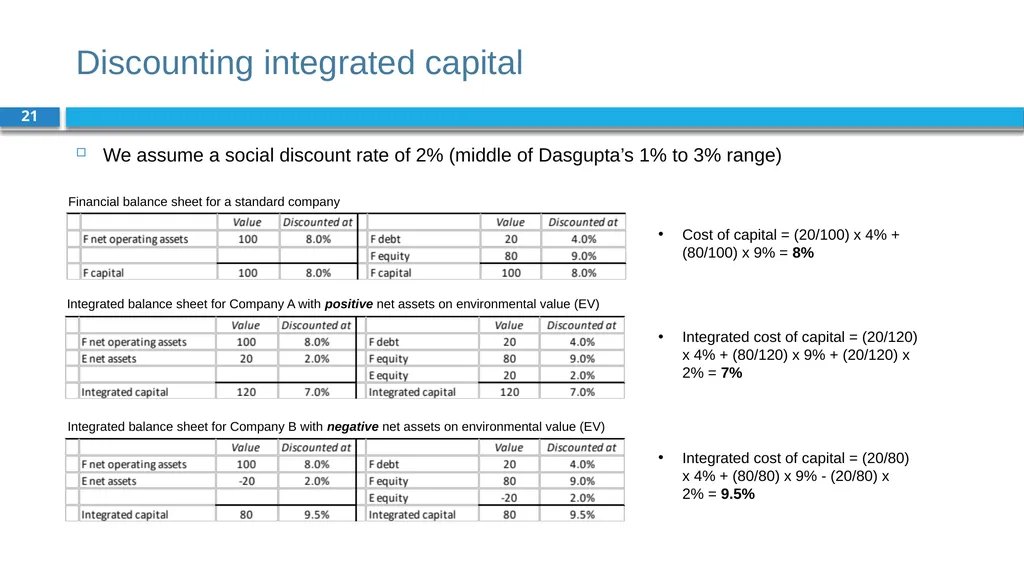
slide21. Discounting integrated capital 21 We assume a social discount rate of 2% (middle of Dasgupta’s 1% to 3% range) Integrated balance sheet for Company A with positive net assets on environmental value (EV) Integrated balance sheet for Company B with negative net assets on environmental value (EV) Financial balance sheet for a standard company Cost of capital = (20/100) x 4% + (80/100) x 9% = 8% Integrated cost of capital = (20/120) x 4% + (80/120) x 9% + (20/120) x 2% = 7% Integrated cost of capital = (20/80) x 4% + (80/80) x 9% - (20/80) x 2% = 9.5%<br>
slide22. Internalisation 22 Similar starting financial balance can be different after (the anticipation of) internalisation of social and environmental externalities
The empirical prediction is:
Companies with large social and environmental liabilities will have a higher cost of integrated capital
Companies with social and environmental assets will enjoy a lower cost of integrated capital
The risk premium will rise when the risk of internalisation rises<br>
slide23. Conclusions 23 Present values and discount rates are needed when considering the future in investment decisions
The counterparty of companies’ social and environmental capital is the wider society, representing current and future generations
An equal treatment of current and future generations implies a low social discount rate
Larger environmental and social liabilities raise the cost of integrated capital, while environmental and social assets lower the cost of integrated capital<br>
slide2. Chapter 4: Discount rates and scarcity of capital Part 2: Discount rates and valuation methods<br>
slide3. The BIG Picture 3 Discounting reflects the time value of money
Also other components: premium for market risk, credit risk, liquidity risk
Financial discount rates are used for FV and depend on
supply and demand of funds in financial markets
government policies + central banks setting ST interest rates
Social discount rates are used for SV and EV
Company’s counterparties are societal stakeholders: employees, clients, suppliers, environment (= current + future generations)
Big question: should current and future generations be treated equal?<br>
slide4. Demand and supply of financial funds 4 A large supply of funds relative to demand lowers the price or discount rate of financial capital
Financial markets are influenced by
Government policies: regulations to ensure a proper functioning of financial markets
Central banks setting short-term interest rates<br>
slide5. Time value of money 5<br>
slide6. Net Present Value (NPV) 6 Net Present Value (NPV) is the present value of a stream of cash flows
Example with a discount rate of r = 0.03 = 3%
Calculation for discount factor in 2024 (n = 2): 1 / (1 + 0.03)2 = 1 / 1.0609 = 0.943
PV of cash flow in 2024 = 30 x 0.943 = 28.3<br>
slide7. Arbitrage and law of one price 7 Arbitrage = the buying and selling of ‘equivalent’ or ‘similar’ goods in different markets to benefit from price differences (exceeding transaction costs)
Arbitrage opportunity = situation in which it is possible to make a profit from an investment without taking risk (‘free lunch’)
Arbitrage only works if the law of one price does not hold, which says that the same product should sell at the same price
Finance predicts that arbitrage profits (NPVs) will often be zero: competition between investors will quickly result in the adjustment of prices of over- or under-priced securities<br>
slide8. Law of one price in Finance 8 Finance predicts that arbitrage profits (NPVs) will often be zero: competition between investors will quickly result in the adjustment of prices of over- or under-priced securities
Law of one price is underlying many calculations and valuations -> two securities that generate the same payoff must cost the same
Yields of bonds with same maturity, credit risk and liquidity risk (Ch8)
Modigliani-Miller theorem on capital structure (Ch15)
Options pricing – put-call parity (Ch19)
Etc.<br>
slide9. Principal financial markets 9 Money market - for short-term funds up to one year
Bond markets - most important segment of the market for debt securities, with a maturity of more than one year
Equity markets – companies issue equity to raise funds
Derivatives market - financial instruments whose value is derived from the value of the underlying financial instruments
Foreign exchange market – determines relative currency value<br>
slide10. Compounding 10 Compounded interest is the interest received over the interest already stored in saving accounts Value composition with compounding returns Capital with and without compounding Return from different compounding rates<br>
slide11. Perpetuities & Annuities 11<br>
slide12. Opportunity cost of capital 12 What discount rate should investors use when discounting their expected cash flows?
The opportunity cost of capital is the best available return on an investment that has risk and conditions similar to the cash flows to be discounted
There are many determinants of discount rates, split into:
Components that drive government bond yields (benchmark rate)
Components that drive the premium:
corporate bond premium
equity premium<br>
slide13. Benchmark – government bonds 13 The highest quality government securities are considered ‘risk-free’
Market discount rates are the benchmarks against which discount rates are determined
Yields of government bonds are influenced by expected short-term interest rates and the term premium
Risk-averse investors demand a term premium (or risk premium) for investments in long-term bonds
The term premium leads to a positive term spread, which is the difference between yields for bonds with longer maturity and yields for bonds with shorter maturity<br>
slide14. Government bond yield curve 14 A positive term spread reflects what is often called a ‘normal’ yield curve
A yield curve is a visualisation of the term structure, which is the relation between yields (in %) and maturities (in years) of otherwise similar bonds<br>
slide15. Credit risk 15 Apart from interest rate expectations and the term premium, credit risk and liquidity also influence government bond yields
Credit risk premium is the spread between the yield of a particular bond and the yield of a bond with similar characteristics but without credit risk
Rating agencies (Moody’s, S&P, Fitch) indicate issuers’ credit risk by assigning them a credit rating, (AAA, A+, BBB-, etc.)
Drivers of country credit rating differences: per capita income, GDP growth, inflation, external debt, economic development and default history<br>
slide16. Liquidity 16 Liquidity is the ease with which an investor can sell or buy a bond immediately at a price close to the market price
Liquidity premium is the spread between the yield of a bond with high liquidity and a similar bond with less liquidity
Example
A very liquid 1-yr government bond may trade at a yield of 4.17%
And a a less liquid 1-jr gov bond at a yield of 4.30%
Liquidity premium is then 13 basis points (4.30% - 4.17% = 0.13%)<br>
slide17. Corporate bonds – yield 17 Default risk is the risk that a bond will not make its promised payments. This is higher for corporate bonds since, unlike governments, they do not have the option of raising taxes to meet their payment obligations
Corporate yield spread is the difference between yields on corporate bonds and government bonds with the same maturity and rating
The corporate yield spread can be calculated per rating class and per maturity<br>
slide18. Equities – market risk premium 18 Shareholders are residual claimants as they are paid only after other stakeholders have been paid
As a result, equity typically carries a higher risk than corporate bonds
The equity risk premium is the expected excess return of equities over the risk-free rate
The equity risk premium tends to be higher for smaller companies, more cyclical companies, and companies with weaker corporate governance<br>
slide19. Discounting social and environmental capital 19 The counterparty of companies’ social and environmental capital is the wider society, representing current and future generations. This raises two fundamental and ethical questions:
Should current and future generations be treated equally?
What is the appropriate discount rate for society (the social discount rate)?
Equal treatment of current and future generations implies a zero time preference between current and future generations<br>
slide20. Discounting social and environmental capital 20<br>
slide21. Discounting integrated capital 21 We assume a social discount rate of 2% (middle of Dasgupta’s 1% to 3% range) Integrated balance sheet for Company A with positive net assets on environmental value (EV) Integrated balance sheet for Company B with negative net assets on environmental value (EV) Financial balance sheet for a standard company Cost of capital = (20/100) x 4% + (80/100) x 9% = 8% Integrated cost of capital = (20/120) x 4% + (80/120) x 9% + (20/120) x 2% = 7% Integrated cost of capital = (20/80) x 4% + (80/80) x 9% - (20/80) x 2% = 9.5%<br>
slide22. Internalisation 22 Similar starting financial balance can be different after (the anticipation of) internalisation of social and environmental externalities
The empirical prediction is:
Companies with large social and environmental liabilities will have a higher cost of integrated capital
Companies with social and environmental assets will enjoy a lower cost of integrated capital
The risk premium will rise when the risk of internalisation rises<br>
slide23. Conclusions 23 Present values and discount rates are needed when considering the future in investment decisions
The counterparty of companies’ social and environmental capital is the wider society, representing current and future generations
An equal treatment of current and future generations implies a low social discount rate
Larger environmental and social liabilities raise the cost of integrated capital, while environmental and social assets lower the cost of integrated capital<br>