
Engaging the Students: Using Clickers in Math
CS
Published · 142 slides · 0 views

1 / 1











Description
Engaging the Students: Using Clickers in Math Classrooms at all Levels Patti Frazer Lock St. Lawrence University plockstlawu.edu MAA Seaway Section Meeting April, 2018 Outline Introduction and Background Test drive the system! Ways to use
Related Topics
Share
Embed code
Download this presentation From Below
"Engaging the Students: Using Clickers in Math" is the property of its rightful owner. Permission is granted to download and print the materials on this website for personal, non-commercial use only, and to display it on your personal computer provided you do not modify the materials and that you retain all copyright notices contained in the materials. By downloading content from our website, you accept the terms of this agreement.
Presentation Transcript
01
Engaging the Students:
Using Clickers in Math Classrooms at all Levels Patti Frazer Lock
St. Lawrence University
plock@stlawu.edu MAA Seaway Section Meeting
April, 2018<br>
Using Clickers in Math Classrooms at all Levels Patti Frazer Lock
St. Lawrence University
plock@stlawu.edu MAA Seaway Section Meeting
April, 2018<br>
02
Outline Introduction and Background
Test drive the system!
Ways to use clickers
Discussion of student reaction and impact on learning and instructor reaction
Specific Examples:
Calculus
Intro Stat
Upper Level<br>
Test drive the system!
Ways to use clickers
Discussion of student reaction and impact on learning and instructor reaction
Specific Examples:
Calculus
Intro Stat
Upper Level<br>
03
Clickers Several systems available. I’ve used at least three; currently use iClickers.
Multiple-choice questions are usually on a PowerPoint slide or equivalent. (but don’t have to be)
Some clickers offer more flexibility (more options or short answer)
Students use wireless “clickers” to answer.
Apps are available for using a smartphone or laptop
Clickers are assigned to students, and the software automatically keeps a complete record of results on all questions for the instructor.<br>
Multiple-choice questions are usually on a PowerPoint slide or equivalent. (but don’t have to be)
Some clickers offer more flexibility (more options or short answer)
Students use wireless “clickers” to answer.
Apps are available for using a smartphone or laptop
Clickers are assigned to students, and the software automatically keeps a complete record of results on all questions for the instructor.<br>
04
My experience I’ve used clickers since at least 2005.
Used in
Calculus I
Calculus II
Calculus III
Intro Stats
Bridge to Higher Mathematics
Abstract Algebra (Group Theory)
Graph Theory
First Year Seminars<br>
Used in
Calculus I
Calculus II
Calculus III
Intro Stats
Bridge to Higher Mathematics
Abstract Algebra (Group Theory)
Graph Theory
First Year Seminars<br>
05
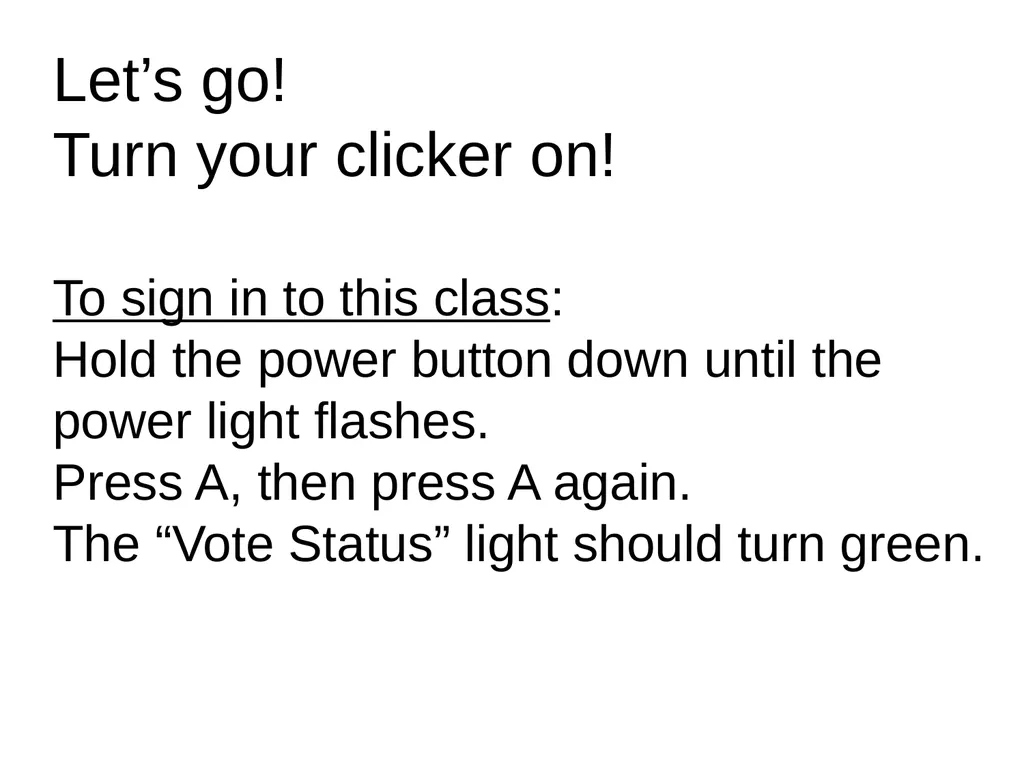
Let’s go!
Turn your clicker on!
To sign in to this class:
Hold the power button down until the power light flashes.
Press A, then press A again.
The “Vote Status” light should turn green.<br>
Turn your clicker on!
To sign in to this class:
Hold the power button down until the power light flashes.
Press A, then press A again.
The “Vote Status” light should turn green.<br>
06
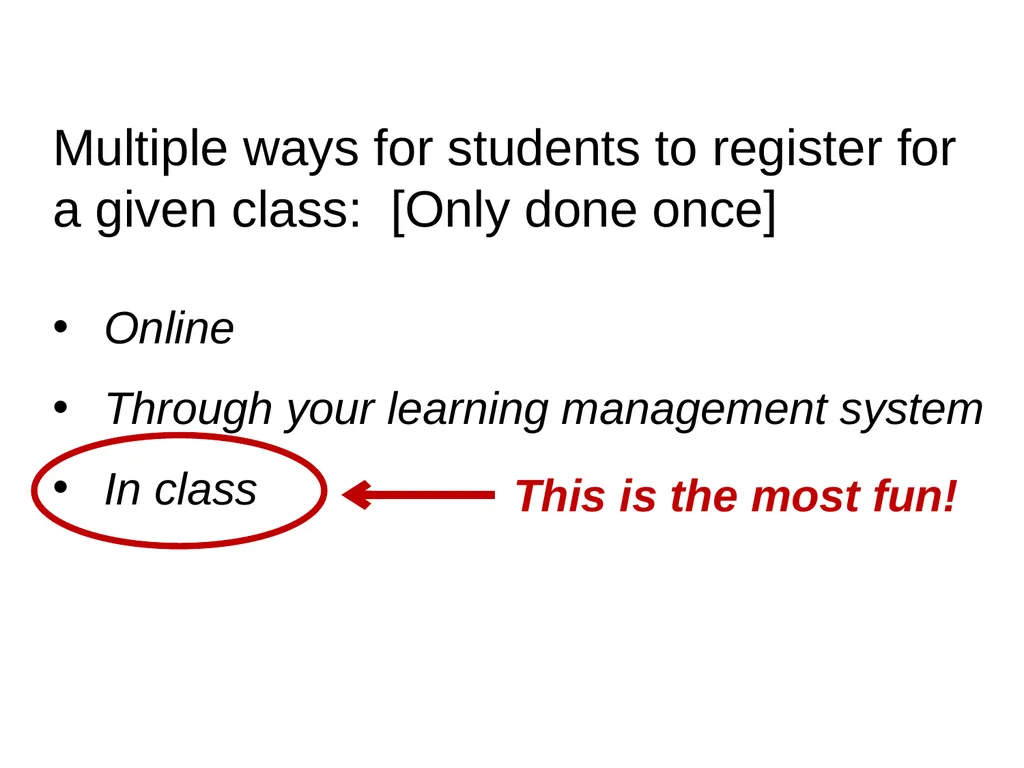
Multiple ways for students to register for a given class: [Only done once]
Online
Through your learning management system
In class This is the most fun!<br>
Online
Through your learning management system
In class This is the most fun!<br>
07
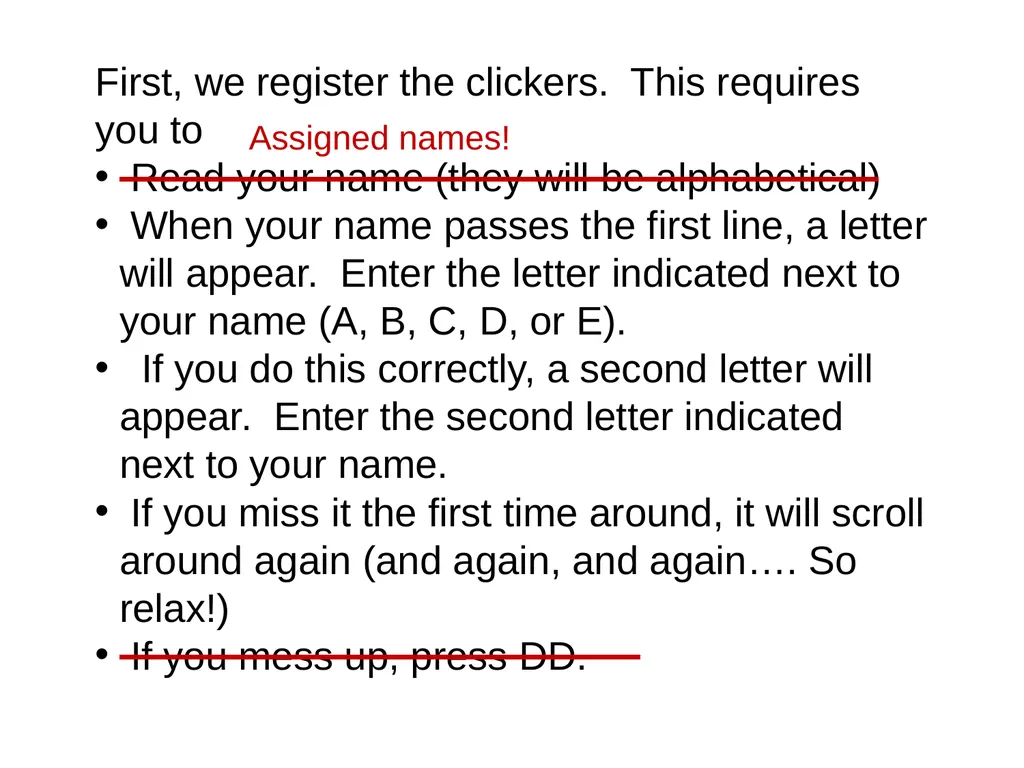
First, we register the clickers. This requires you to
Read your name (they will be alphabetical)
When your name passes the first line, a letter will appear. Enter the letter indicated next to your name (A, B, C, D, or E).
If you do this correctly, a second letter will appear. Enter the second letter indicated next to your name.
If you miss it the first time around, it will scroll around again (and again, and again…. So relax!)
If you mess up, press DD. Assigned names!<br>
Read your name (they will be alphabetical)
When your name passes the first line, a letter will appear. Enter the letter indicated next to your name (A, B, C, D, or E).
If you do this correctly, a second letter will appear. Enter the second letter indicated next to your name.
If you miss it the first time around, it will scroll around again (and again, and again…. So relax!)
If you mess up, press DD. Assigned names!<br>
08
Can you use your clicker?
A. Yes
B. No
C. I don’t know
D. I don’t have a clicker
E. What is a clicker? iClicker<br>
09
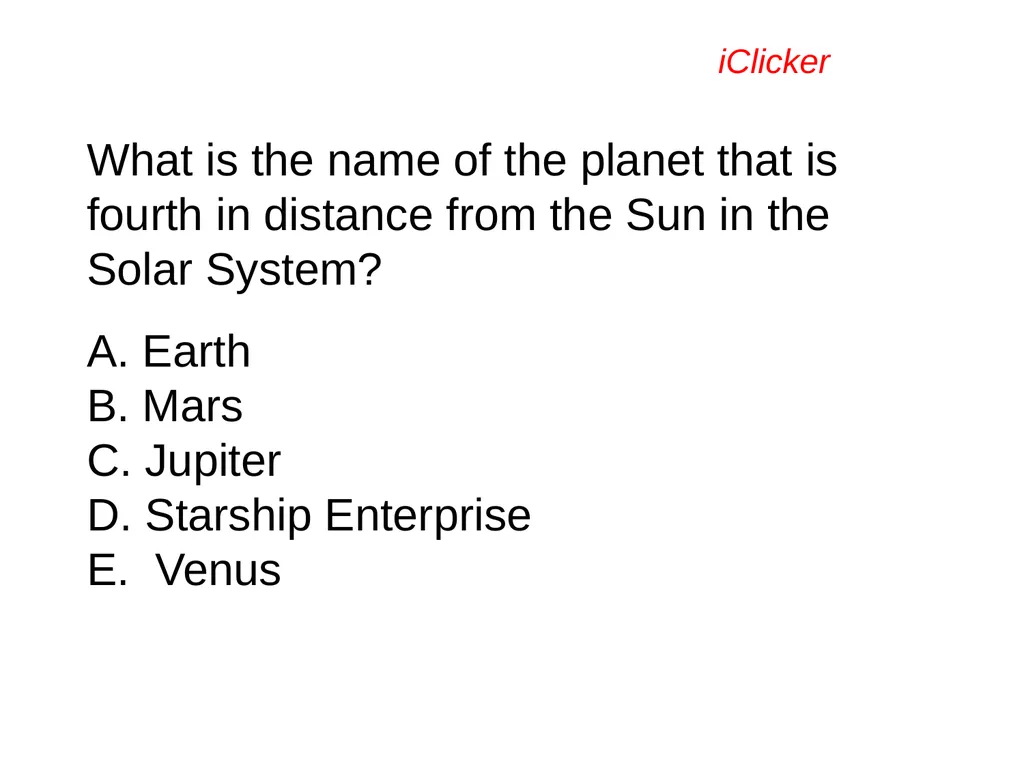
What is the name of the planet that is fourth in distance from the Sun in the Solar System?
A. Earth
B. Mars
C. Jupiter
D. Starship Enterprise
E. Venus iClicker<br>
10
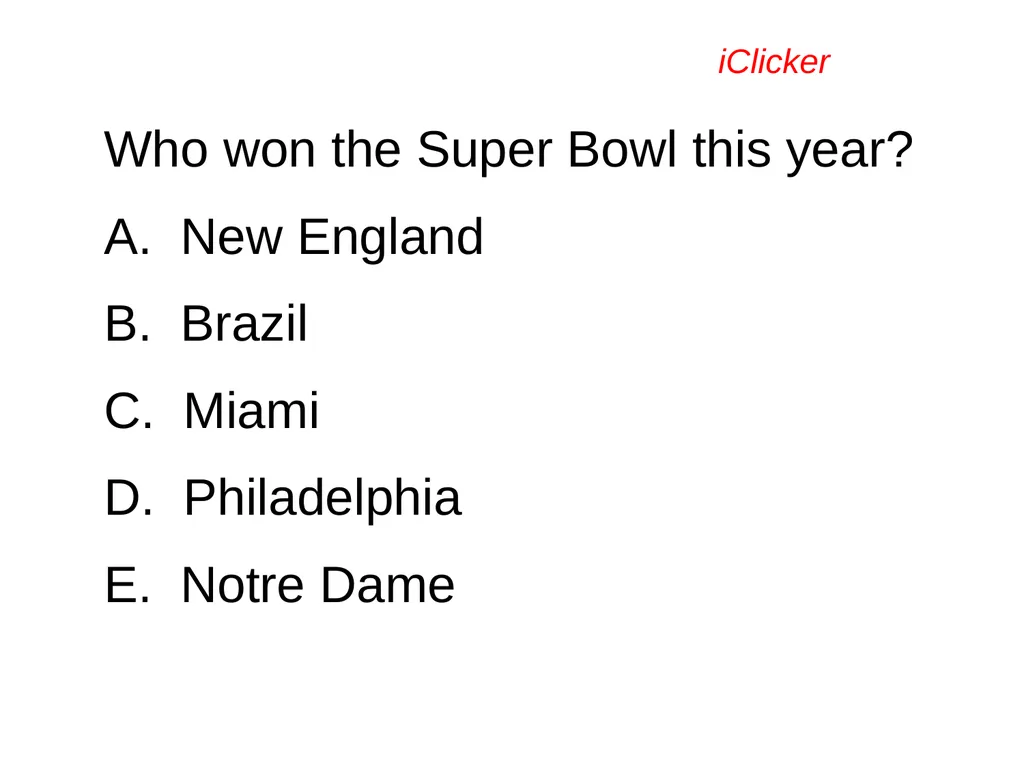
Who won the Super Bowl this year?
A. New England
B. Brazil
C. Miami
Philadelphia
E. Notre Dame iClicker<br>
A. New England
B. Brazil
C. Miami
Philadelphia
E. Notre Dame iClicker<br>
11
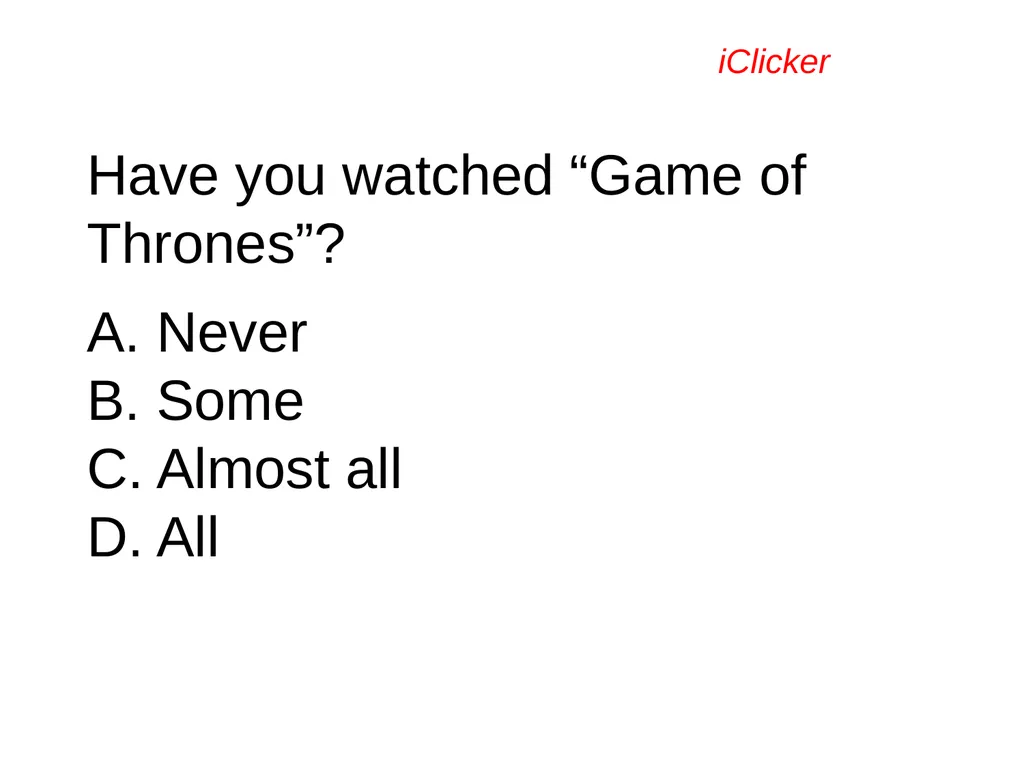
Have you watched “Game of Thrones”?
A. Never
B. Some
C. Almost all
D. All iClicker<br>
12
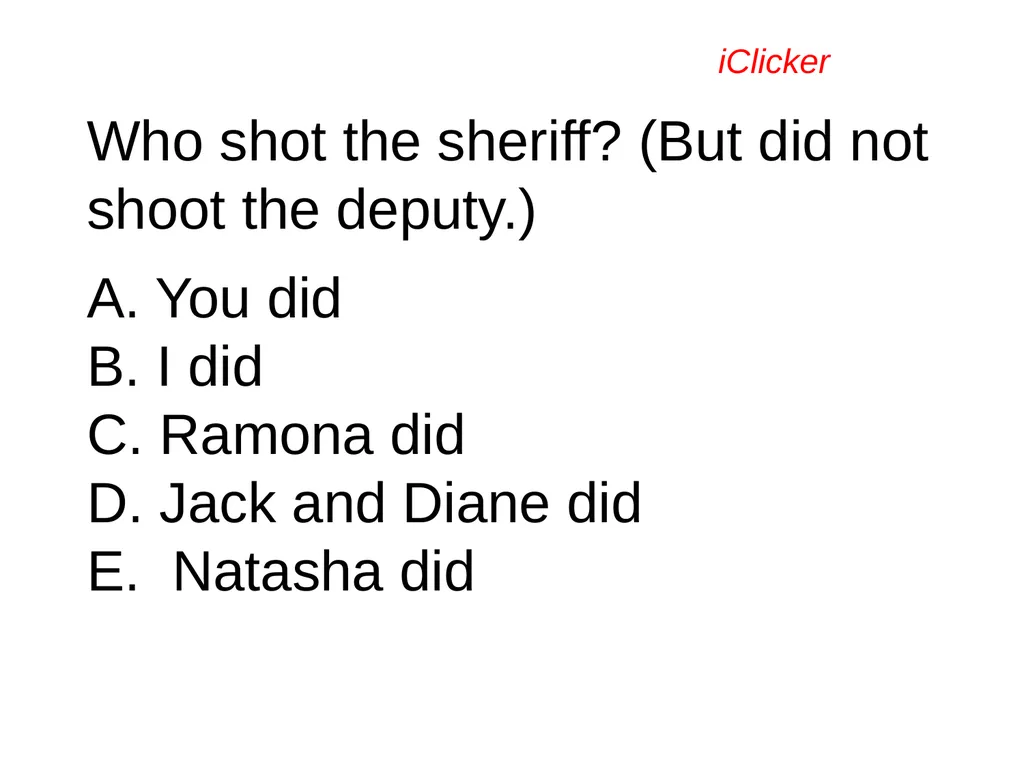
Who shot the sheriff? (But did not shoot the deputy.)
A. You did
B. I did
C. Ramona did
D. Jack and Diane did
E. Natasha did iClicker<br>
13
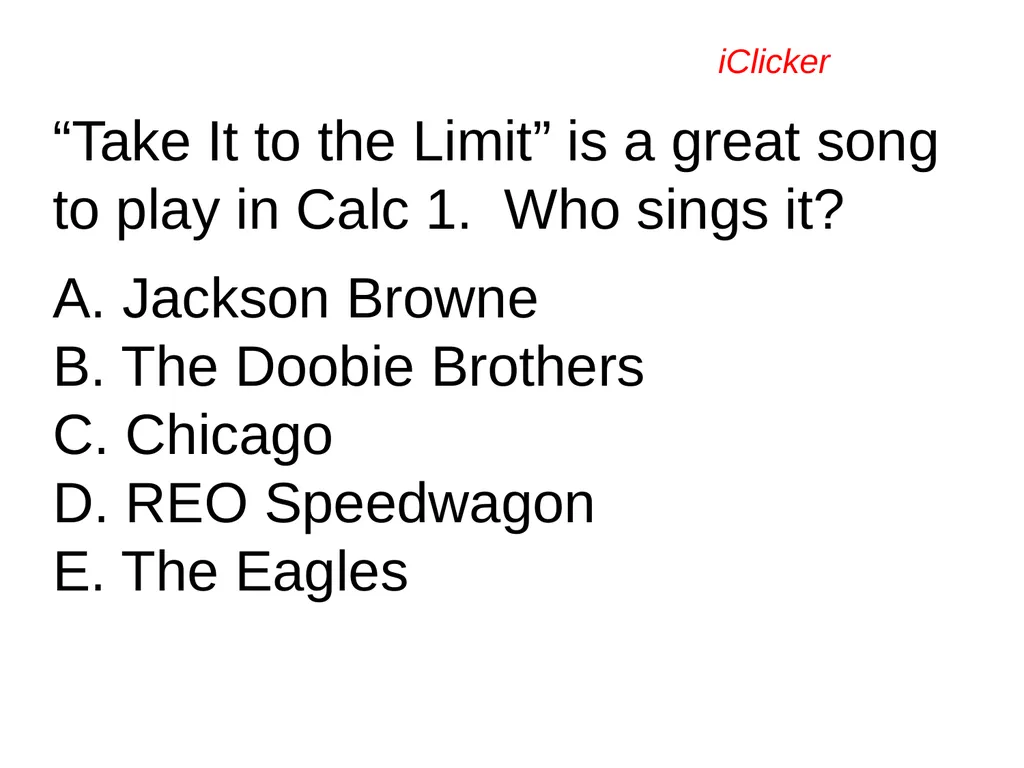
“Take It to the Limit” is a great song to play in Calc 1. Who sings it?
A. Jackson Browne
B. The Doobie Brothers
C. Chicago
D. REO Speedwagon
E. The Eagles iClicker<br>
14
How many of the following social media sites have you used in the last week?
FaceBook, Twitter, Instagram, Snapchat
A. 0
B. 1
C. 2
D. 3
E. 4 iClicker<br>
15
Should students majoring in math be required to take an Intro Stat class?
A. No
B. Yes
C. Depends on their future plans
D. Depends on the course
E. Only if it doesn’t reduce their theoretical exposure iClicker<br>
16
Should students majoring in math be required to take an applied data analysis class?
A. No
B. Yes
C. Depends on their future plans
D. Depends on the course
E. Only if it doesn’t reduce their theoretical exposure iClicker<br>
17
Which of the following is NOT a parody by Weird Al Yankovic?
A. Word Crimes (from Blurred Lines)
B. You don’t take your showers (from You don’t bring me flowers)
C. Gee, I’m a Nerd (from Free as a Bird)
D. I think I’m a Clone Now (from I think we’re alone now)
E. I Bought the Sandwich (from I Shot the Sheriff) iClicker<br>
18
iClicker What do you want to ask? Come up with a question!<br>
19
How I use Clickers Questions are Fast, Easy, asked in Real Time.
Are you paying attention? Have you processed what we just talked about? Do you understand this concept or definition?
Are you staying engaged? Is your brain turned on? Stick with us here!
“Clicker grade” counts! But minimally!
Clicker responses count for about 5% of final grade, with about 75% of that for participation and 25% for accuracy.
I am generous with the clicker grade! (Important for instructor sanity)
This was just one of multiple modes of assessment (quizzes, exams, group work, projects, homework, …)<br>
Are you paying attention? Have you processed what we just talked about? Do you understand this concept or definition?
Are you staying engaged? Is your brain turned on? Stick with us here!
“Clicker grade” counts! But minimally!
Clicker responses count for about 5% of final grade, with about 75% of that for participation and 25% for accuracy.
I am generous with the clicker grade! (Important for instructor sanity)
This was just one of multiple modes of assessment (quizzes, exams, group work, projects, homework, …)<br>
20
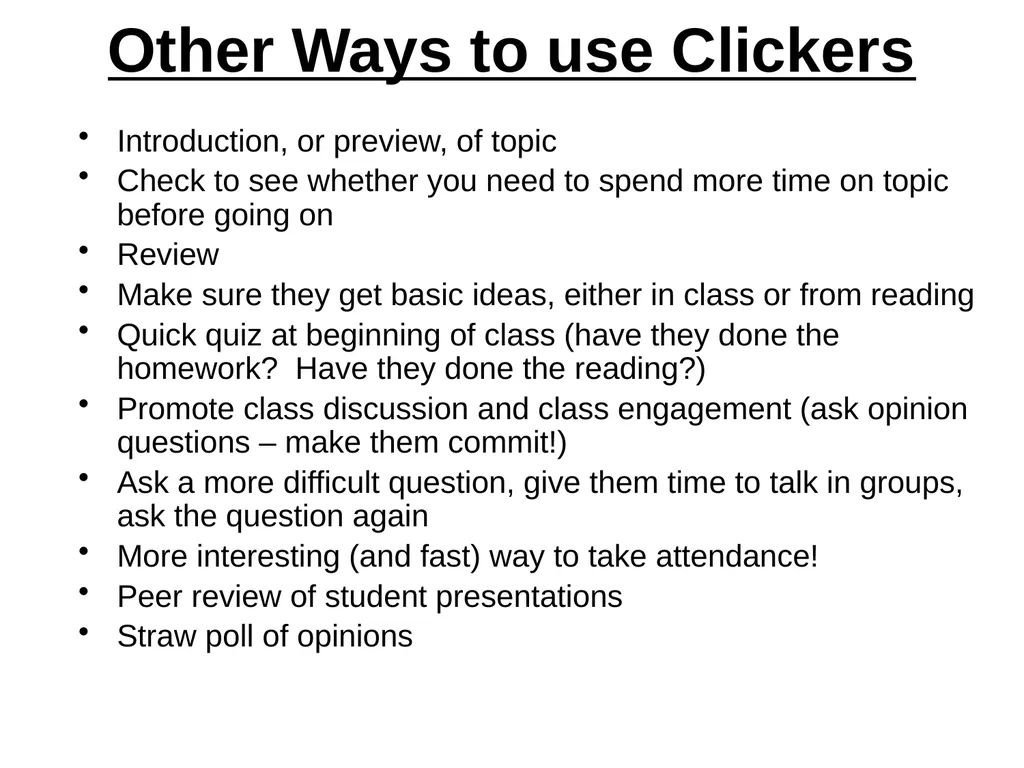
Other Ways to use Clickers Introduction, or preview, of topic
Check to see whether you need to spend more time on topic before going on
Review
Make sure they get basic ideas, either in class or from reading
Quick quiz at beginning of class (have they done the homework? Have they done the reading?)
Promote class discussion and class engagement (ask opinion questions – make them commit!)
Ask a more difficult question, give them time to talk in groups, ask the question again
More interesting (and fast) way to take attendance!
Peer review of student presentations
Straw poll of opinions<br>
Check to see whether you need to spend more time on topic before going on
Review
Make sure they get basic ideas, either in class or from reading
Quick quiz at beginning of class (have they done the homework? Have they done the reading?)
Promote class discussion and class engagement (ask opinion questions – make them commit!)
Ask a more difficult question, give them time to talk in groups, ask the question again
More interesting (and fast) way to take attendance!
Peer review of student presentations
Straw poll of opinions<br>
21
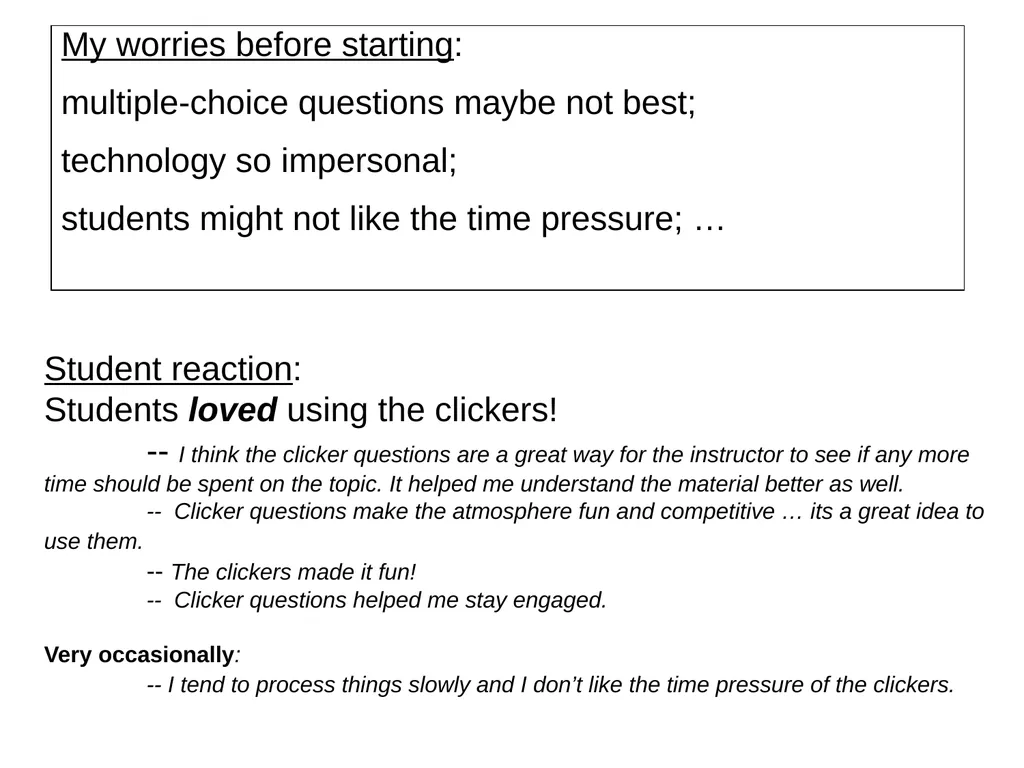
My worries before starting:
multiple-choice questions maybe not best;
technology so impersonal;
students might not like the time pressure; … Student reaction:
Students loved using the clickers!
-- I think the clicker questions are a great way for the instructor to see if any more time should be spent on the topic. It helped me understand the material better as well.
-- Clicker questions make the atmosphere fun and competitive … its a great idea to use them.
-- The clickers made it fun!
-- Clicker questions helped me stay engaged.
Very occasionally:
-- I tend to process things slowly and I don’t like the time pressure of the clickers.<br>
multiple-choice questions maybe not best;
technology so impersonal;
students might not like the time pressure; … Student reaction:
Students loved using the clickers!
-- I think the clicker questions are a great way for the instructor to see if any more time should be spent on the topic. It helped me understand the material better as well.
-- Clicker questions make the atmosphere fun and competitive … its a great idea to use them.
-- The clickers made it fun!
-- Clicker questions helped me stay engaged.
Very occasionally:
-- I tend to process things slowly and I don’t like the time pressure of the clickers.<br>
22
Clickers were liked by:
loud students and quiet students
smart students and not-so-smart students
competitive students and not-at-all competitive students<br>
loud students and quiet students
smart students and not-so-smart students
competitive students and not-at-all competitive students<br>
23
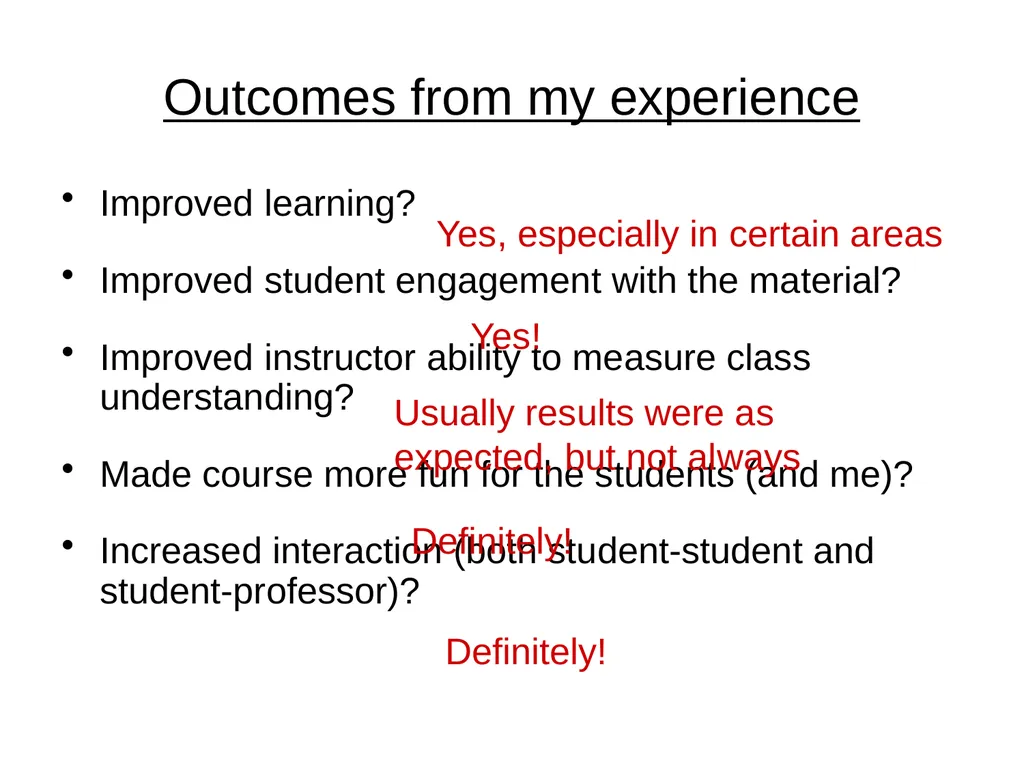
Outcomes from my experience Improved learning?
Improved student engagement with the material?
Improved instructor ability to measure class understanding?
Made course more fun for the students (and me)?
Increased interaction (both student-student and student-professor)? Yes, especially in certain areas Yes! Usually results were as expected, but not always Definitely! Definitely!<br>
Improved student engagement with the material?
Improved instructor ability to measure class understanding?
Made course more fun for the students (and me)?
Increased interaction (both student-student and student-professor)? Yes, especially in certain areas Yes! Usually results were as expected, but not always Definitely! Definitely!<br>
24
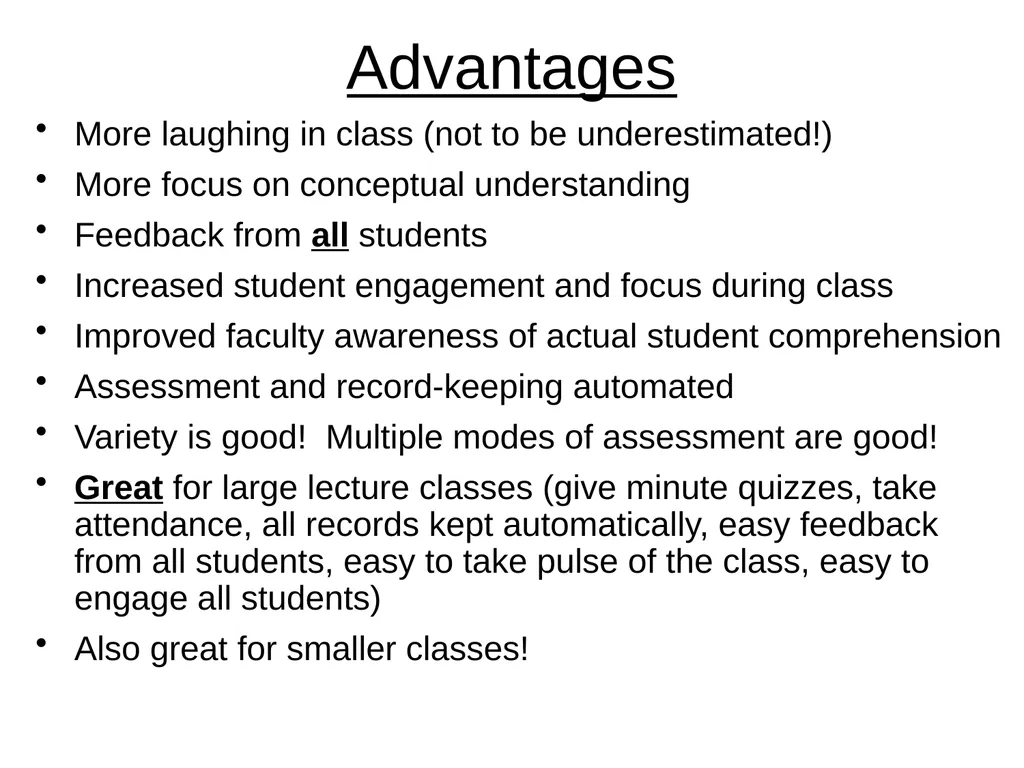
Advantages More laughing in class (not to be underestimated!)
More focus on conceptual understanding
Feedback from all students
Increased student engagement and focus during class
Improved faculty awareness of actual student comprehension
Assessment and record-keeping automated
Variety is good! Multiple modes of assessment are good!
Great for large lecture classes (give minute quizzes, take attendance, all records kept automatically, easy feedback from all students, easy to take pulse of the class, easy to engage all students)
Also great for smaller classes!<br>
More focus on conceptual understanding
Feedback from all students
Increased student engagement and focus during class
Improved faculty awareness of actual student comprehension
Assessment and record-keeping automated
Variety is good! Multiple modes of assessment are good!
Great for large lecture classes (give minute quizzes, take attendance, all records kept automatically, easy feedback from all students, easy to take pulse of the class, easy to engage all students)
Also great for smaller classes!<br>
25
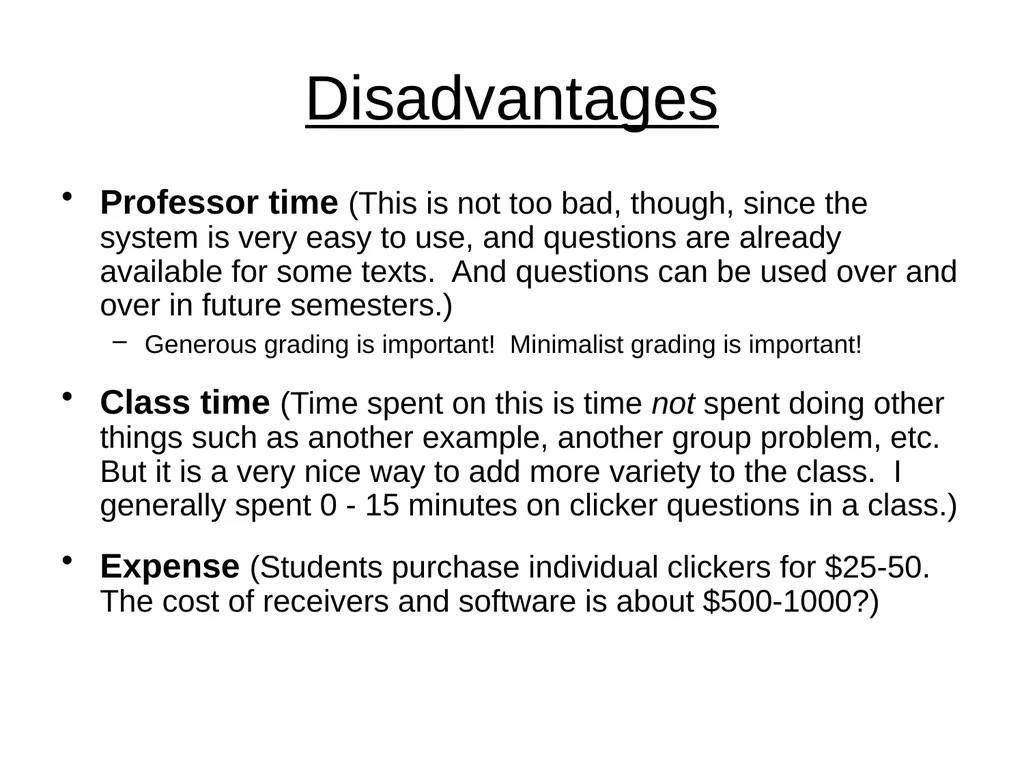
Disadvantages Professor time (This is not too bad, though, since the system is very easy to use, and questions are already available for some texts. And questions can be used over and over in future semesters.)
Generous grading is important! Minimalist grading is important!
Class time (Time spent on this is time not spent doing other things such as another example, another group problem, etc. But it is a very nice way to add more variety to the class. I generally spent 0 - 15 minutes on clicker questions in a class.)
Expense (Students purchase individual clickers for $25-50. The cost of receivers and software is about $500-1000?)<br>
Generous grading is important! Minimalist grading is important!
Class time (Time spent on this is time not spent doing other things such as another example, another group problem, etc. But it is a very nice way to add more variety to the class. I generally spent 0 - 15 minutes on clicker questions in a class.)
Expense (Students purchase individual clickers for $25-50. The cost of receivers and software is about $500-1000?)<br>
26
Biggest advantage: Clickers provide an additional way to keep all students active, thinking, and engaged throughout class.<br>
27
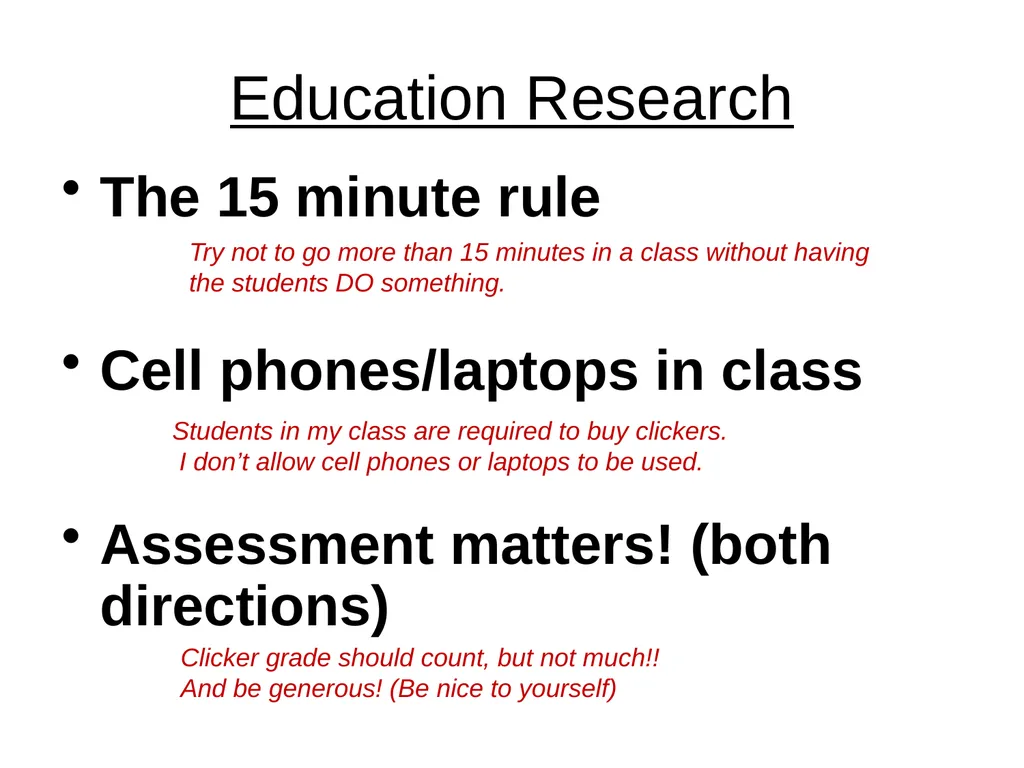
Education Research The 15 minute rule
Cell phones/laptops in class
Assessment matters! (both directions) Students in my class are required to buy clickers. I don’t allow cell phones or laptops to be used. Try not to go more than 15 minutes in a class without having the students DO something. Clicker grade should count, but not much!! And be generous! (Be nice to yourself)<br>
Cell phones/laptops in class
Assessment matters! (both directions) Students in my class are required to buy clickers. I don’t allow cell phones or laptops to be used. Try not to go more than 15 minutes in a class without having the students DO something. Clicker grade should count, but not much!! And be generous! (Be nice to yourself)<br>
28
These clicker questions for Calculus come primarily from ConcepTests available for Calculus, Multivariable Calculus, Applied Calculus, and Functions Modeling Change by Hughes-Hallett, McCallum, Connally, et.al. Available online as PowerPoint slides ready to go from John Wiley and Sons. Disclaimer: I am an author on these texts and on the ConcepTest supplements.
(That’s how I got into the clicker business.) For Calculus and Precalculus:<br>
(That’s how I got into the clicker business.) For Calculus and Precalculus:<br>
29
iClicker<br>
30
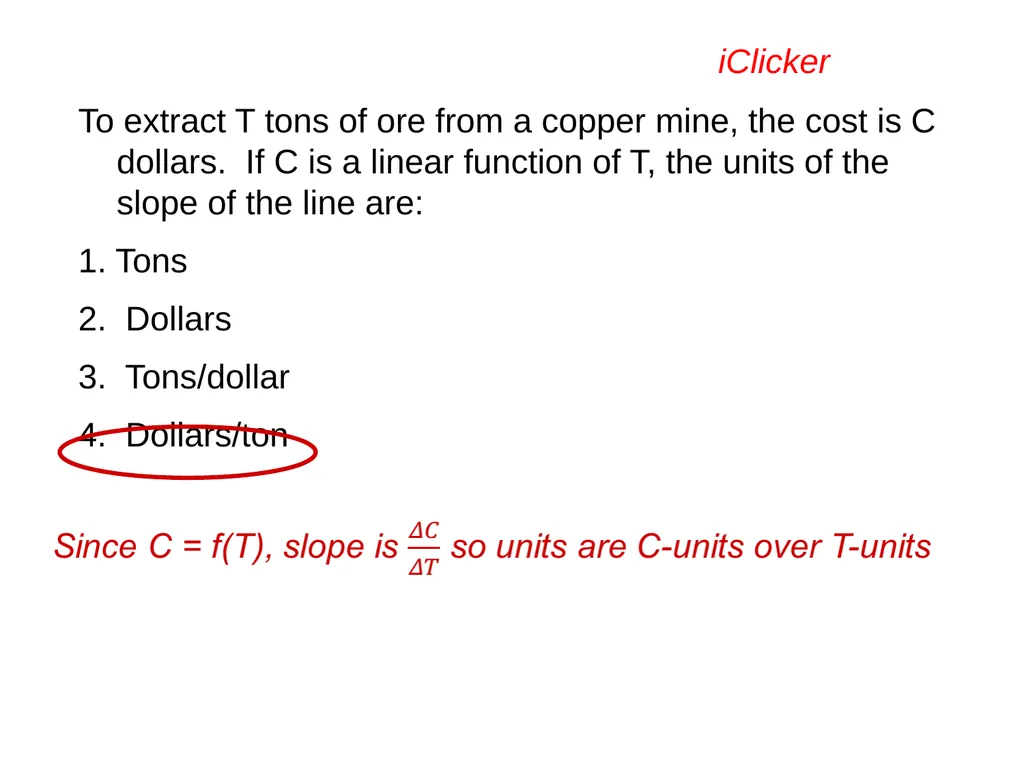
To extract T tons of ore from a copper mine, the cost is C dollars. If C is a linear function of T, the units of the slope of the line are:
1. Tons
2. Dollars
3. Tons/dollar
4. Dollars/ton iClicker<br>
1. Tons
2. Dollars
3. Tons/dollar
4. Dollars/ton iClicker<br>
31
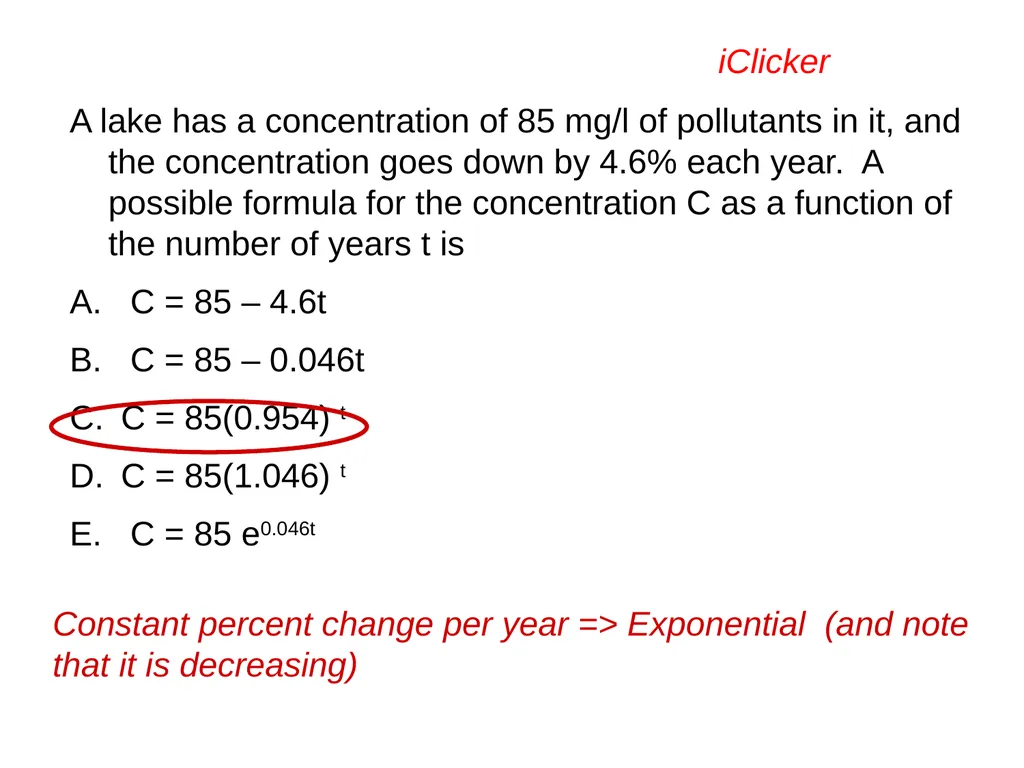
A lake has a concentration of 85 mg/l of pollutants in it, and the concentration goes down by 4.6% each year. A possible formula for the concentration C as a function of the number of years t is
A. C = 85 – 4.6t
B. C = 85 – 0.046t
C = 85(0.954) t
C = 85(1.046) t
E. C = 85 e0.046t iClicker Constant percent change per year => Exponential (and note that it is decreasing)<br>
A. C = 85 – 4.6t
B. C = 85 – 0.046t
C = 85(0.954) t
C = 85(1.046) t
E. C = 85 e0.046t iClicker Constant percent change per year => Exponential (and note that it is decreasing)<br>
32
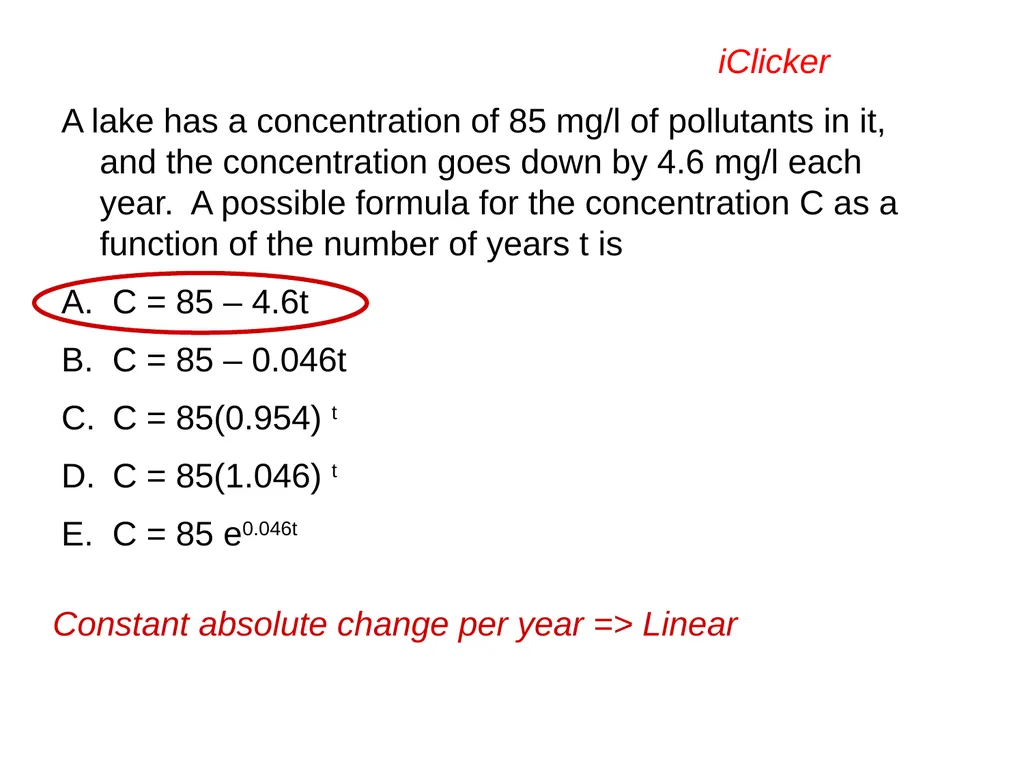
A lake has a concentration of 85 mg/l of pollutants in it, and the concentration goes down by 4.6 mg/l each year. A possible formula for the concentration C as a function of the number of years t is
A. C = 85 – 4.6t
B. C = 85 – 0.046t
C = 85(0.954) t
C = 85(1.046) t
E. C = 85 e0.046t iClicker Constant absolute change per year => Linear<br>
A. C = 85 – 4.6t
B. C = 85 – 0.046t
C = 85(0.954) t
C = 85(1.046) t
E. C = 85 e0.046t iClicker Constant absolute change per year => Linear<br>
33
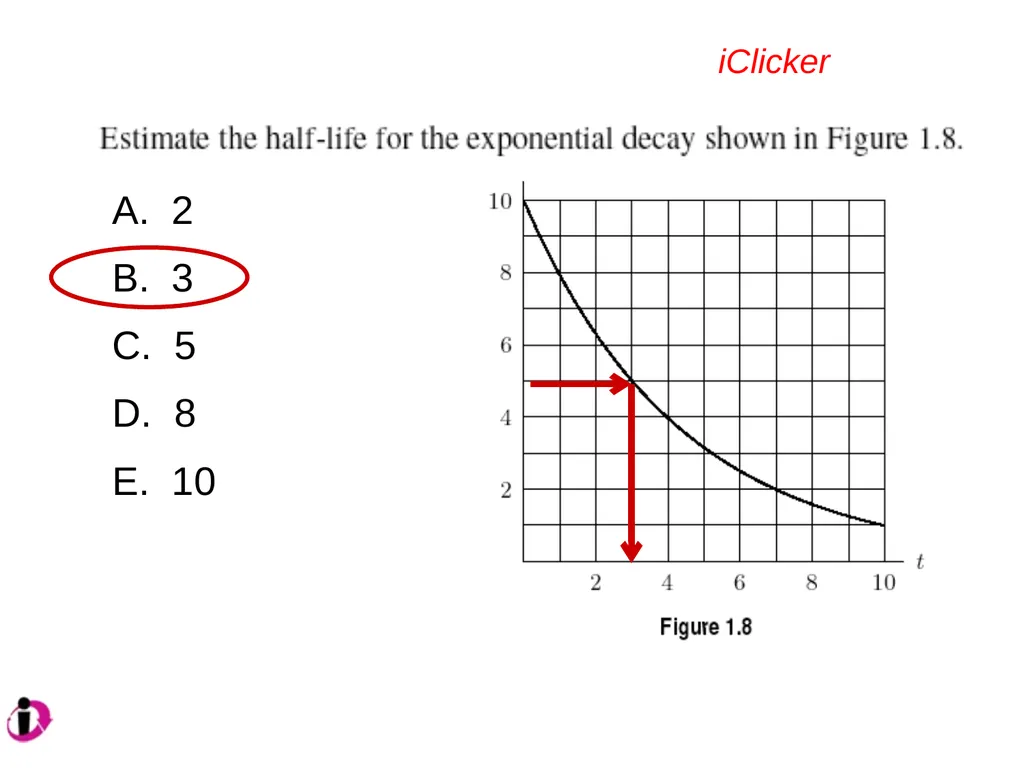
A. 2
B. 3
C. 5
D. 8
E. 10 iClicker<br>
B. 3
C. 5
D. 8
E. 10 iClicker<br>
34
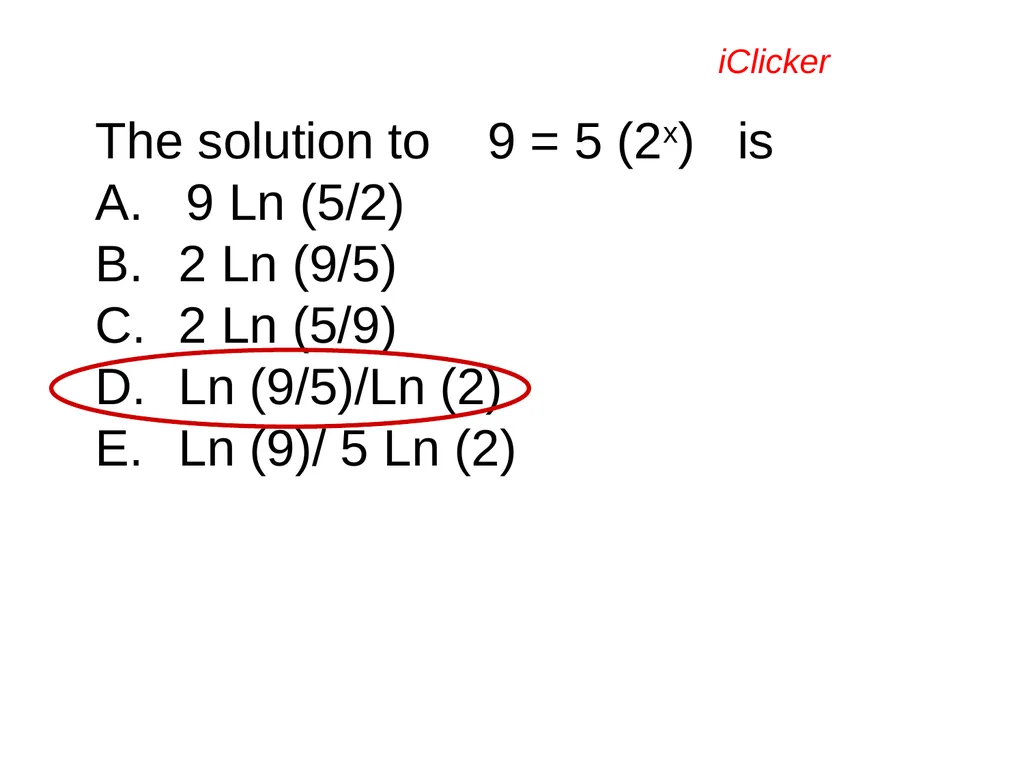
The solution to 9 = 5 (2x) is
A. 9 Ln (5/2)
2 Ln (9/5)
2 Ln (5/9)
Ln (9/5)/Ln (2)
Ln (9)/ 5 Ln (2) iClicker<br>
A. 9 Ln (5/2)
2 Ln (9/5)
2 Ln (5/9)
Ln (9/5)/Ln (2)
Ln (9)/ 5 Ln (2) iClicker<br>
35
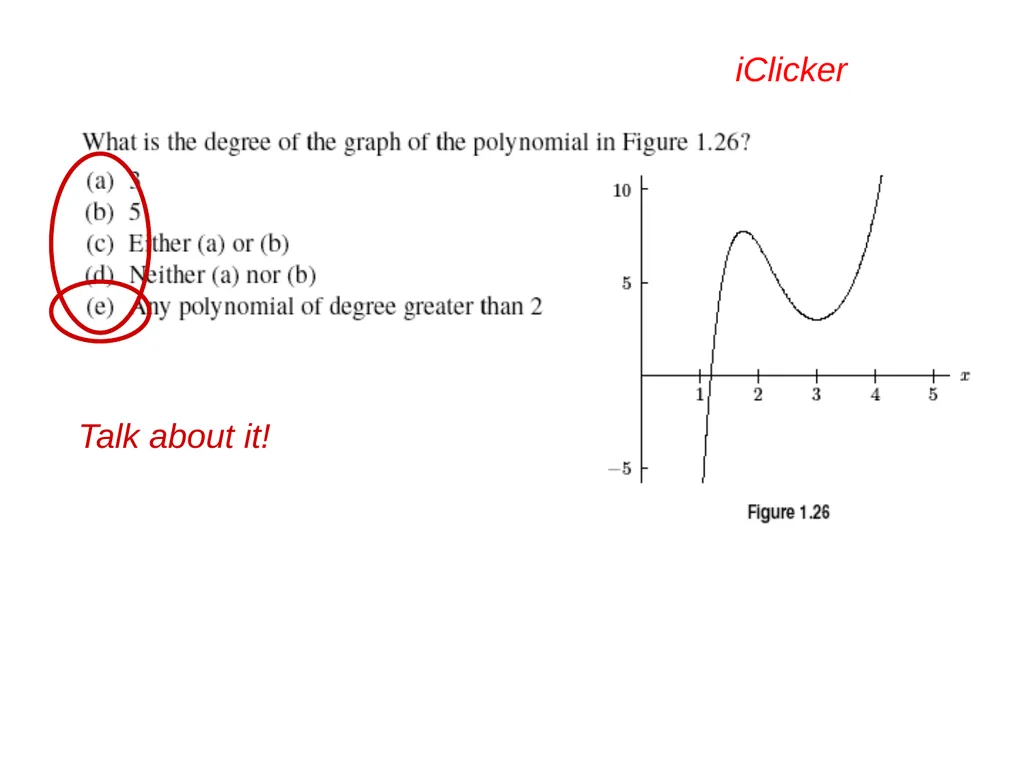
iClicker Talk about it!<br>
36
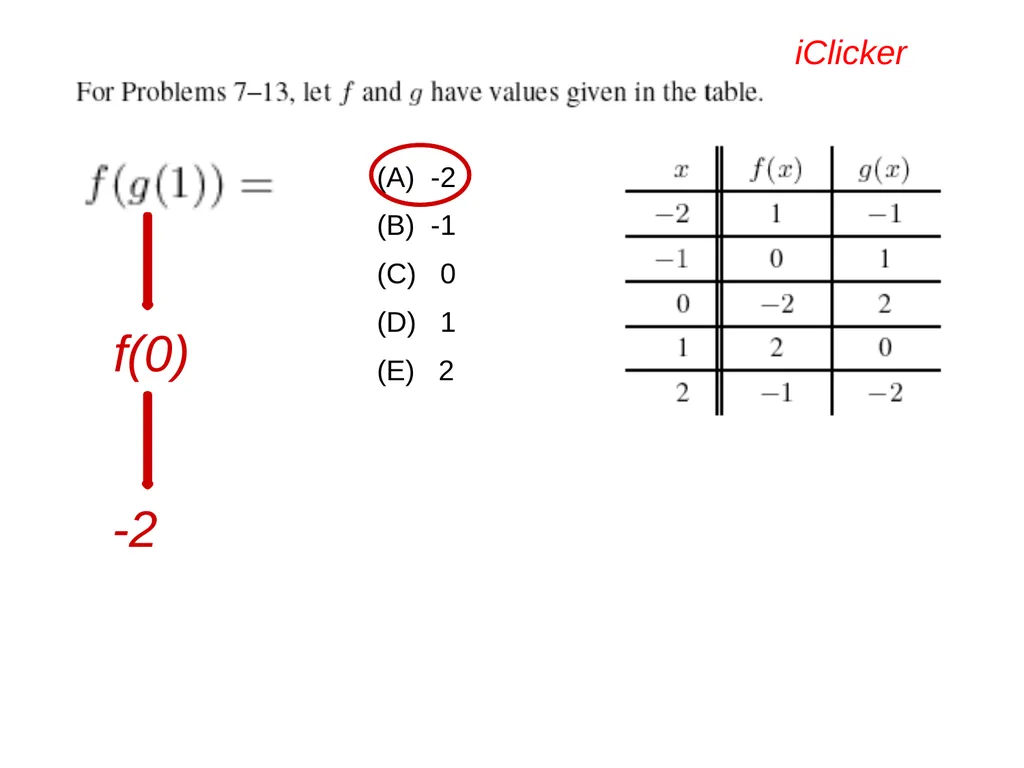
(A) -2
(B) -1
(C) 0
(D) 1
(E) 2 iClicker f(0) -2<br>
(B) -1
(C) 0
(D) 1
(E) 2 iClicker f(0) -2<br>
37
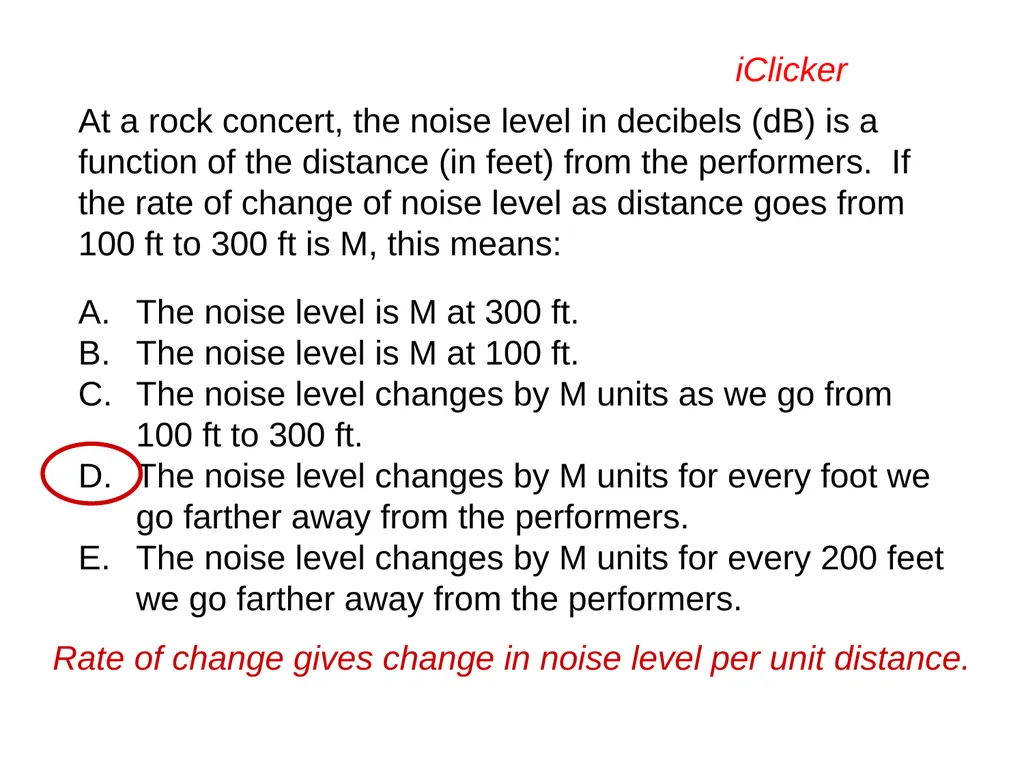
iClicker At a rock concert, the noise level in decibels (dB) is a function of the distance (in feet) from the performers. If the rate of change of noise level as distance goes from 100 ft to 300 ft is M, this means:
The noise level is M at 300 ft.
The noise level is M at 100 ft.
The noise level changes by M units as we go from 100 ft to 300 ft.
The noise level changes by M units for every foot we go farther away from the performers.
The noise level changes by M units for every 200 feet we go farther away from the performers. Rate of change gives change in noise level per unit distance.<br>
The noise level is M at 300 ft.
The noise level is M at 100 ft.
The noise level changes by M units as we go from 100 ft to 300 ft.
The noise level changes by M units for every foot we go farther away from the performers.
The noise level changes by M units for every 200 feet we go farther away from the performers. Rate of change gives change in noise level per unit distance.<br>
38
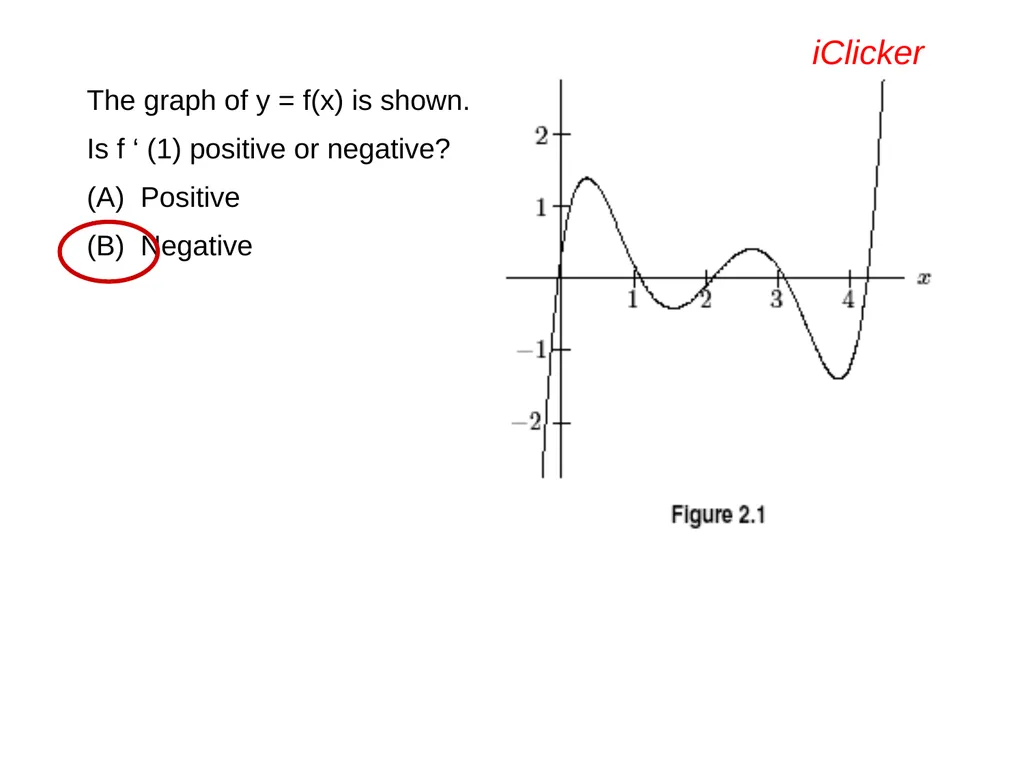
The graph of y = f(x) is shown.
Is f ‘ (1) positive or negative?
(A) Positive
(B) Negative iClicker<br>
Is f ‘ (1) positive or negative?
(A) Positive
(B) Negative iClicker<br>
39
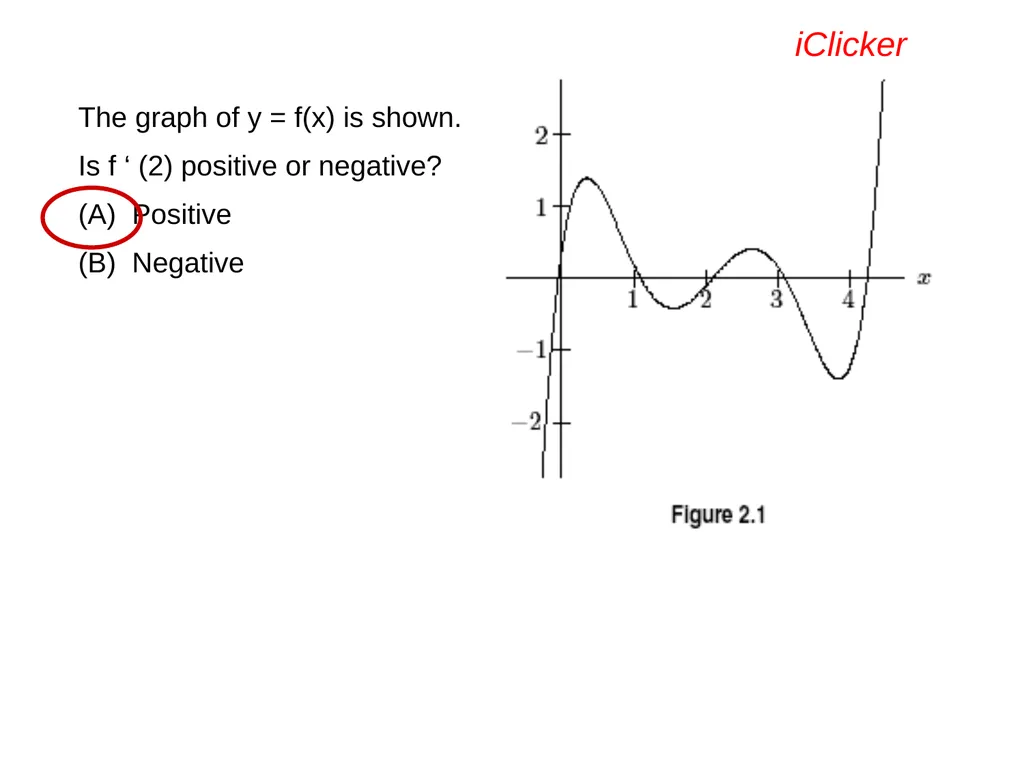
The graph of y = f(x) is shown.
Is f ‘ (2) positive or negative?
(A) Positive
(B) Negative iClicker<br>
Is f ‘ (2) positive or negative?
(A) Positive
(B) Negative iClicker<br>
40
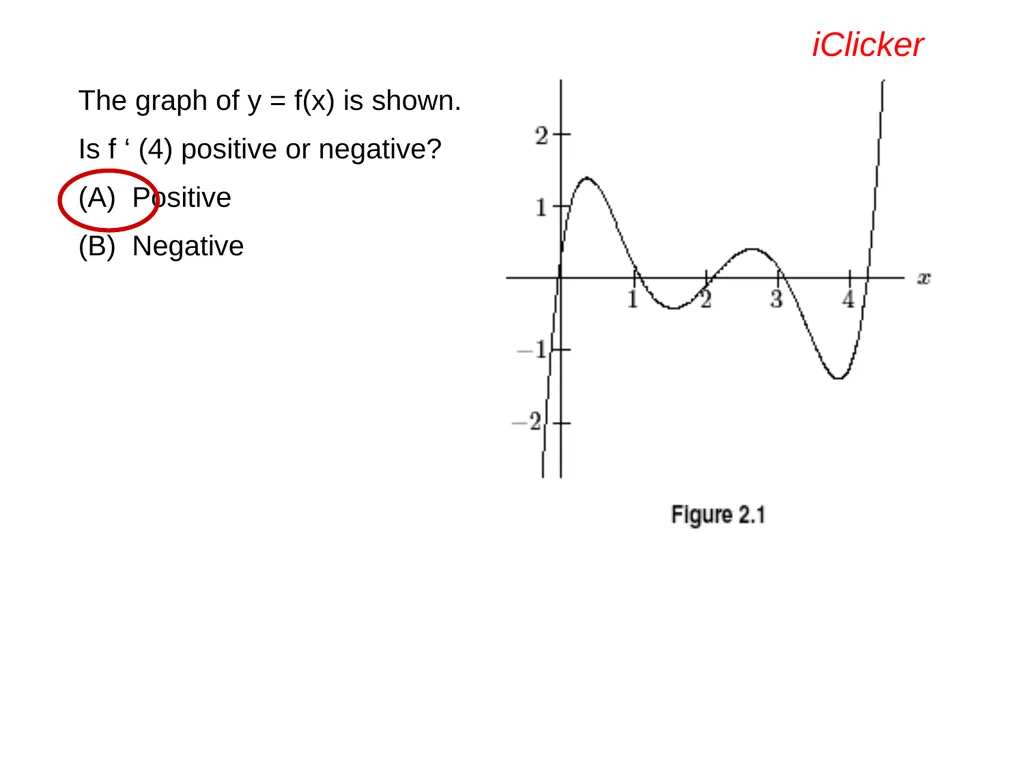
The graph of y = f(x) is shown.
Is f ‘ (4) positive or negative?
(A) Positive
(B) Negative iClicker<br>
Is f ‘ (4) positive or negative?
(A) Positive
(B) Negative iClicker<br>
41
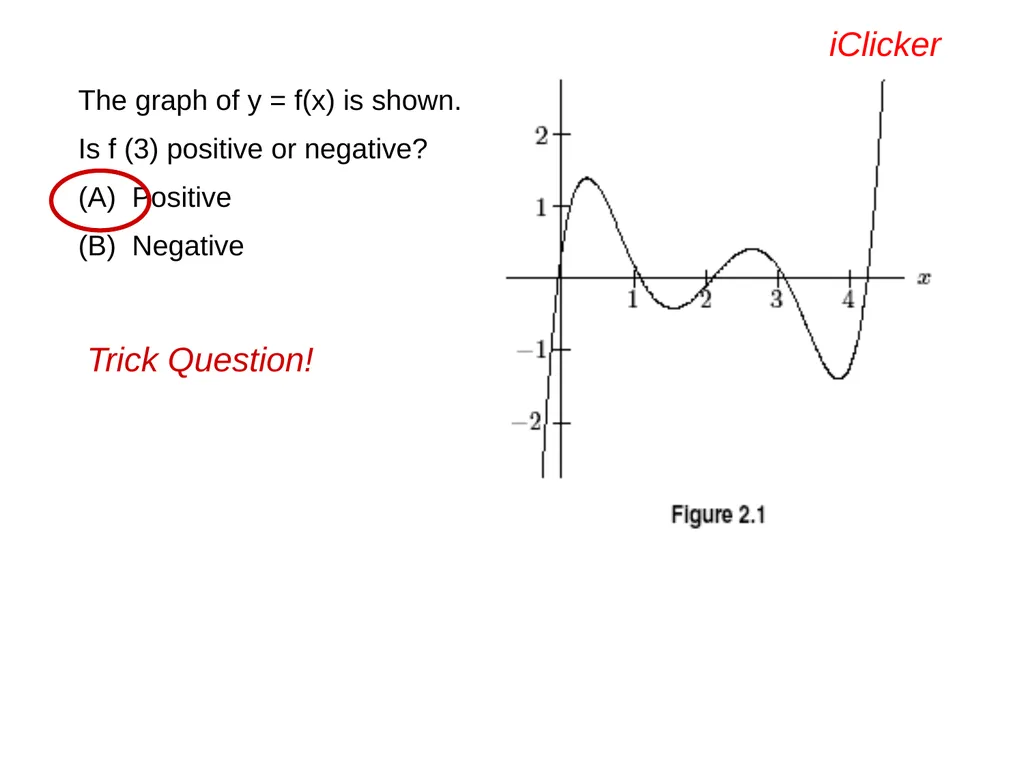
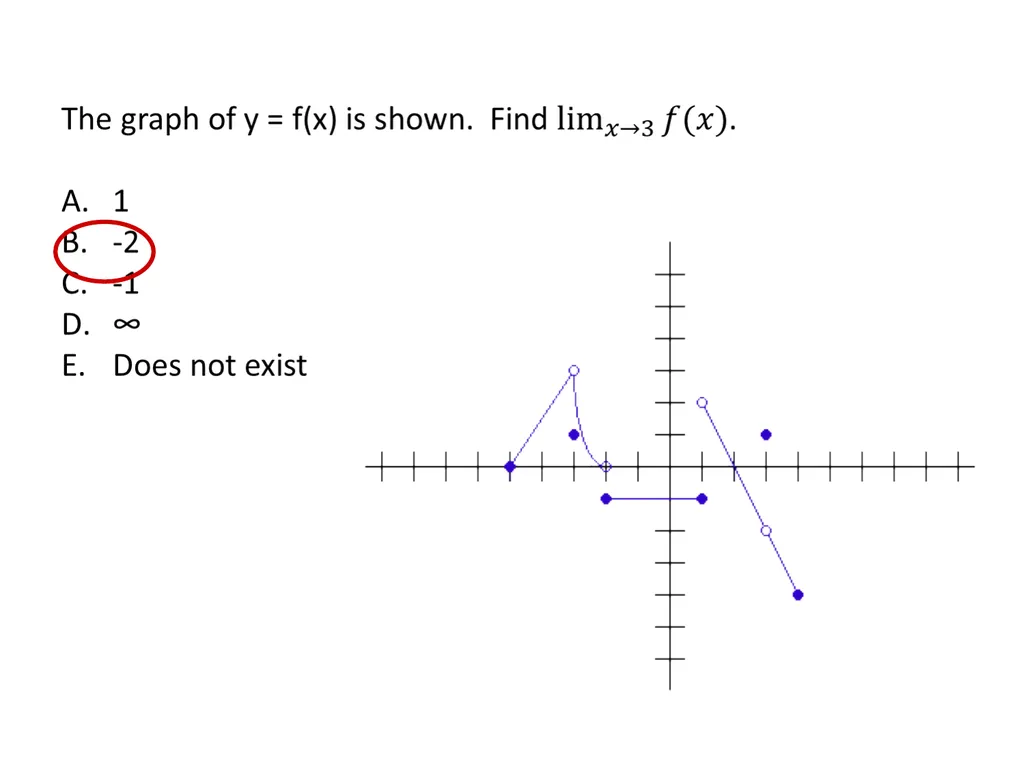
The graph of y = f(x) is shown.
Is f (3) positive or negative?
(A) Positive
(B) Negative iClicker Trick Question!<br>
Is f (3) positive or negative?
(A) Positive
(B) Negative iClicker Trick Question!<br>
42
iClicker Q represents the quantity of tar in gallons in a sink hole at time t days. We have Q=f(t). Also
f(30) = 27 and f (30) = 15.
The units of 30 are:
Gallons
Days
Gallons/Day
Days/Gallon
Gallons per 30 days f(t) = Q
f(time in days) = quantity in gallons
f(30) = 27<br>
f(30) = 27 and f (30) = 15.
The units of 30 are:
Gallons
Days
Gallons/Day
Days/Gallon
Gallons per 30 days f(t) = Q
f(time in days) = quantity in gallons
f(30) = 27<br>
43
iClicker Q represents the quantity of tar in gallons in a sink hole at time t days. We have Q=f(t). Also
f(30) = 27 and f (30) = 15.
The units of 27 are:
Gallons
Days
Gallons/Day
Days/Gallon
Gallons per 30 days f(t) = Q
f(time in days) = quantity in gallons
f(30) = 27<br>
f(30) = 27 and f (30) = 15.
The units of 27 are:
Gallons
Days
Gallons/Day
Days/Gallon
Gallons per 30 days f(t) = Q
f(time in days) = quantity in gallons
f(30) = 27<br>
44
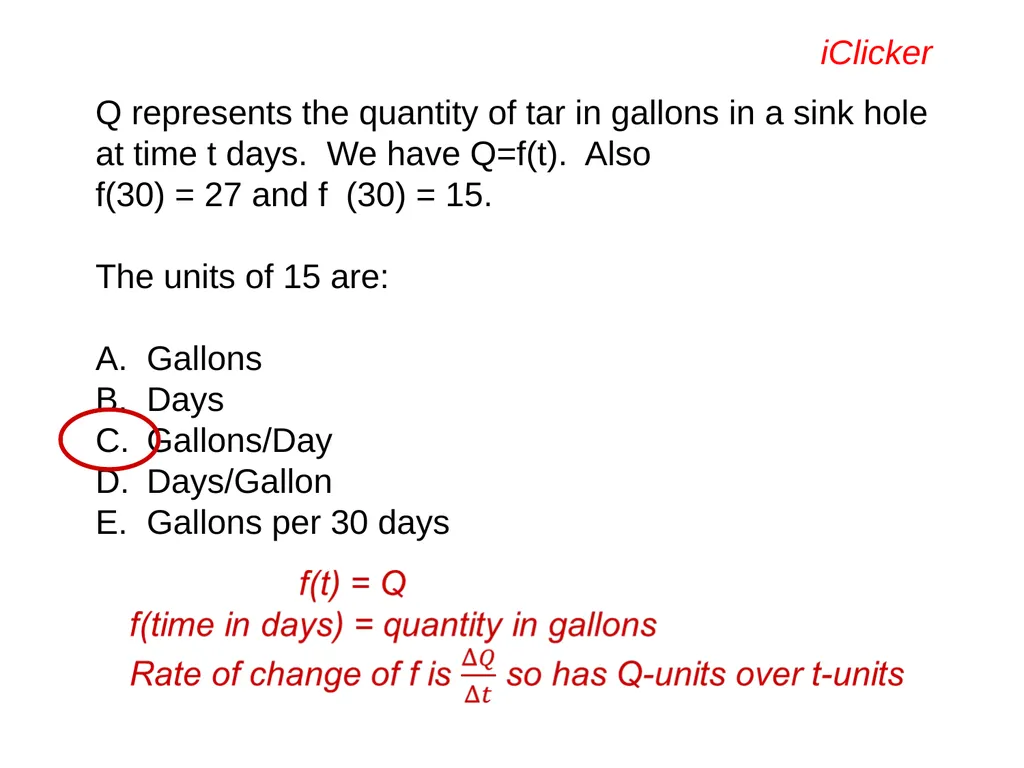
iClicker Q represents the quantity of tar in gallons in a sink hole at time t days. We have Q=f(t). Also
f(30) = 27 and f (30) = 15.
The units of 15 are:
Gallons
Days
Gallons/Day
Days/Gallon
Gallons per 30 days<br>
f(30) = 27 and f (30) = 15.
The units of 15 are:
Gallons
Days
Gallons/Day
Days/Gallon
Gallons per 30 days<br>
45
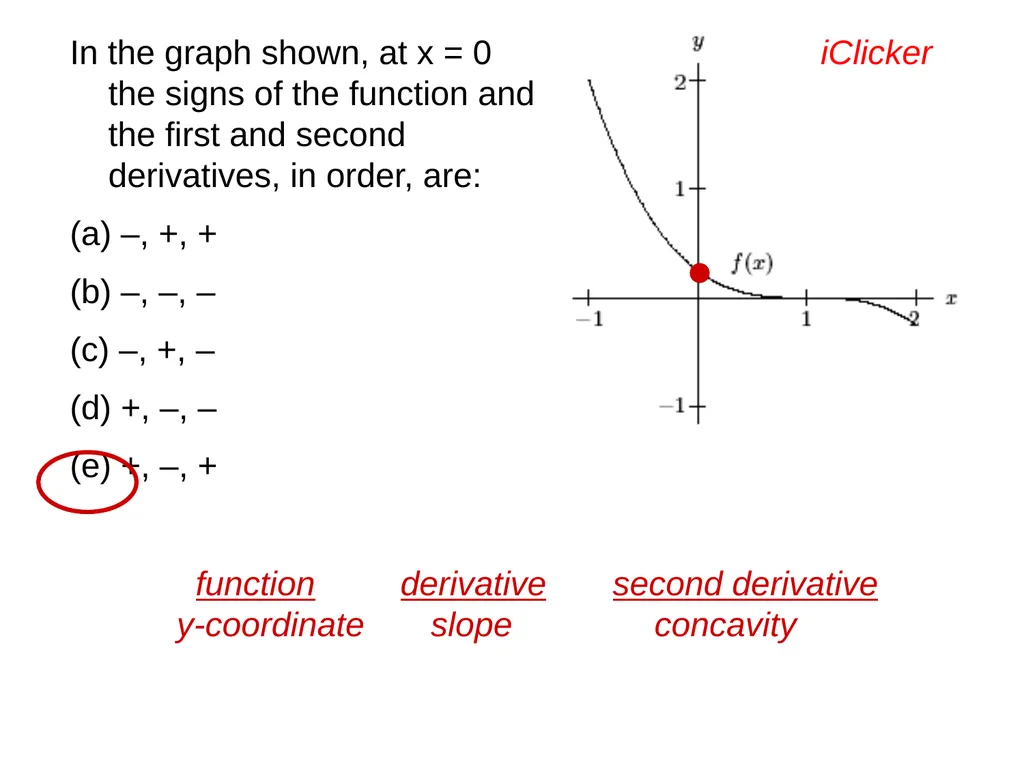
In the graph shown, at x = 0 the signs of the function and the first and second derivatives, in order, are:
–, +, +
–, –, –
(c) –, +, –
(d) +, –, –
(e) +, –, + iClicker function derivative second derivative
y-coordinate slope concavity<br>
–, +, +
–, –, –
(c) –, +, –
(d) +, –, –
(e) +, –, + iClicker function derivative second derivative
y-coordinate slope concavity<br>
46
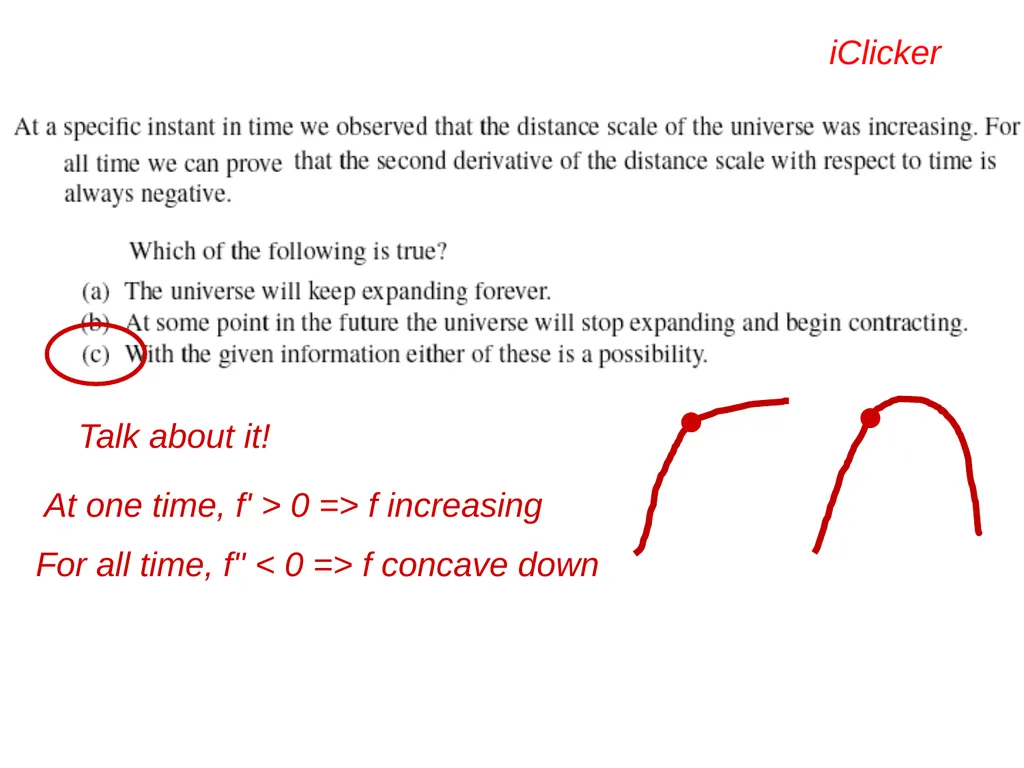
iClicker Talk about it! At one time, f' > 0 => f increasing For all time, f'' < 0 => f concave down<br>
47
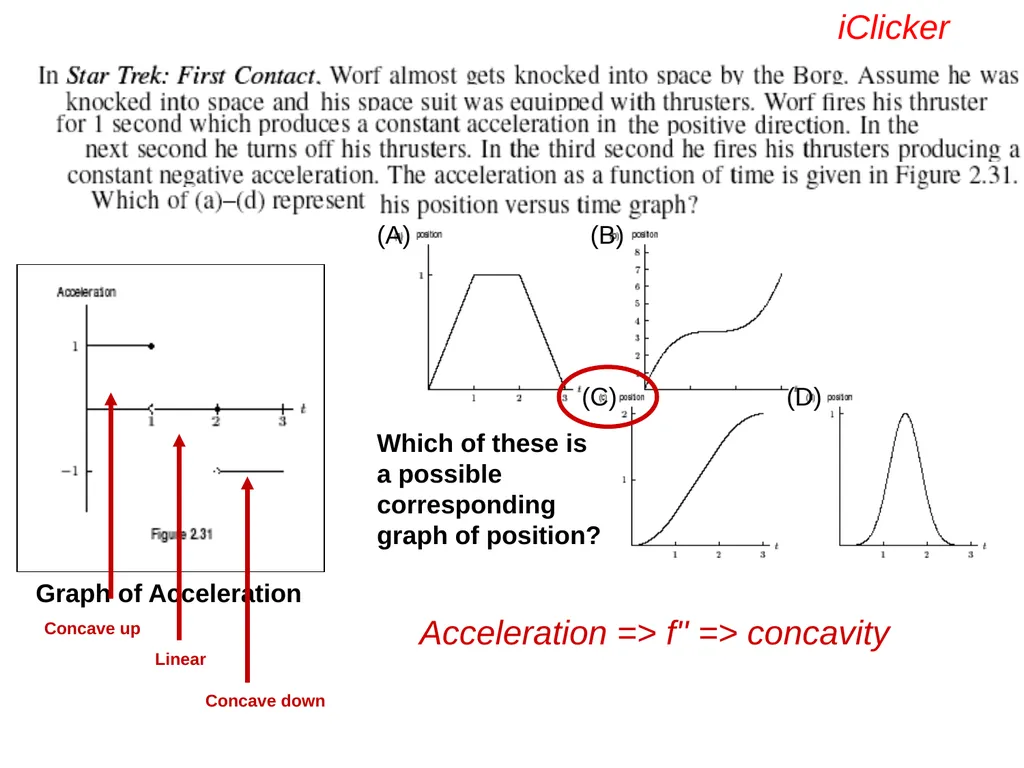
iClicker Which of these is a possible corresponding graph of position? Graph of Acceleration (A) (B) (C) (D) Acceleration => f'' => concavity Concave up Linear Concave down<br>
48
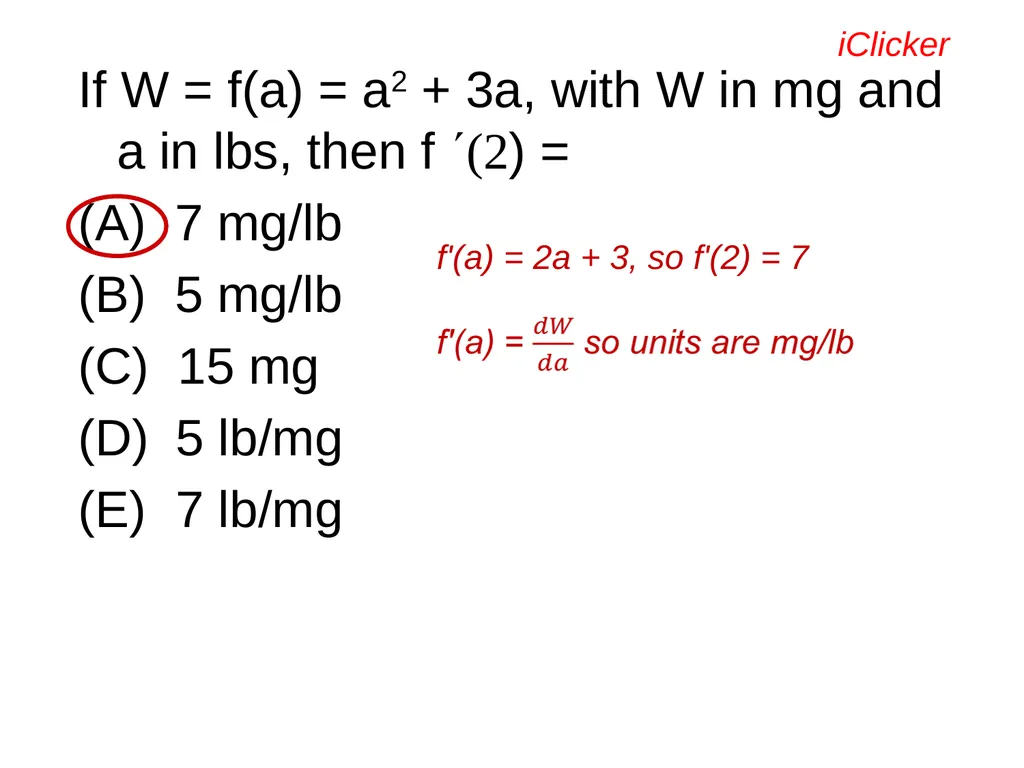
If W = f(a) = a2 + 3a, with W in mg and a in lbs, then f (2) =
(A) 7 mg/lb
(B) 5 mg/lb
(C) 15 mg
5 lb/mg
7 lb/mg iClicker f'(a) = 2a + 3, so f'(2) = 7<br>
(A) 7 mg/lb
(B) 5 mg/lb
(C) 15 mg
5 lb/mg
7 lb/mg iClicker f'(a) = 2a + 3, so f'(2) = 7<br>
49
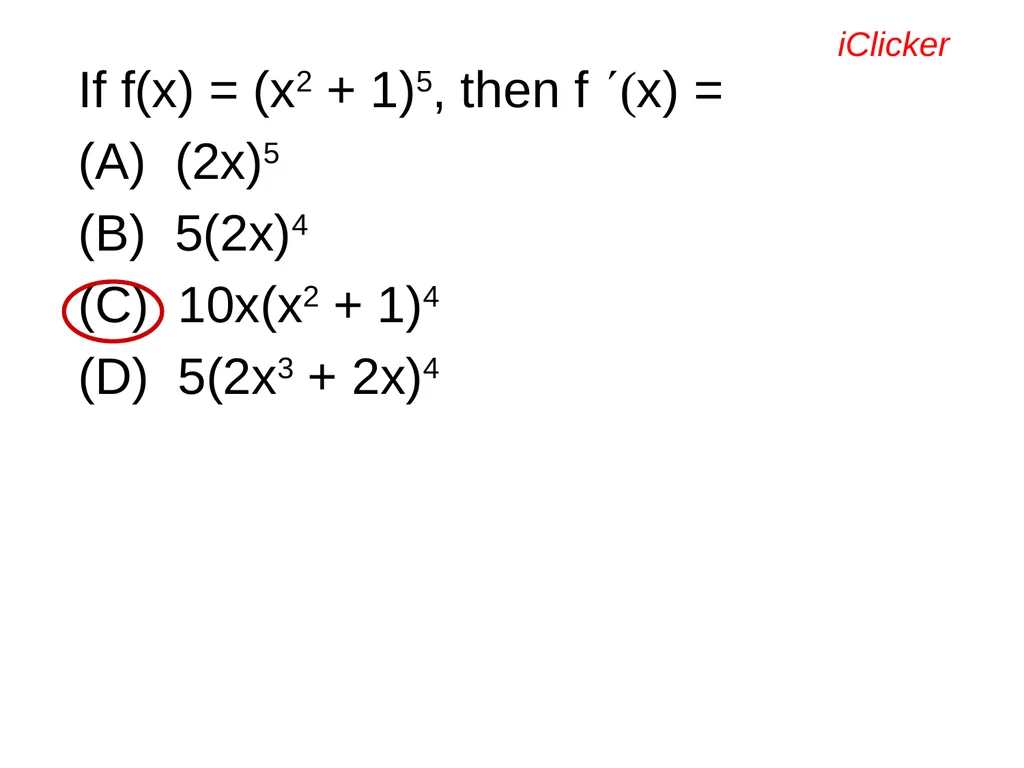
If f(x) = (x2 + 1)5, then f (x) =
(A) (2x)5
(B) 5(2x)4
(C) 10x(x2 + 1)4
(D) 5(2x3 + 2x)4 iClicker<br>
(A) (2x)5
(B) 5(2x)4
(C) 10x(x2 + 1)4
(D) 5(2x3 + 2x)4 iClicker<br>
50
iClicker<br>
51
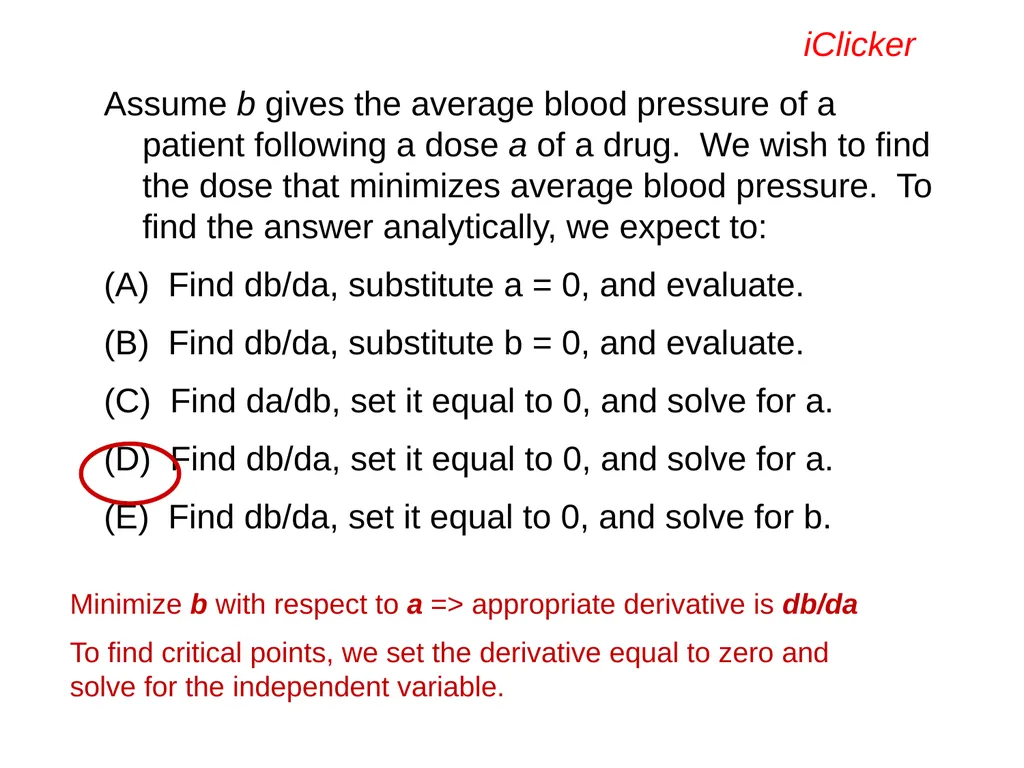
Assume b gives the average blood pressure of a patient following a dose a of a drug. We wish to find the dose that minimizes average blood pressure. To find the answer analytically, we expect to:
(A) Find db/da, substitute a = 0, and evaluate.
(B) Find db/da, substitute b = 0, and evaluate.
(C) Find da/db, set it equal to 0, and solve for a.
(D) Find db/da, set it equal to 0, and solve for a.
(E) Find db/da, set it equal to 0, and solve for b. iClicker Minimize b with respect to a => appropriate derivative is db/da To find critical points, we set the derivative equal to zero and solve for the independent variable.<br>
(A) Find db/da, substitute a = 0, and evaluate.
(B) Find db/da, substitute b = 0, and evaluate.
(C) Find da/db, set it equal to 0, and solve for a.
(D) Find db/da, set it equal to 0, and solve for a.
(E) Find db/da, set it equal to 0, and solve for b. iClicker Minimize b with respect to a => appropriate derivative is db/da To find critical points, we set the derivative equal to zero and solve for the independent variable.<br>
52
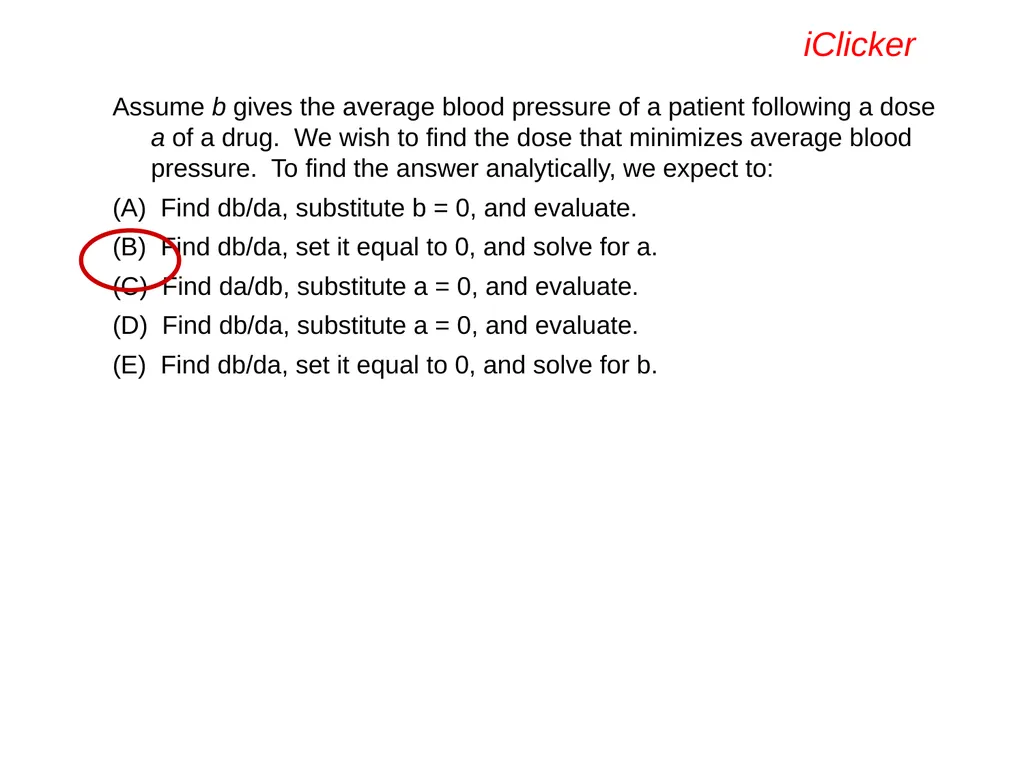
Assume b gives the average blood pressure of a patient following a dose a of a drug. We wish to find the dose that minimizes average blood pressure. To find the answer analytically, we expect to:
(A) Find db/da, substitute b = 0, and evaluate.
(B) Find db/da, set it equal to 0, and solve for a.
(C) Find da/db, substitute a = 0, and evaluate.
(D) Find db/da, substitute a = 0, and evaluate.
(E) Find db/da, set it equal to 0, and solve for b. iClicker<br>
(A) Find db/da, substitute b = 0, and evaluate.
(B) Find db/da, set it equal to 0, and solve for a.
(C) Find da/db, substitute a = 0, and evaluate.
(D) Find db/da, substitute a = 0, and evaluate.
(E) Find db/da, set it equal to 0, and solve for b. iClicker<br>
53
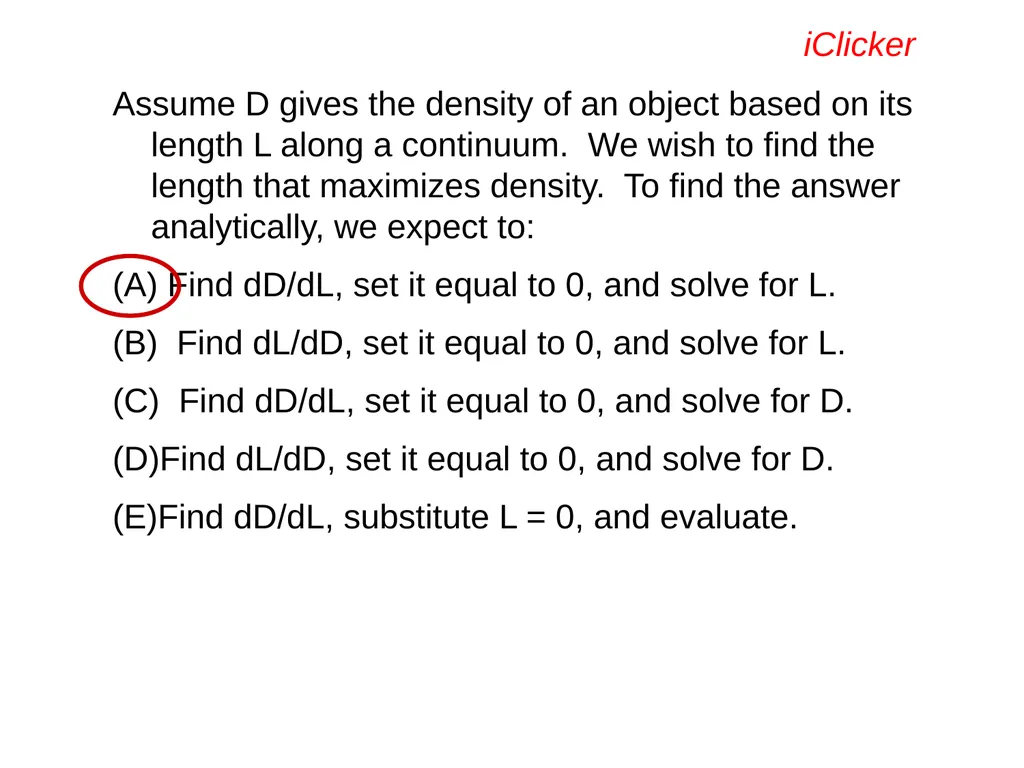
Assume D gives the density of an object based on its length L along a continuum. We wish to find the length that maximizes density. To find the answer analytically, we expect to:
(A) Find dD/dL, set it equal to 0, and solve for L.
(B) Find dL/dD, set it equal to 0, and solve for L.
(C) Find dD/dL, set it equal to 0, and solve for D.
Find dL/dD, set it equal to 0, and solve for D.
Find dD/dL, substitute L = 0, and evaluate. iClicker<br>
(A) Find dD/dL, set it equal to 0, and solve for L.
(B) Find dL/dD, set it equal to 0, and solve for L.
(C) Find dD/dL, set it equal to 0, and solve for D.
Find dL/dD, set it equal to 0, and solve for D.
Find dD/dL, substitute L = 0, and evaluate. iClicker<br>
54
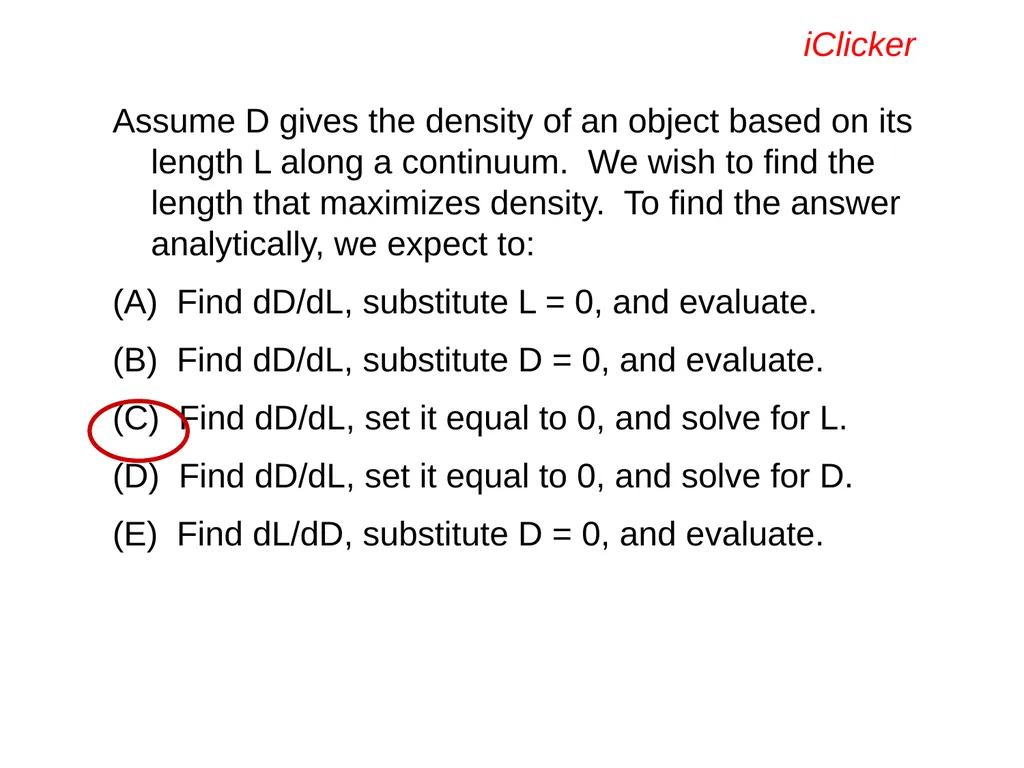
Assume D gives the density of an object based on its length L along a continuum. We wish to find the length that maximizes density. To find the answer analytically, we expect to:
(A) Find dD/dL, substitute L = 0, and evaluate.
(B) Find dD/dL, substitute D = 0, and evaluate.
(C) Find dD/dL, set it equal to 0, and solve for L.
(D) Find dD/dL, set it equal to 0, and solve for D.
(E) Find dL/dD, substitute D = 0, and evaluate. iClicker<br>
(A) Find dD/dL, substitute L = 0, and evaluate.
(B) Find dD/dL, substitute D = 0, and evaluate.
(C) Find dD/dL, set it equal to 0, and solve for L.
(D) Find dD/dL, set it equal to 0, and solve for D.
(E) Find dL/dD, substitute D = 0, and evaluate. iClicker<br>
55
If f(x) is measured in pounds and x is measured in feet, then is measured in:
(A) Feet
(B) Pounds/Foot
(C) Pounds
(D) Pounds times Feet iClicker f-units times x-units Pounds times Feet<br>
(A) Feet
(B) Pounds/Foot
(C) Pounds
(D) Pounds times Feet iClicker f-units times x-units Pounds times Feet<br>
56
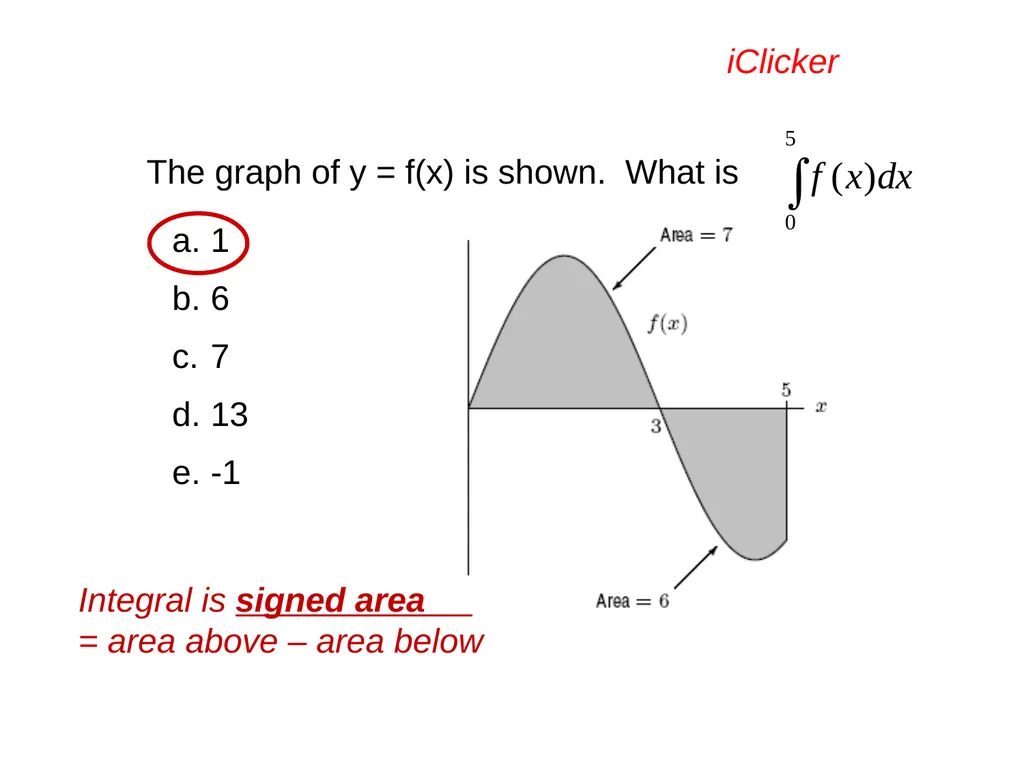
The graph of y = f(x) is shown. What is 1
6
7
13
-1 iClicker Integral is signed area = area above – area below<br>
6
7
13
-1 iClicker Integral is signed area = area above – area below<br>
57
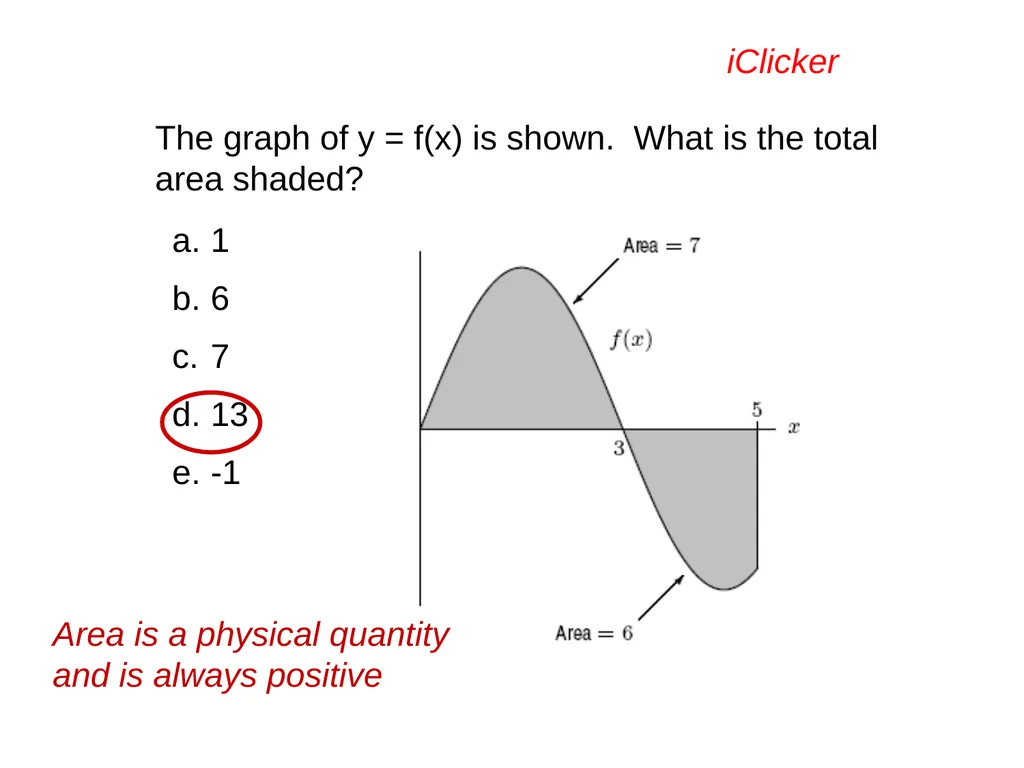
The graph of y = f(x) is shown. What is the total area shaded? 1
6
7
13
-1 iClicker Area is a physical quantity and is always positive<br>
6
7
13
-1 iClicker Area is a physical quantity and is always positive<br>
58
iClicker<br>
59
iClicker<br>
60
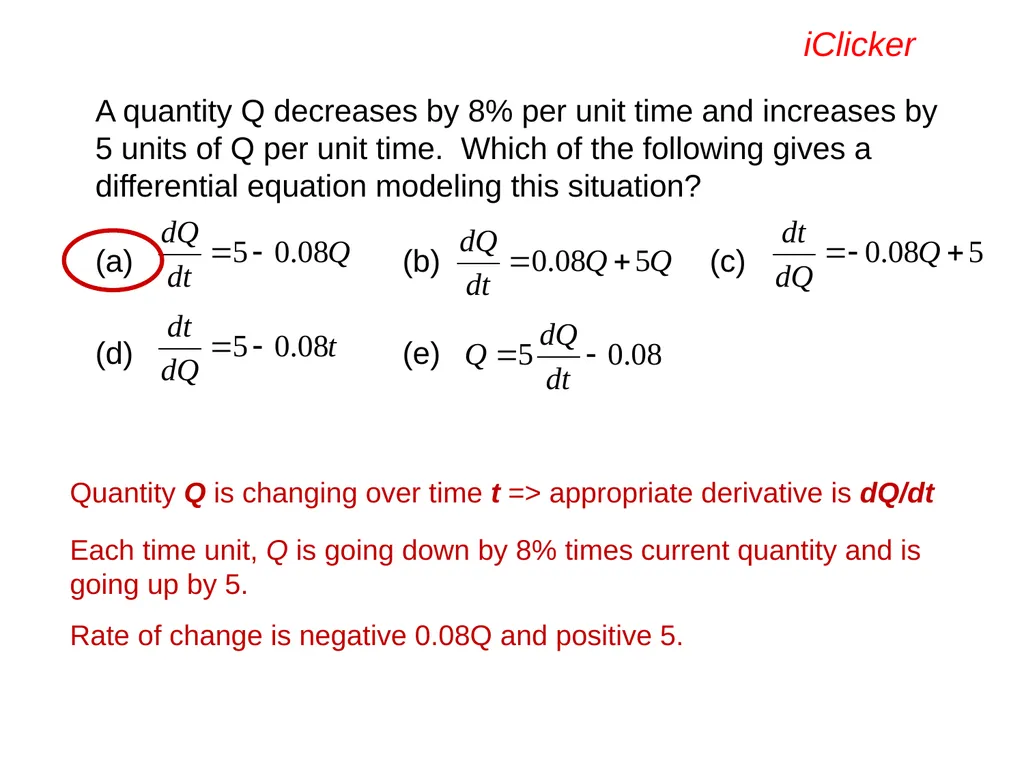
A quantity Q decreases by 8% per unit time and increases by 5 units of Q per unit time. Which of the following gives a differential equation modeling this situation?
(a) (b) (c)
(d) (e) iClicker Quantity Q is changing over time t => appropriate derivative is dQ/dt Each time unit, Q is going down by 8% times current quantity and is going up by 5. Rate of change is negative 0.08Q and positive 5.<br>
(a) (b) (c)
(d) (e) iClicker Quantity Q is changing over time t => appropriate derivative is dQ/dt Each time unit, Q is going down by 8% times current quantity and is going up by 5. Rate of change is negative 0.08Q and positive 5.<br>
61
Write some for Calculus?
Come up with some fast and easy ones! (To the student: Are you paying attention?)
And/or
Some thought-provoking ones.<br>
Come up with some fast and easy ones! (To the student: Are you paying attention?)
And/or
Some thought-provoking ones.<br>
62
These clicker questions for Intro Stats come from the Instructor Resources for Statistics: Unlocking the Power of Data by Lock, Lock, Lock, Lock, and Lock. Available online as PowerPoint slides ready to go from John Wiley and Sons. Disclaimer: I am an author on this text and on the Clicker question supplements. From Intro Stats:<br>
63
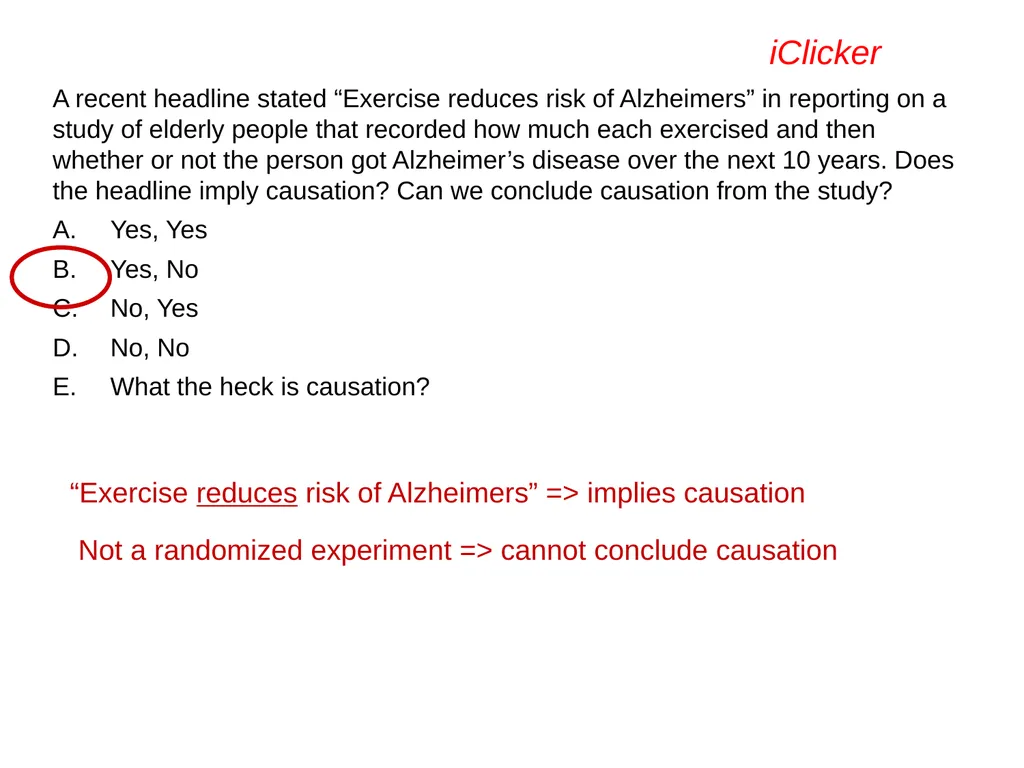
A recent headline stated “Exercise reduces risk of Alzheimers” in reporting on a study of elderly people that recorded how much each exercised and then whether or not the person got Alzheimer’s disease over the next 10 years. Does the headline imply causation? Can we conclude causation from the study?
Yes, Yes
Yes, No
No, Yes
No, No
What the heck is causation? iClicker “Exercise reduces risk of Alzheimers” => implies causation Not a randomized experiment => cannot conclude causation<br>
Yes, Yes
Yes, No
No, Yes
No, No
What the heck is causation? iClicker “Exercise reduces risk of Alzheimers” => implies causation Not a randomized experiment => cannot conclude causation<br>
64
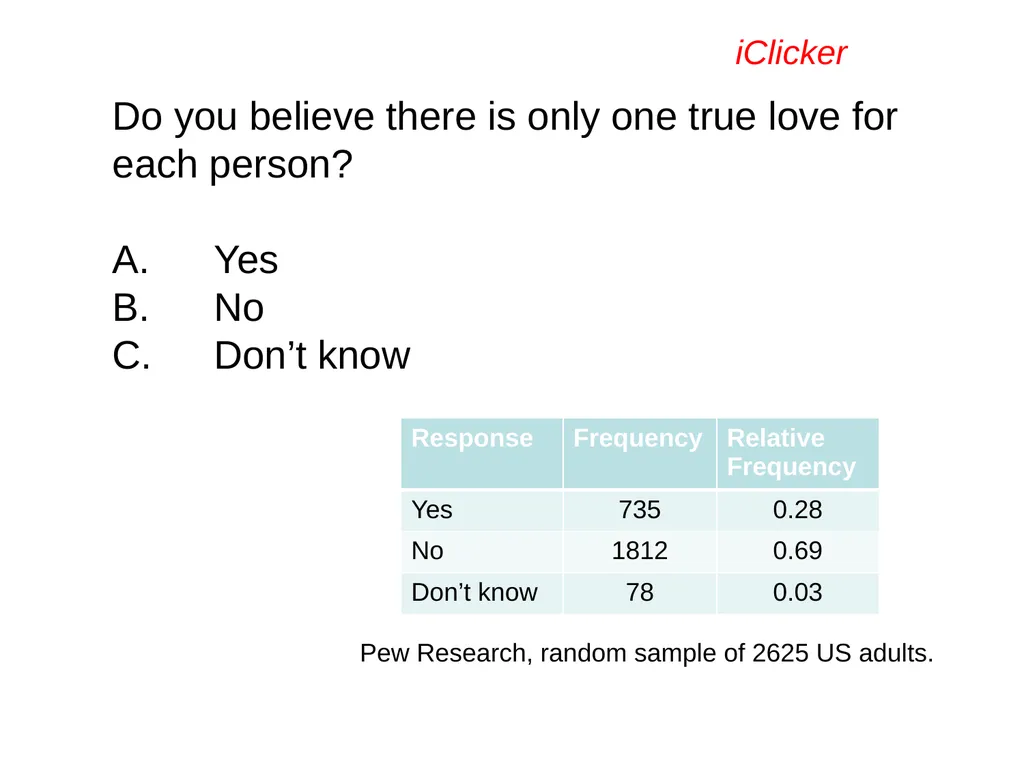
iClicker Do you believe there is only one true love for each person?
Yes
No
Don’t know Pew Research, random sample of 2625 US adults.<br>
Yes
No
Don’t know Pew Research, random sample of 2625 US adults.<br>
65
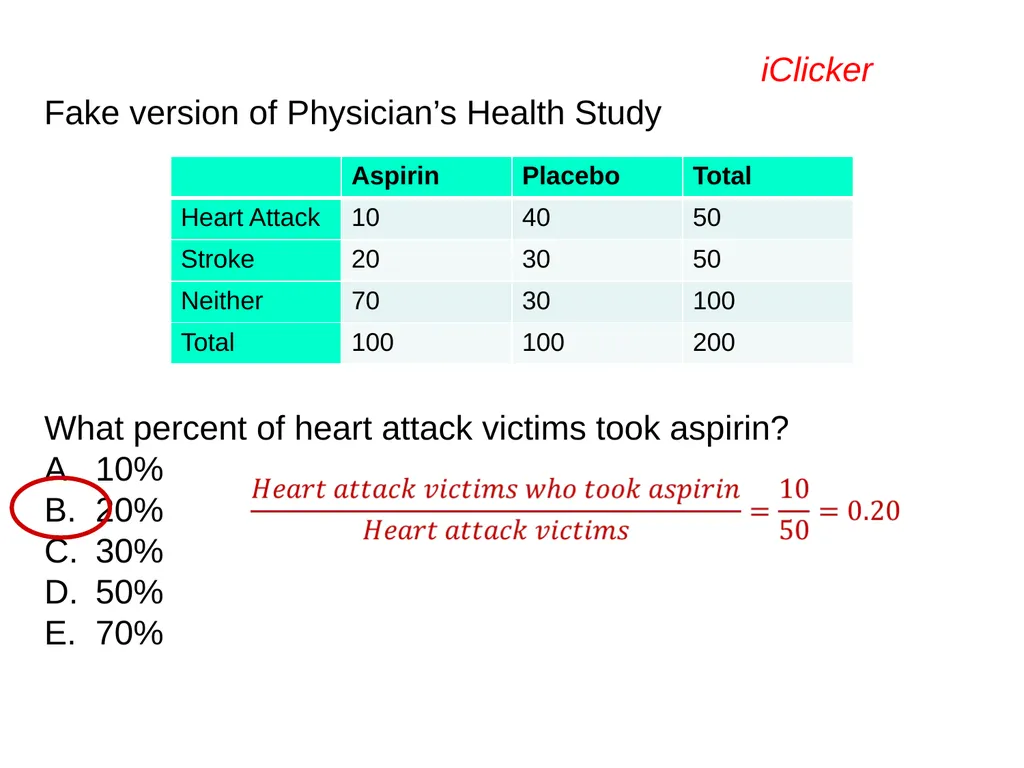
iClicker Fake version of Physician’s Health Study What percent of heart attack victims took aspirin?
10%
20%
30%
50%
70%<br>
10%
20%
30%
50%
70%<br>
66
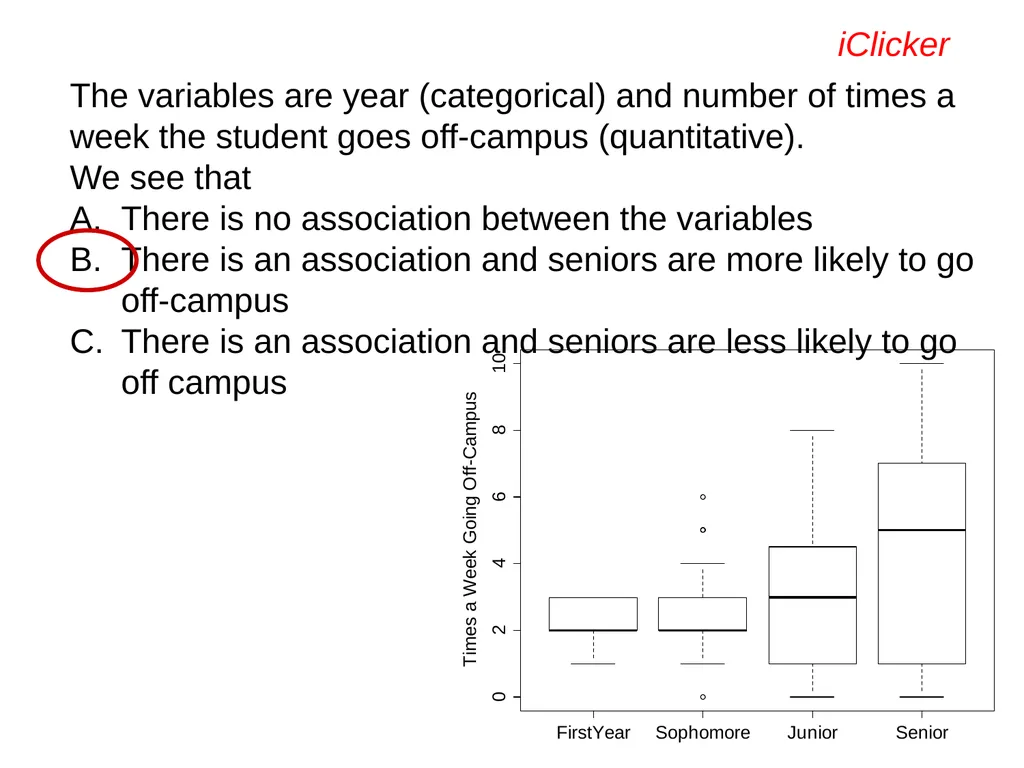
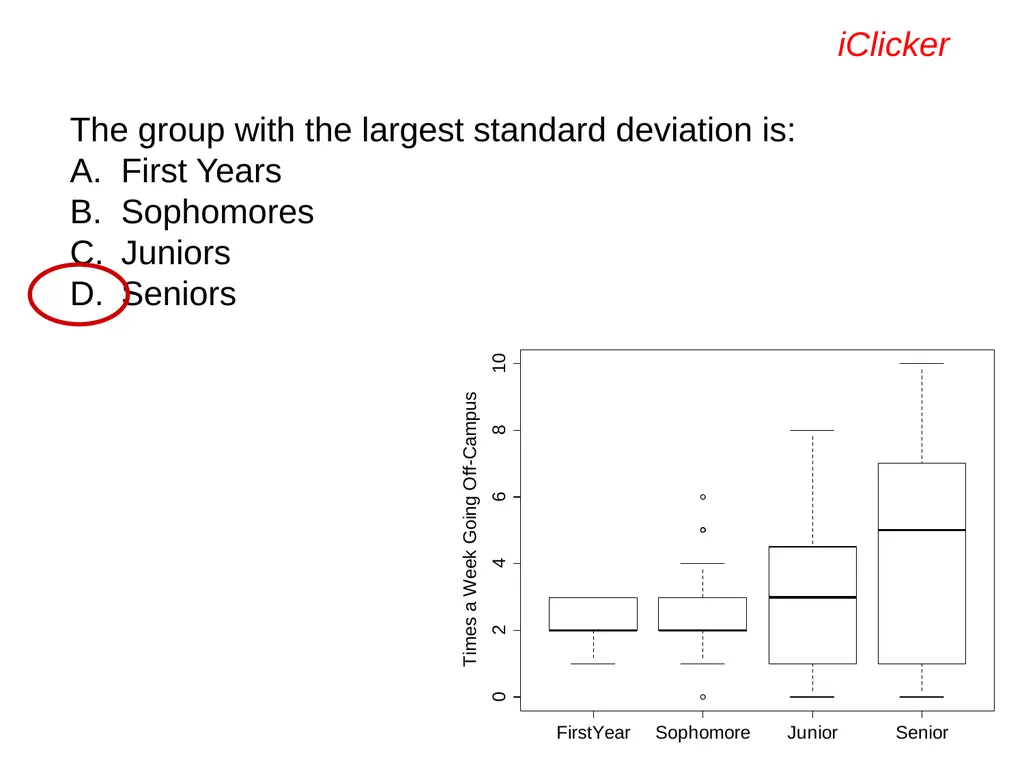
iClicker The variables are year (categorical) and number of times a week the student goes off-campus (quantitative).
We see that
There is no association between the variables
There is an association and seniors are more likely to go off-campus
There is an association and seniors are less likely to go off campus<br>
We see that
There is no association between the variables
There is an association and seniors are more likely to go off-campus
There is an association and seniors are less likely to go off campus<br>
67
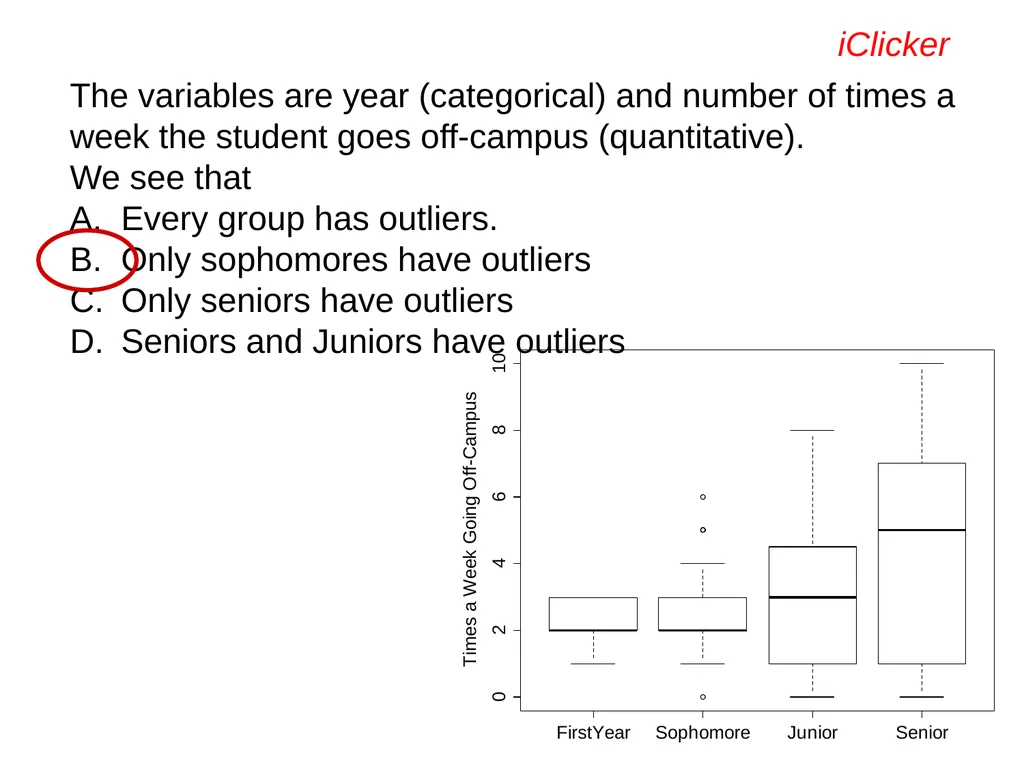
iClicker The variables are year (categorical) and number of times a week the student goes off-campus (quantitative).
We see that
Every group has outliers.
Only sophomores have outliers
Only seniors have outliers
Seniors and Juniors have outliers<br>
We see that
Every group has outliers.
Only sophomores have outliers
Only seniors have outliers
Seniors and Juniors have outliers<br>
68
iClicker The group with the largest standard deviation is:
First Years
Sophomores
Juniors
Seniors<br>
First Years
Sophomores
Juniors
Seniors<br>
69
Descriptive Statistics Think of a topic or question you would like to use data to help you answer.
What would the cases be?
What would the variables be?
(Limit to one or two variables)<br>
What would the cases be?
What would the variables be?
(Limit to one or two variables)<br>
70
For your classmate’s study, how would you visualize and summarize the variable or relationship between variables?
bar chart/pie chart, proportions, frequency table/relative frequency table
dotplot/histogram/boxplot, mean/median, sd/range/IQR, five number summary
side-by-side or segmented bar charts, two-way table, proportions
side-by-side boxplot, stats by group
scatterplot, correlation, regression iClicker<br>
bar chart/pie chart, proportions, frequency table/relative frequency table
dotplot/histogram/boxplot, mean/median, sd/range/IQR, five number summary
side-by-side or segmented bar charts, two-way table, proportions
side-by-side boxplot, stats by group
scatterplot, correlation, regression iClicker<br>
71
A 98% confidence interval for mean pulse rate is 65 to 71. The interpretation “I am 98% sure that all students will have pulse rates between 65 and 71.” is
Correct
Incorrect iClicker The confidence interval is about the population mean, not all students!<br>
Correct
Incorrect iClicker The confidence interval is about the population mean, not all students!<br>
72
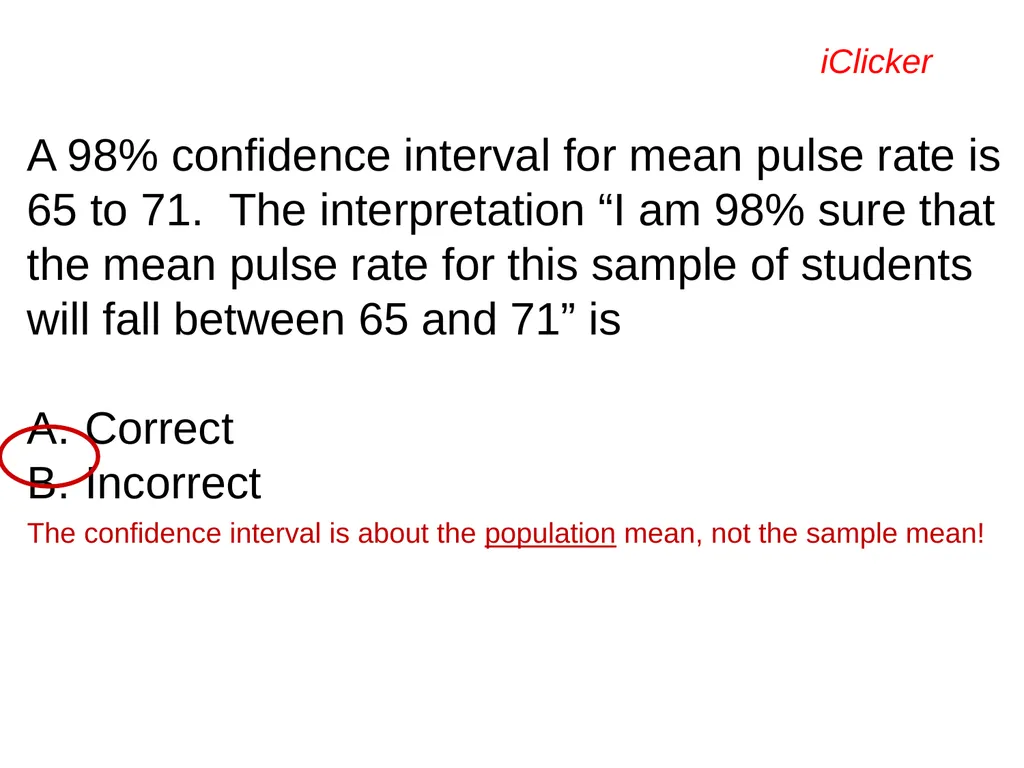
A 98% confidence interval for mean pulse rate is 65 to 71. The interpretation “I am 98% sure that the mean pulse rate for this sample of students will fall between 65 and 71” is
Correct
Incorrect iClicker The confidence interval is about the population mean, not the sample mean!<br>
Correct
Incorrect iClicker The confidence interval is about the population mean, not the sample mean!<br>
73
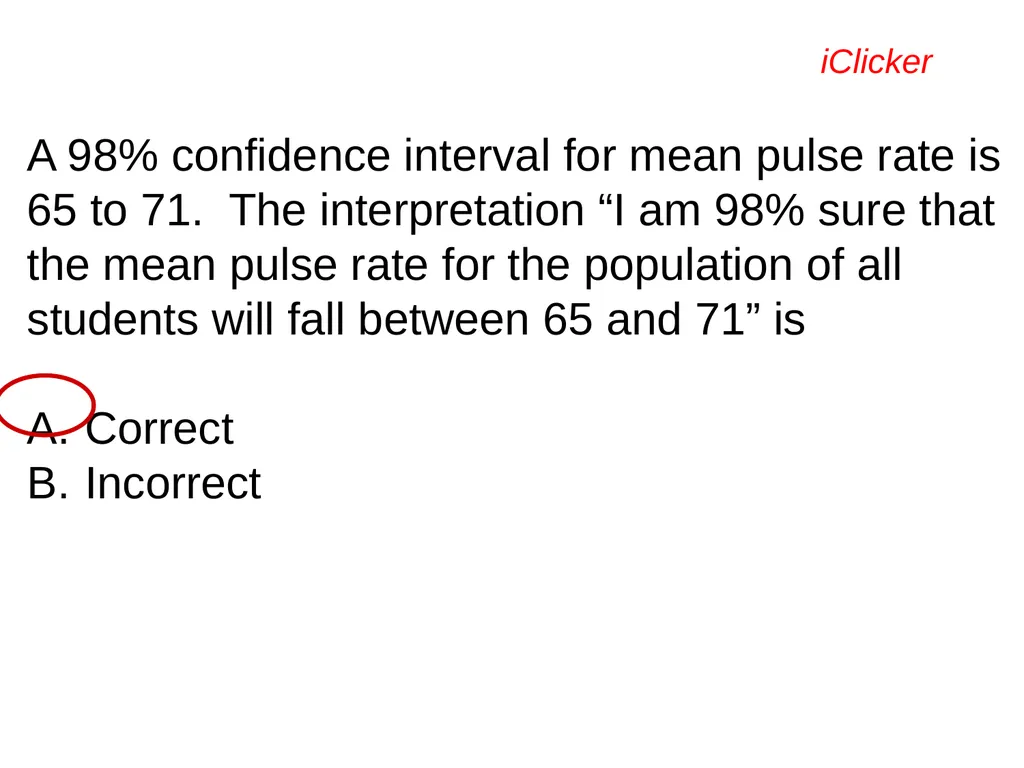
A 98% confidence interval for mean pulse rate is 65 to 71. The interpretation “I am 98% sure that the mean pulse rate for the population of all students will fall between 65 and 71” is
Correct
Incorrect iClicker<br>
Correct
Incorrect iClicker<br>
74
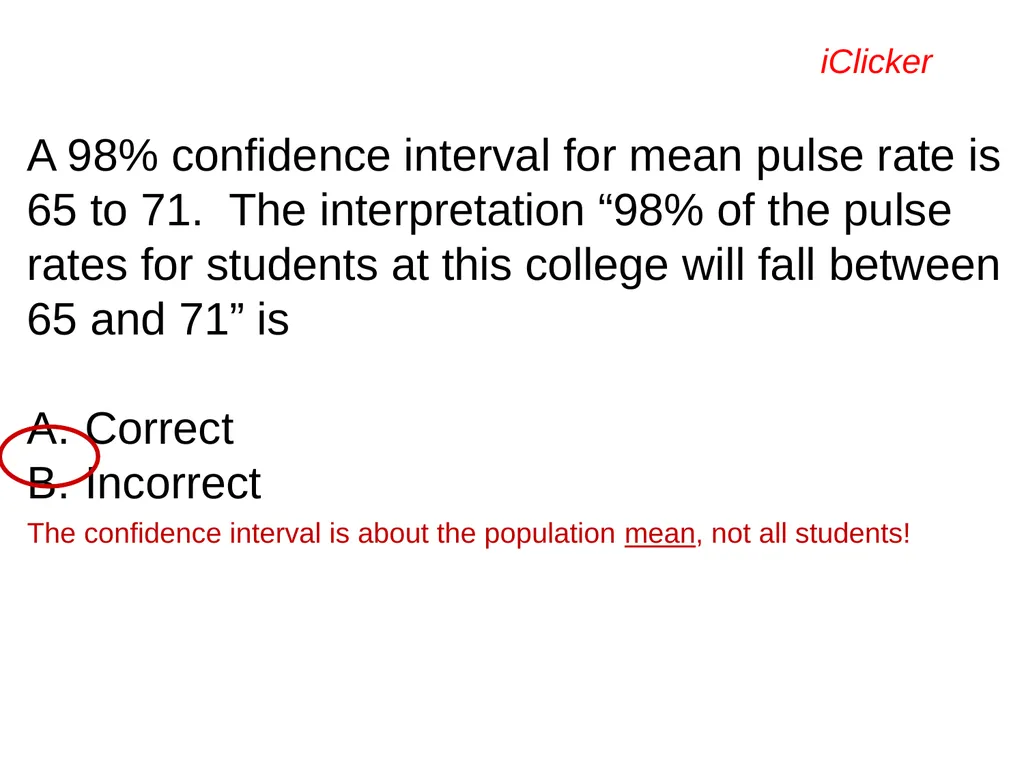
A 98% confidence interval for mean pulse rate is 65 to 71. The interpretation “98% of the pulse rates for students at this college will fall between 65 and 71” is
Correct
Incorrect iClicker The confidence interval is about the population mean, not all students!<br>
Correct
Incorrect iClicker The confidence interval is about the population mean, not all students!<br>
75
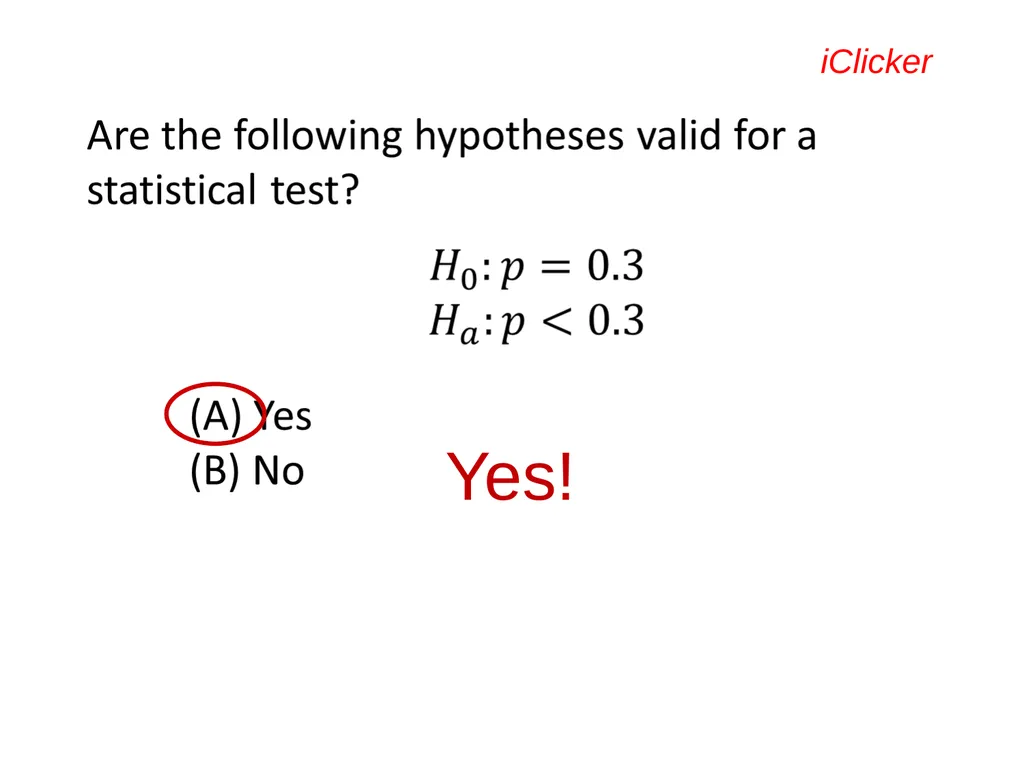
iClicker Yes!<br>
76
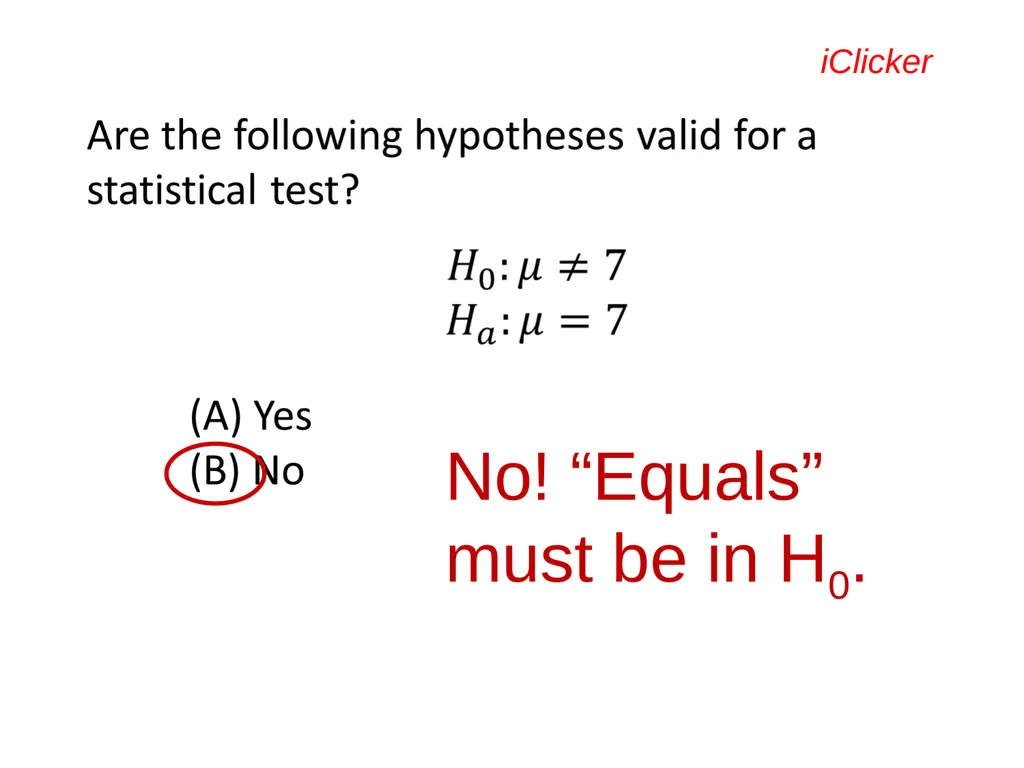
iClicker No! “Equals” must be in H0.<br>
77
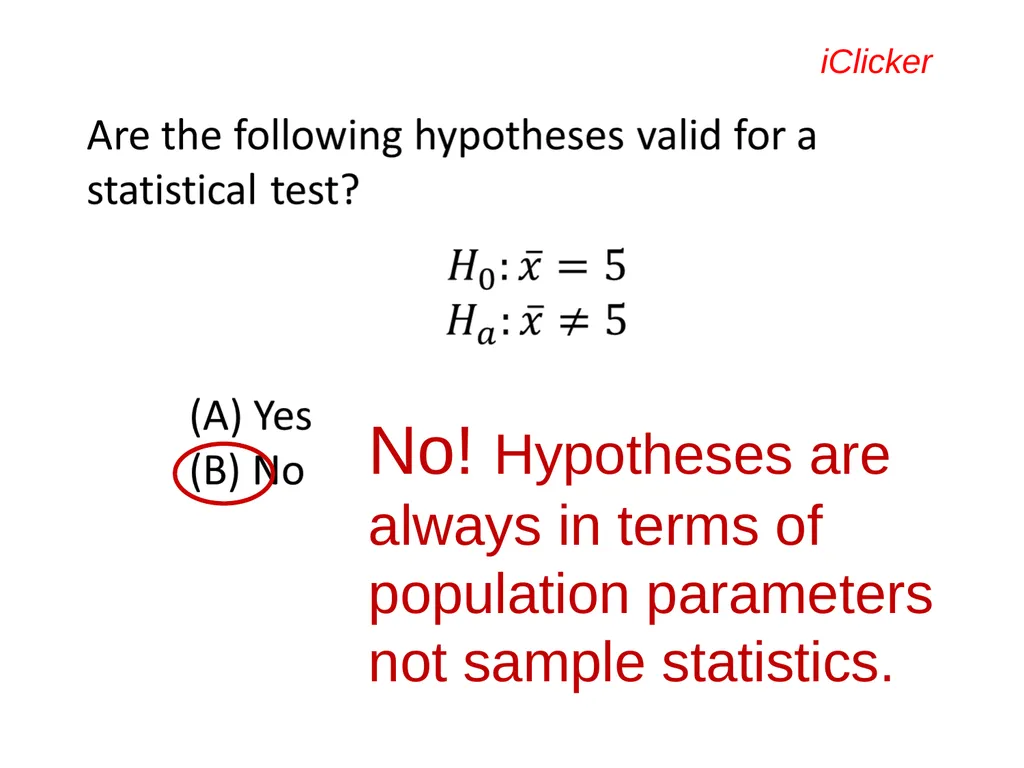
iClicker No! Hypotheses are always in terms of population parameters not sample statistics.<br>
78
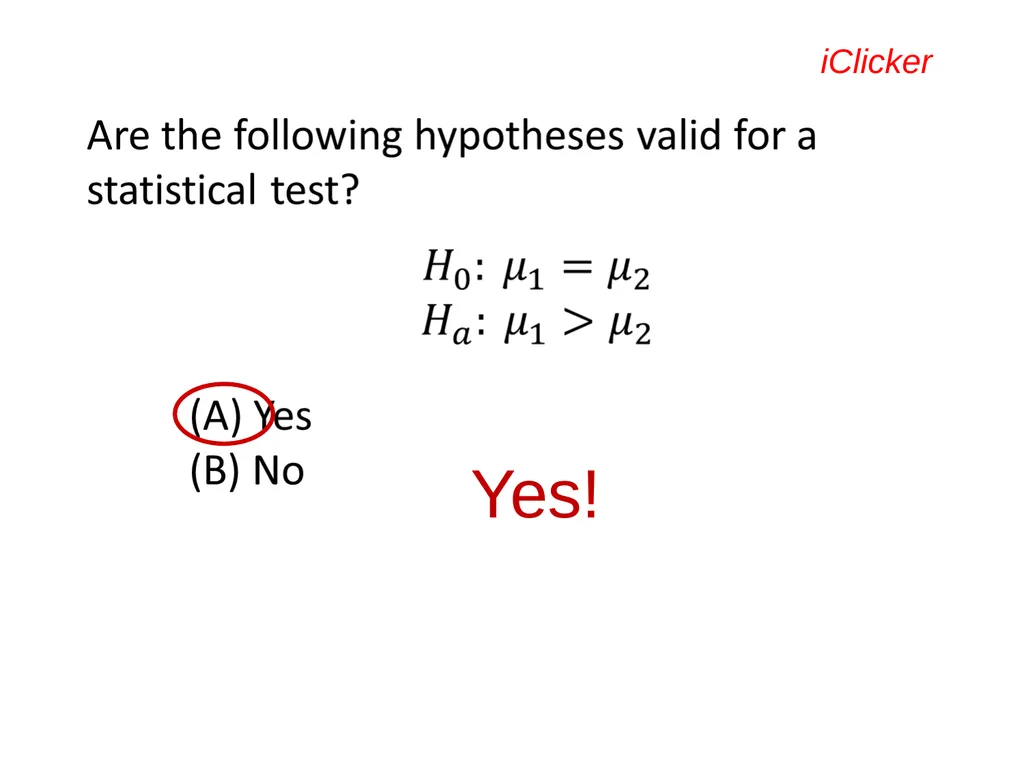
iClicker Yes!<br>
79
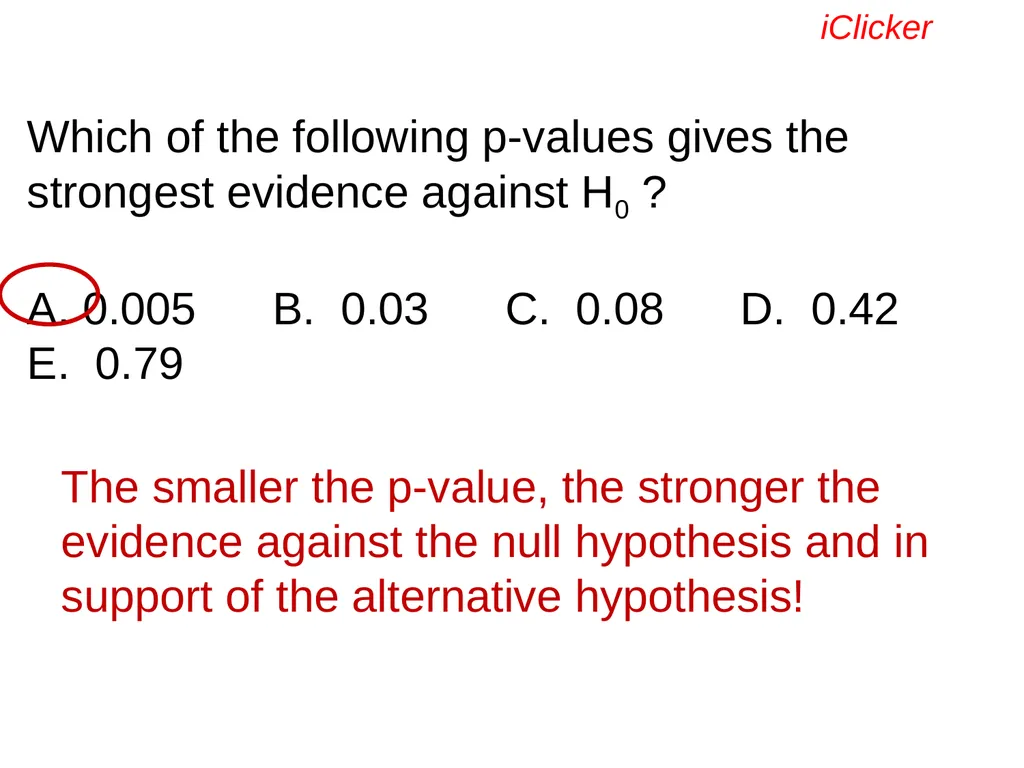
Which of the following p-values gives the strongest evidence against H0 ?
A. 0.005 B. 0.03 C. 0.08 D. 0.42 E. 0.79 iClicker The smaller the p-value, the stronger the evidence against the null hypothesis and in support of the alternative hypothesis!<br>
A. 0.005 B. 0.03 C. 0.08 D. 0.42 E. 0.79 iClicker The smaller the p-value, the stronger the evidence against the null hypothesis and in support of the alternative hypothesis!<br>
80
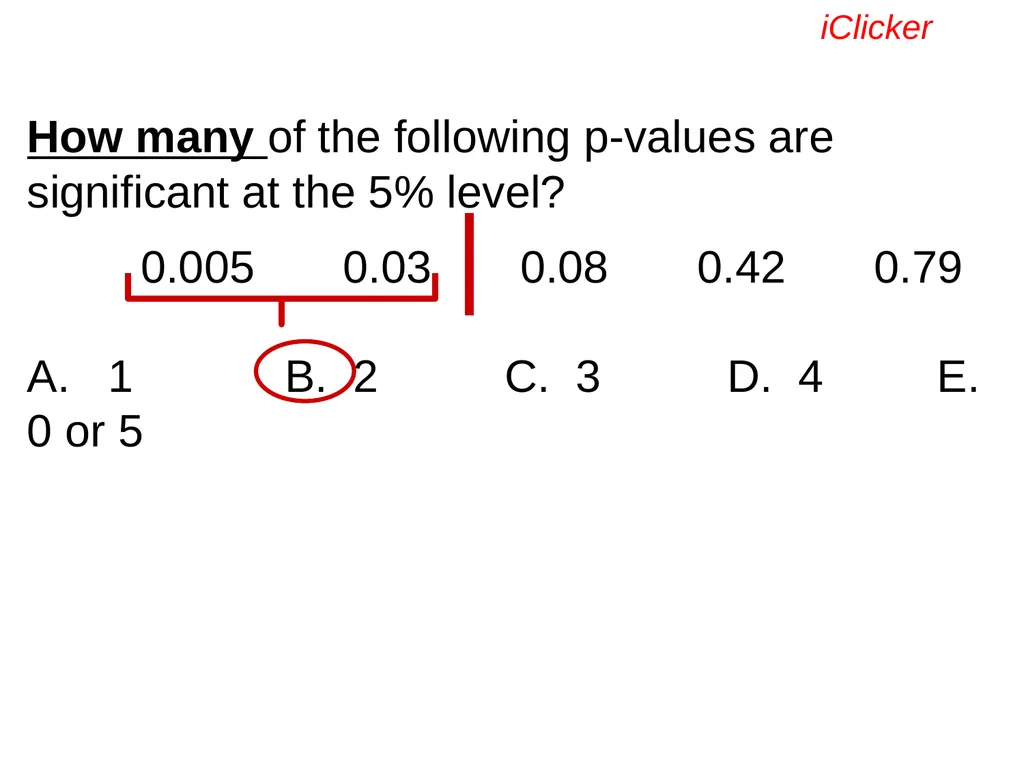
How many of the following p-values are significant at the 5% level?
0.005 0.03 0.08 0.42 0.79
A. 1 B. 2 C. 3 D. 4 E. 0 or 5 iClicker<br>
0.005 0.03 0.08 0.42 0.79
A. 1 B. 2 C. 3 D. 4 E. 0 or 5 iClicker<br>
81
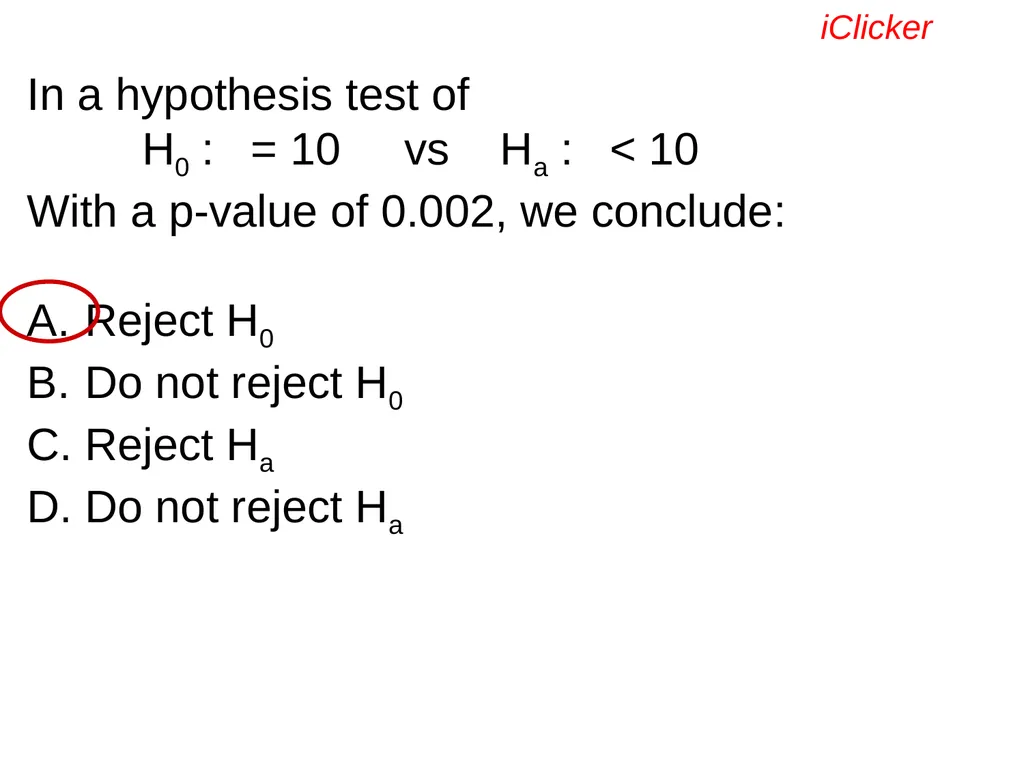
In a hypothesis test of
H0 : = 10 vs Ha : < 10
With a p-value of 0.002, we conclude:
Reject H0
Do not reject H0
Reject Ha
Do not reject Ha iClicker<br>
H0 : = 10 vs Ha : < 10
With a p-value of 0.002, we conclude:
Reject H0
Do not reject H0
Reject Ha
Do not reject Ha iClicker<br>
82
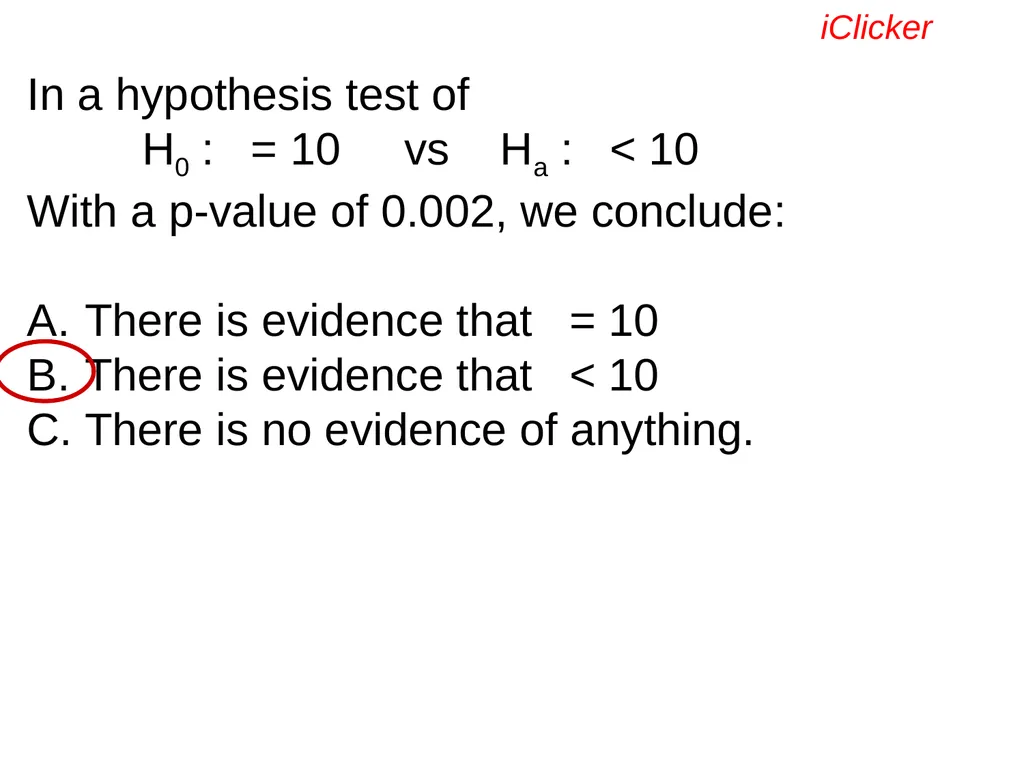
In a hypothesis test of
H0 : = 10 vs Ha : < 10
With a p-value of 0.002, we conclude:
There is evidence that = 10
There is evidence that < 10
There is no evidence of anything. iClicker<br>
H0 : = 10 vs Ha : < 10
With a p-value of 0.002, we conclude:
There is evidence that = 10
There is evidence that < 10
There is no evidence of anything. iClicker<br>
83
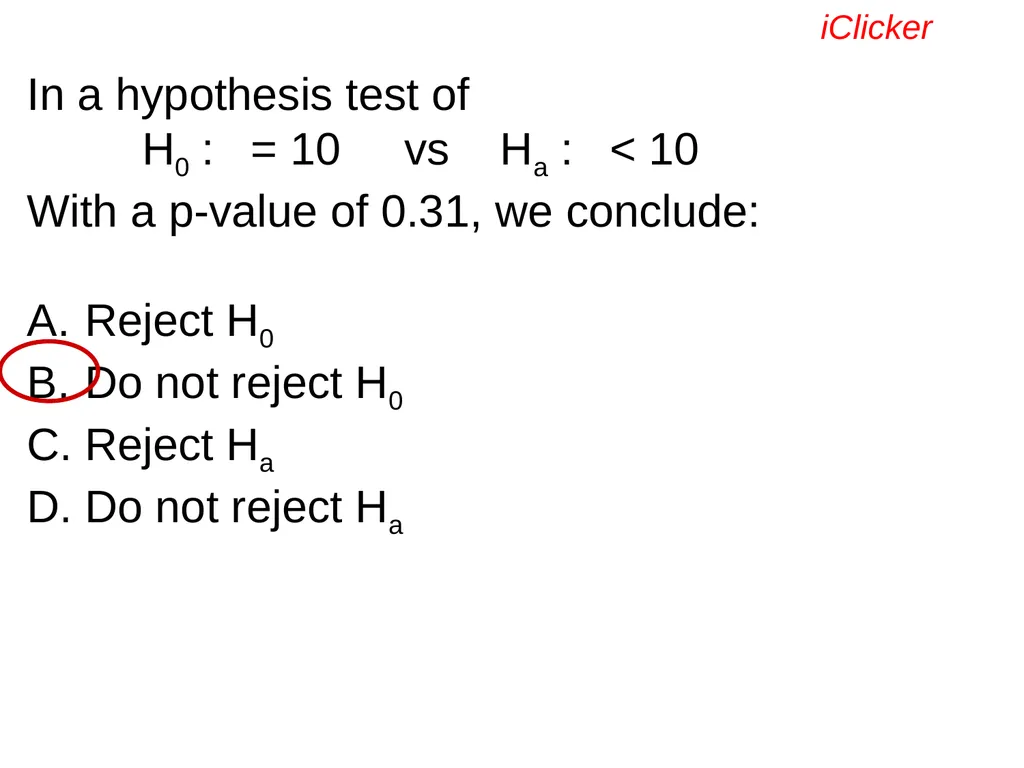
In a hypothesis test of
H0 : = 10 vs Ha : < 10
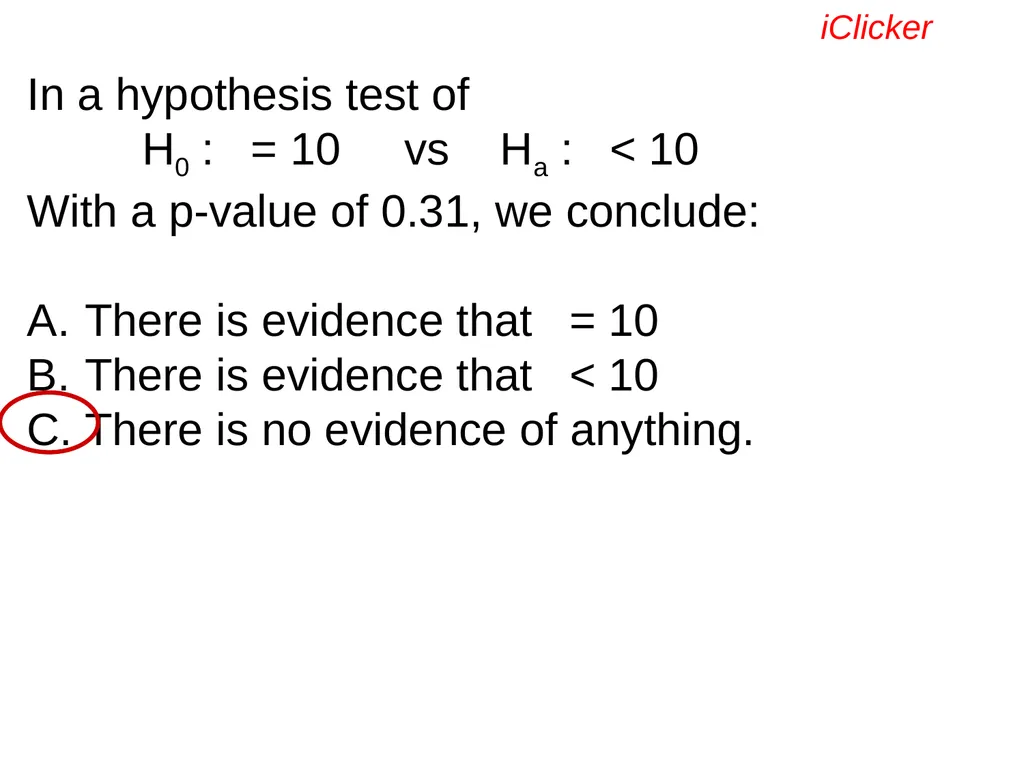
With a p-value of 0.31, we conclude:
Reject H0
Do not reject H0
Reject Ha
Do not reject Ha iClicker<br>
H0 : = 10 vs Ha : < 10
With a p-value of 0.31, we conclude:
Reject H0
Do not reject H0
Reject Ha
Do not reject Ha iClicker<br>
84
In a hypothesis test of
H0 : = 10 vs Ha : < 10
With a p-value of 0.31, we conclude:
There is evidence that = 10
There is evidence that < 10
There is no evidence of anything. iClicker<br>
H0 : = 10 vs Ha : < 10
With a p-value of 0.31, we conclude:
There is evidence that = 10
There is evidence that < 10
There is no evidence of anything. iClicker<br>
85
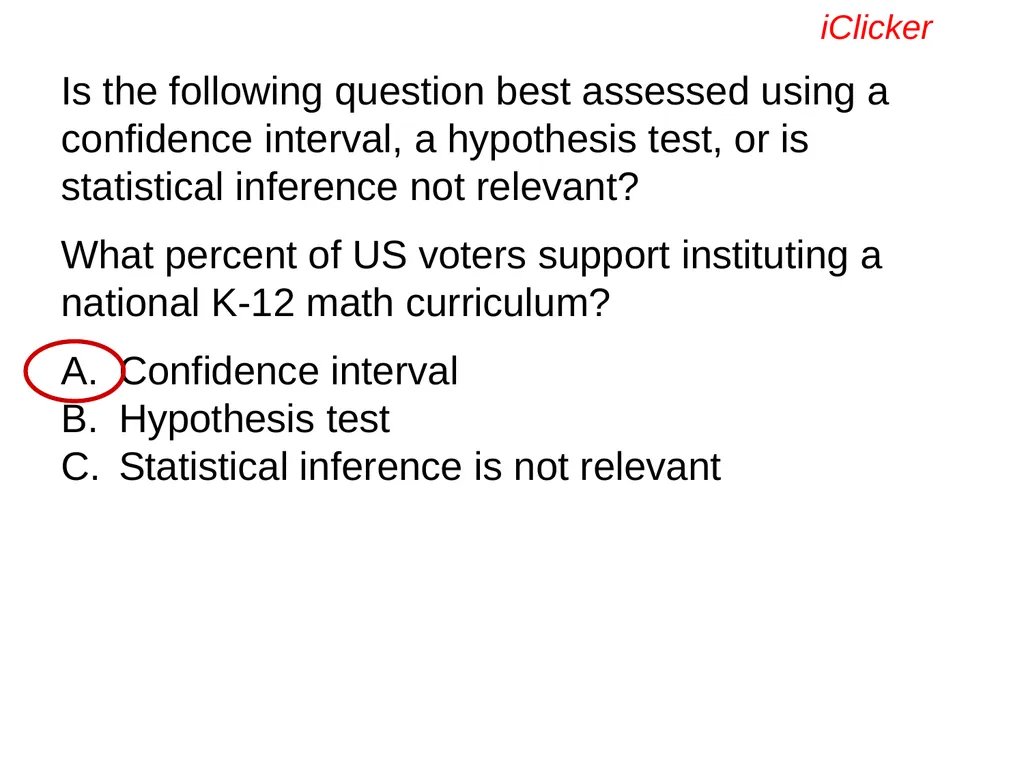
Is the following question best assessed using a confidence interval, a hypothesis test, or is statistical inference not relevant?
What percent of US voters support instituting a national K-12 math curriculum?
Confidence interval
Hypothesis test
Statistical inference is not relevant iClicker<br>
What percent of US voters support instituting a national K-12 math curriculum?
Confidence interval
Hypothesis test
Statistical inference is not relevant iClicker<br>
86
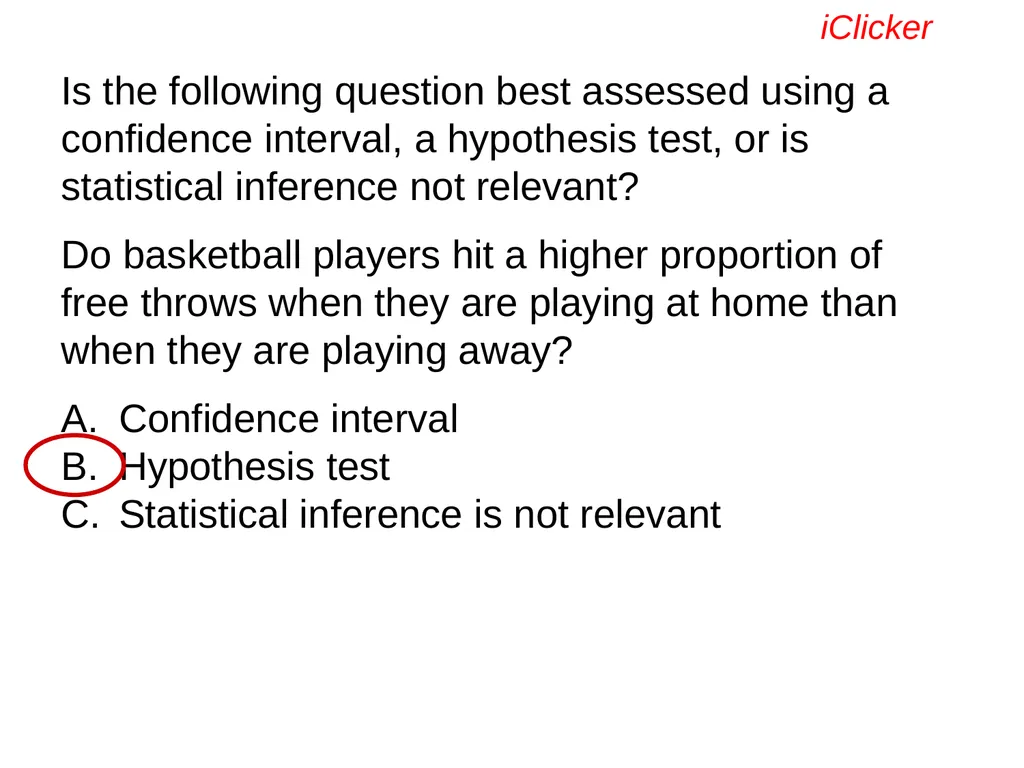
Is the following question best assessed using a confidence interval, a hypothesis test, or is statistical inference not relevant?
Do basketball players hit a higher proportion of free throws when they are playing at home than when they are playing away?
Confidence interval
Hypothesis test
Statistical inference is not relevant iClicker<br>
Do basketball players hit a higher proportion of free throws when they are playing at home than when they are playing away?
Confidence interval
Hypothesis test
Statistical inference is not relevant iClicker<br>
87
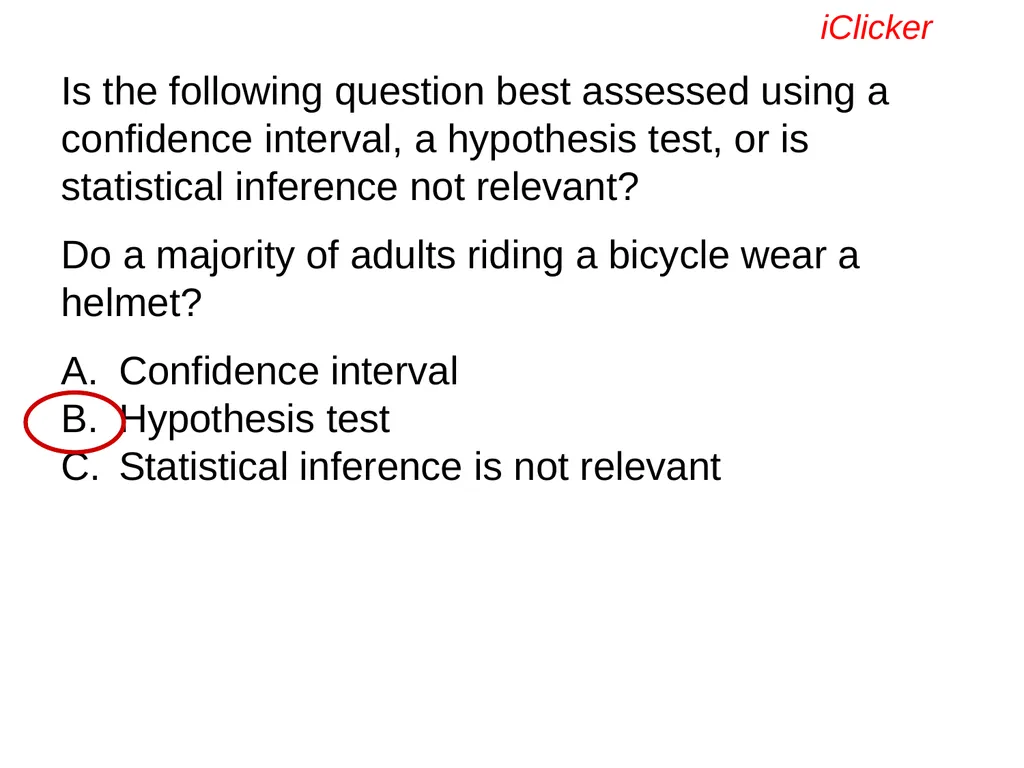
Is the following question best assessed using a confidence interval, a hypothesis test, or is statistical inference not relevant?
Do a majority of adults riding a bicycle wear a helmet?
Confidence interval
Hypothesis test
Statistical inference is not relevant iClicker<br>
Do a majority of adults riding a bicycle wear a helmet?
Confidence interval
Hypothesis test
Statistical inference is not relevant iClicker<br>
88
Is the following question best assessed using a confidence interval, a hypothesis test, or is statistical inference not relevant?
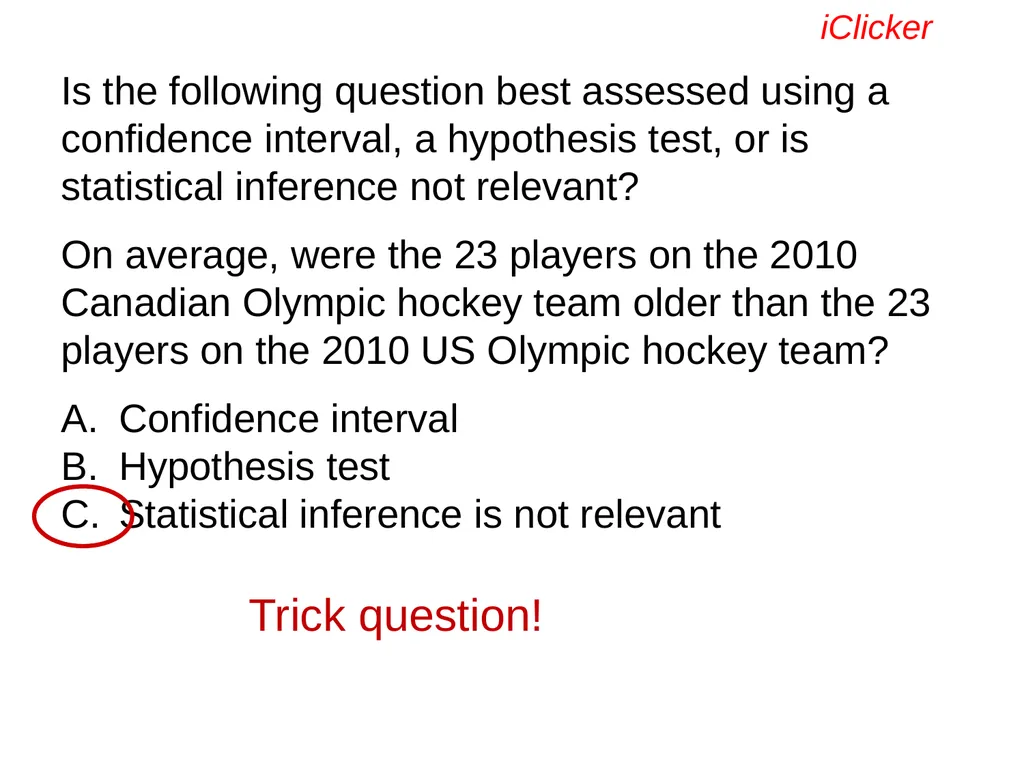
On average, were the 23 players on the 2010 Canadian Olympic hockey team older than the 23 players on the 2010 US Olympic hockey team?
Confidence interval
Hypothesis test
Statistical inference is not relevant iClicker Trick question!<br>
On average, were the 23 players on the 2010 Canadian Olympic hockey team older than the 23 players on the 2010 US Olympic hockey team?
Confidence interval
Hypothesis test
Statistical inference is not relevant iClicker Trick question!<br>
89
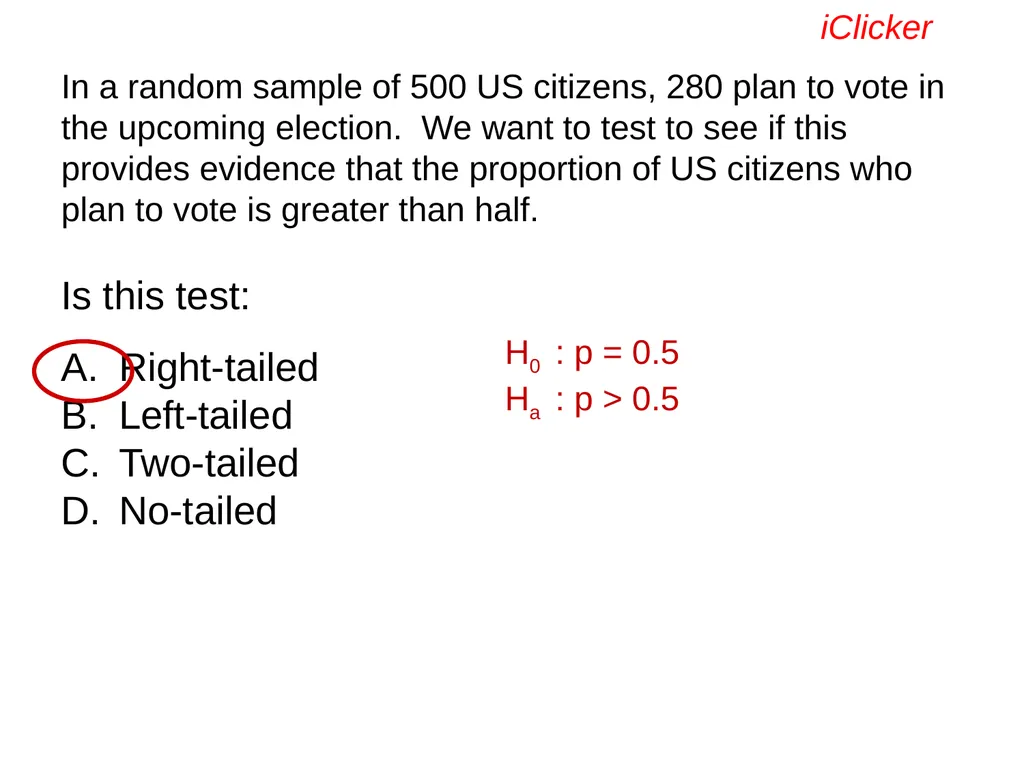
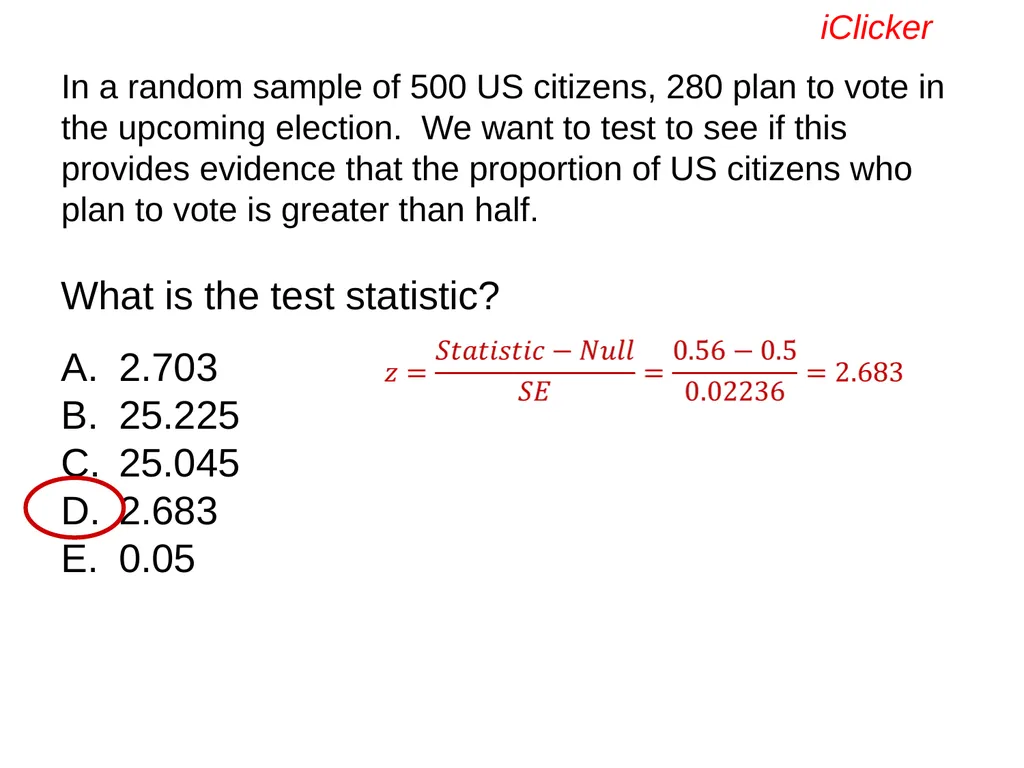
In a random sample of 500 US citizens, 280 plan to vote in the upcoming election. We want to test to see if this provides evidence that the proportion of US citizens who plan to vote is greater than half.
Is this test:
Right-tailed
Left-tailed
Two-tailed
No-tailed iClicker H0 : p = 0.5
Ha : p > 0.5<br>
Is this test:
Right-tailed
Left-tailed
Two-tailed
No-tailed iClicker H0 : p = 0.5
Ha : p > 0.5<br>
90
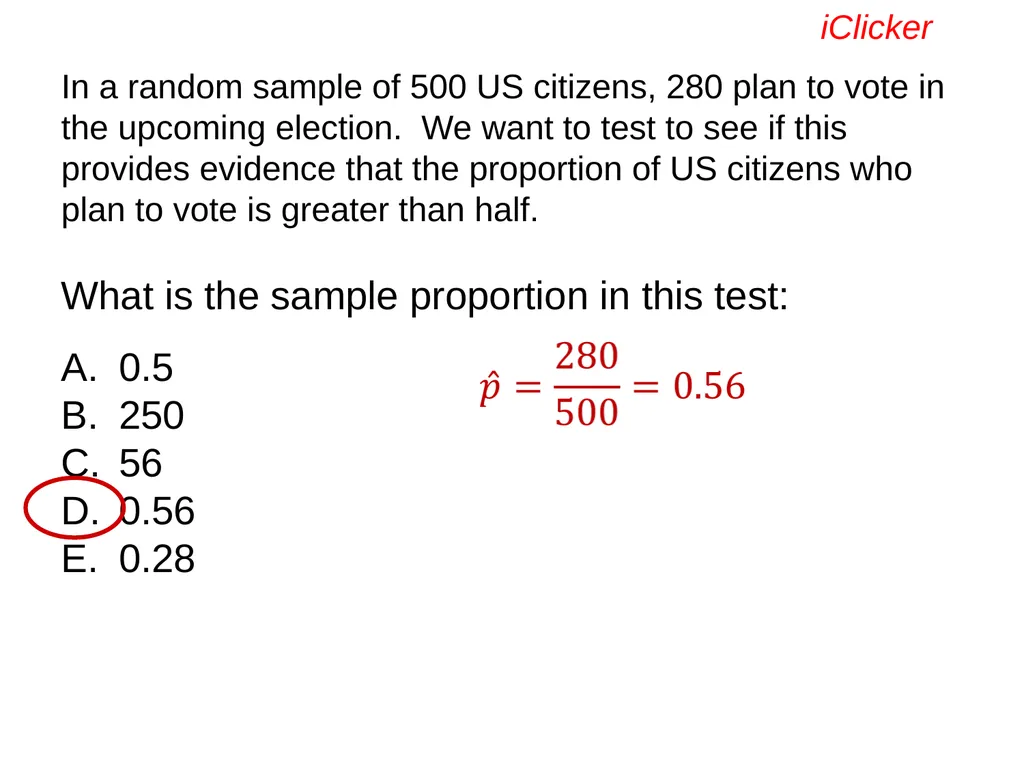
In a random sample of 500 US citizens, 280 plan to vote in the upcoming election. We want to test to see if this provides evidence that the proportion of US citizens who plan to vote is greater than half.
What is the sample proportion in this test:
0.5
250
56
0.56
0.28 iClicker<br>
What is the sample proportion in this test:
0.5
250
56
0.56
0.28 iClicker<br>
91
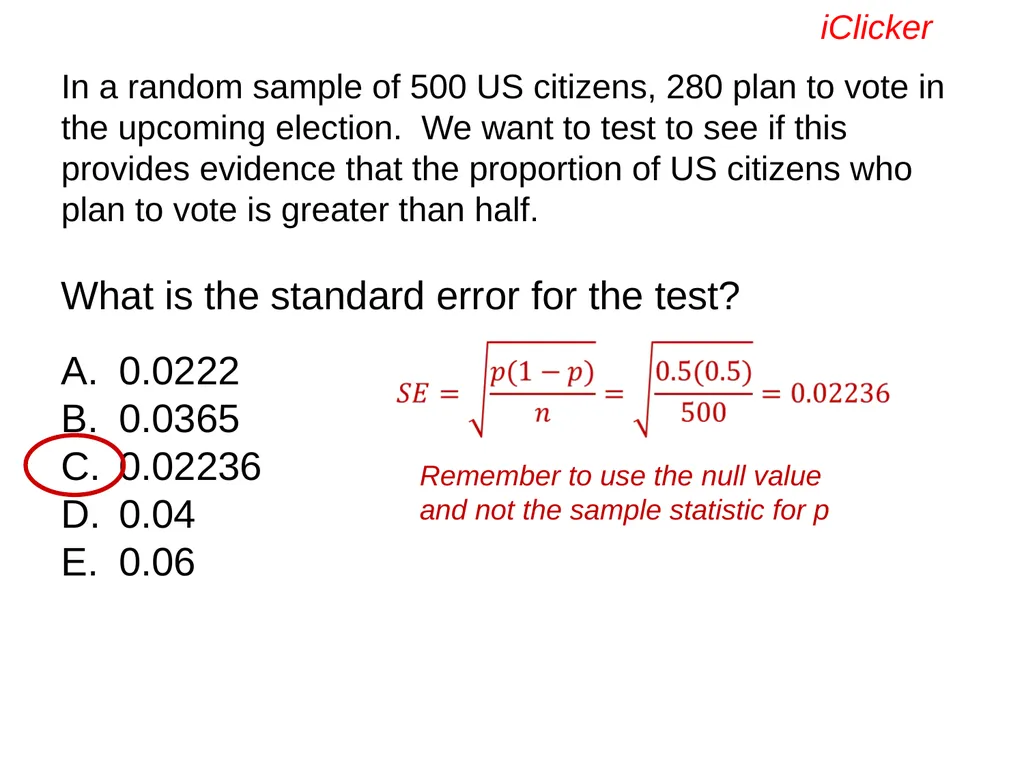
In a random sample of 500 US citizens, 280 plan to vote in the upcoming election. We want to test to see if this provides evidence that the proportion of US citizens who plan to vote is greater than half.
What is the standard error for the test?
0.0222
0.0365
0.02236
0.04
0.06 iClicker Remember to use the null value and not the sample statistic for p<br>
What is the standard error for the test?
0.0222
0.0365
0.02236
0.04
0.06 iClicker Remember to use the null value and not the sample statistic for p<br>
92
In a random sample of 500 US citizens, 280 plan to vote in the upcoming election. We want to test to see if this provides evidence that the proportion of US citizens who plan to vote is greater than half.
What is the test statistic?
2.703
25.225
25.045
2.683
0.05 iClicker<br>
What is the test statistic?
2.703
25.225
25.045
2.683
0.05 iClicker<br>
93
In a random sample of 500 US citizens, 280 plan to vote in the upcoming election. We want to test to see if this provides evidence that the proportion of US citizens who plan to vote is greater than half.
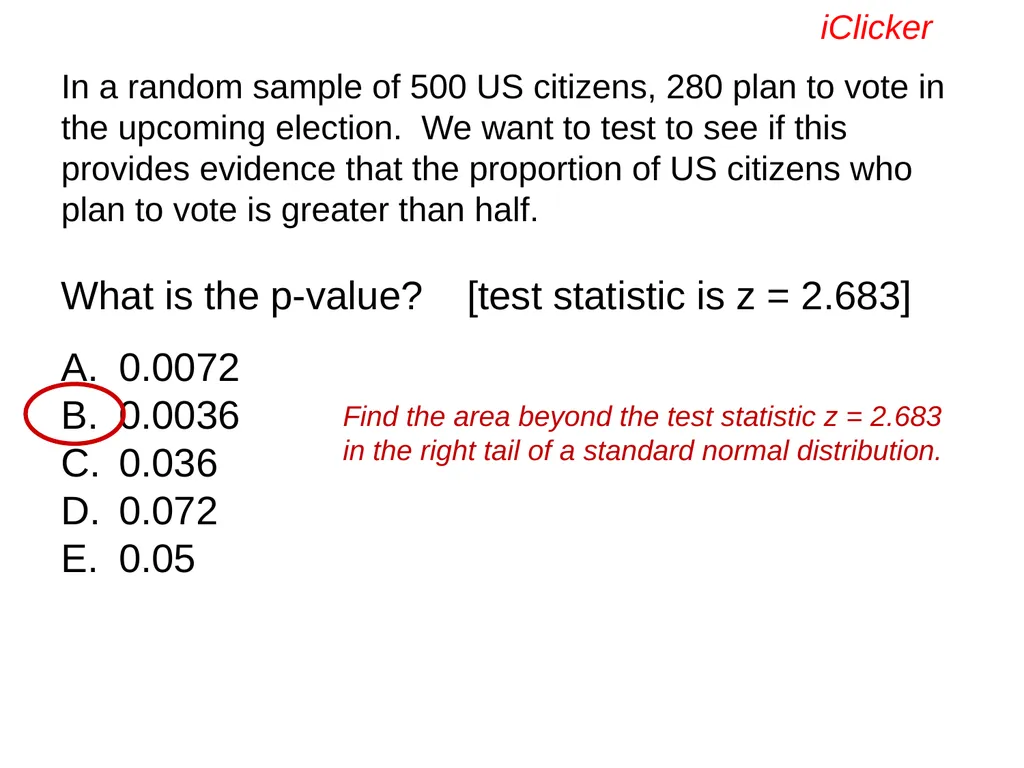
What is the p-value? [test statistic is z = 2.683]
0.0072
0.0036
0.036
0.072
0.05 iClicker Find the area beyond the test statistic z = 2.683 in the right tail of a standard normal distribution.<br>
What is the p-value? [test statistic is z = 2.683]
0.0072
0.0036
0.036
0.072
0.05 iClicker Find the area beyond the test statistic z = 2.683 in the right tail of a standard normal distribution.<br>
94
In a random sample of 500 US citizens, 280 plan to vote in the upcoming election. We want to test to see if this provides evidence that the proportion of US citizens who plan to vote is greater than half.
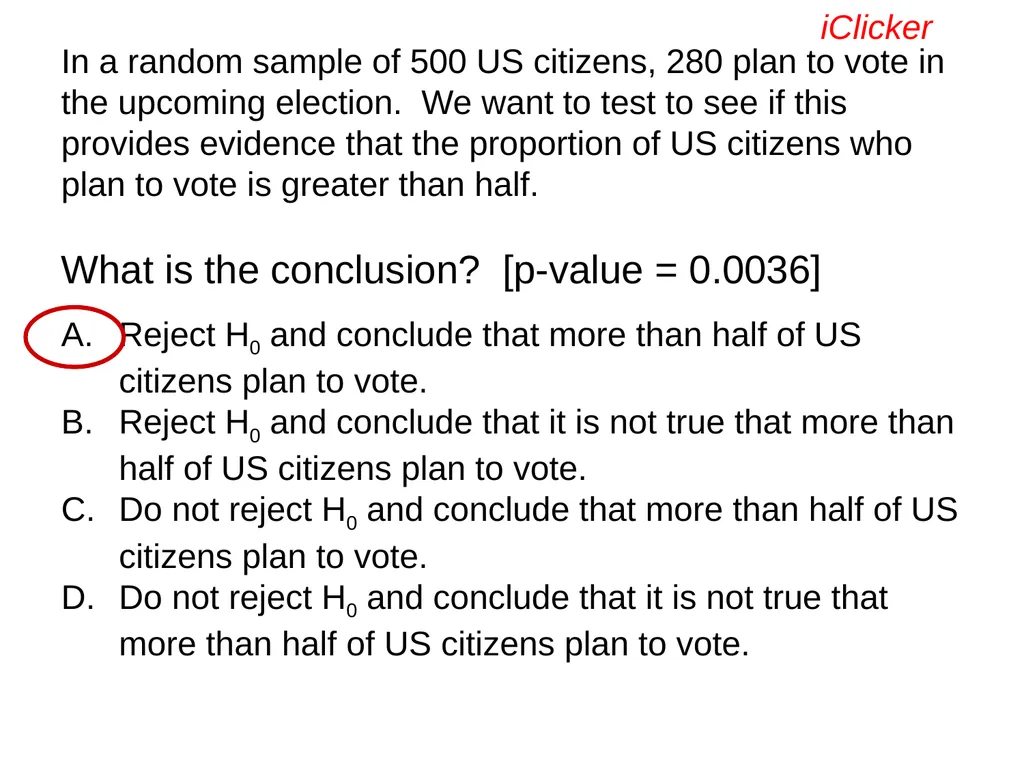
What is the conclusion? [p-value = 0.0036]
Reject H0 and conclude that more than half of US citizens plan to vote.
Reject H0 and conclude that it is not true that more than half of US citizens plan to vote.
Do not reject H0 and conclude that more than half of US citizens plan to vote.
Do not reject H0 and conclude that it is not true that more than half of US citizens plan to vote. iClicker<br>
What is the conclusion? [p-value = 0.0036]
Reject H0 and conclude that more than half of US citizens plan to vote.
Reject H0 and conclude that it is not true that more than half of US citizens plan to vote.
Do not reject H0 and conclude that more than half of US citizens plan to vote.
Do not reject H0 and conclude that it is not true that more than half of US citizens plan to vote. iClicker<br>
95
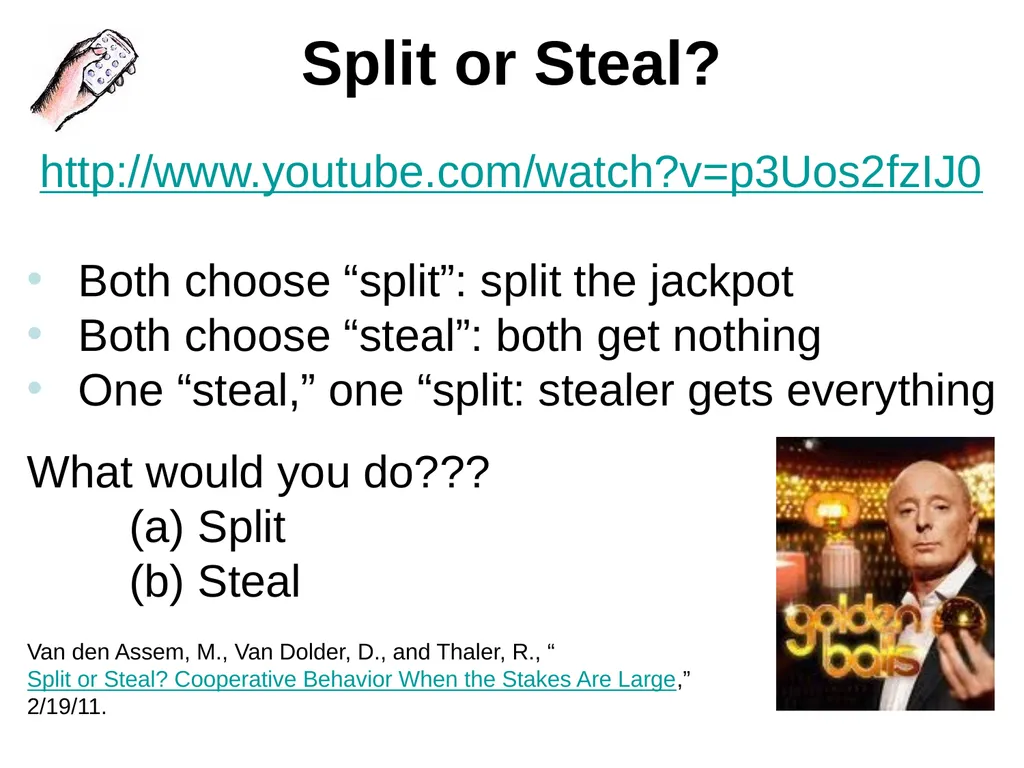
Split or Steal? http://www.youtube.com/watch?v=p3Uos2fzIJ0
Both choose “split”: split the jackpot
Both choose “steal”: both get nothing
One “steal,” one “split: stealer gets everything
What would you do???
(a) Split
(b) Steal Van den Assem, M., Van Dolder, D., and Thaler, R., “Split or Steal? Cooperative Behavior When the Stakes Are Large,” 2/19/11.<br>
Both choose “split”: split the jackpot
Both choose “steal”: both get nothing
One “steal,” one “split: stealer gets everything
What would you do???
(a) Split
(b) Steal Van den Assem, M., Van Dolder, D., and Thaler, R., “Split or Steal? Cooperative Behavior When the Stakes Are Large,” 2/19/11.<br>
96
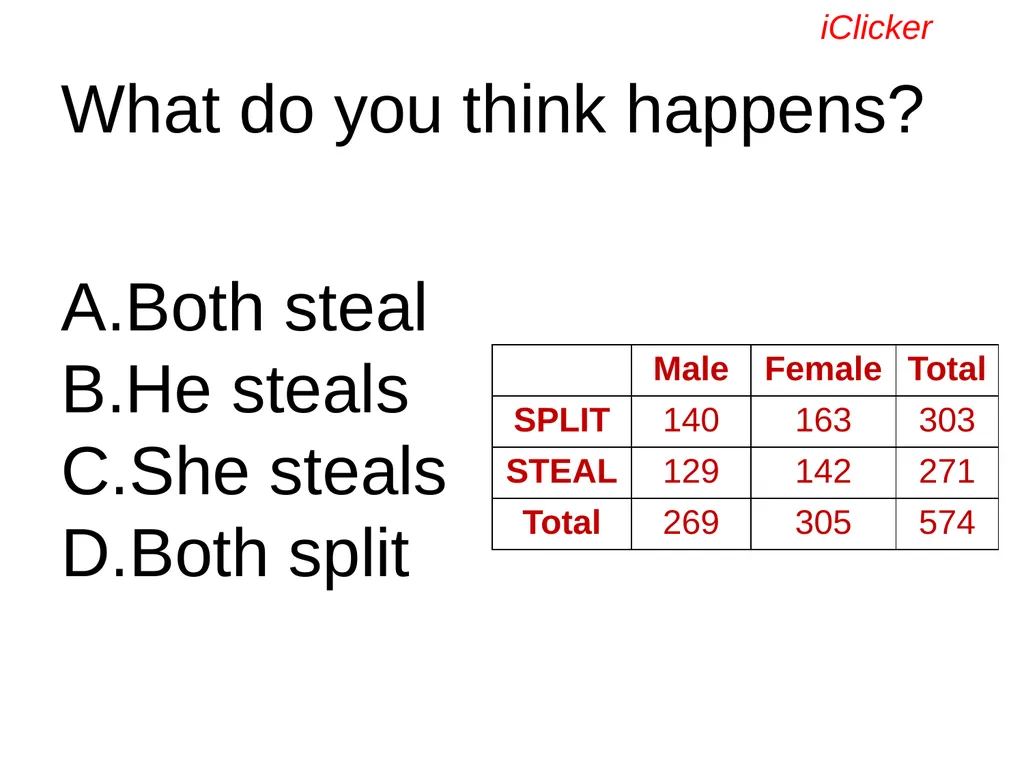
What do you think happens?
Both steal
He steals
She steals
Both split iClicker<br>
Both steal
He steals
She steals
Both split iClicker<br>
97
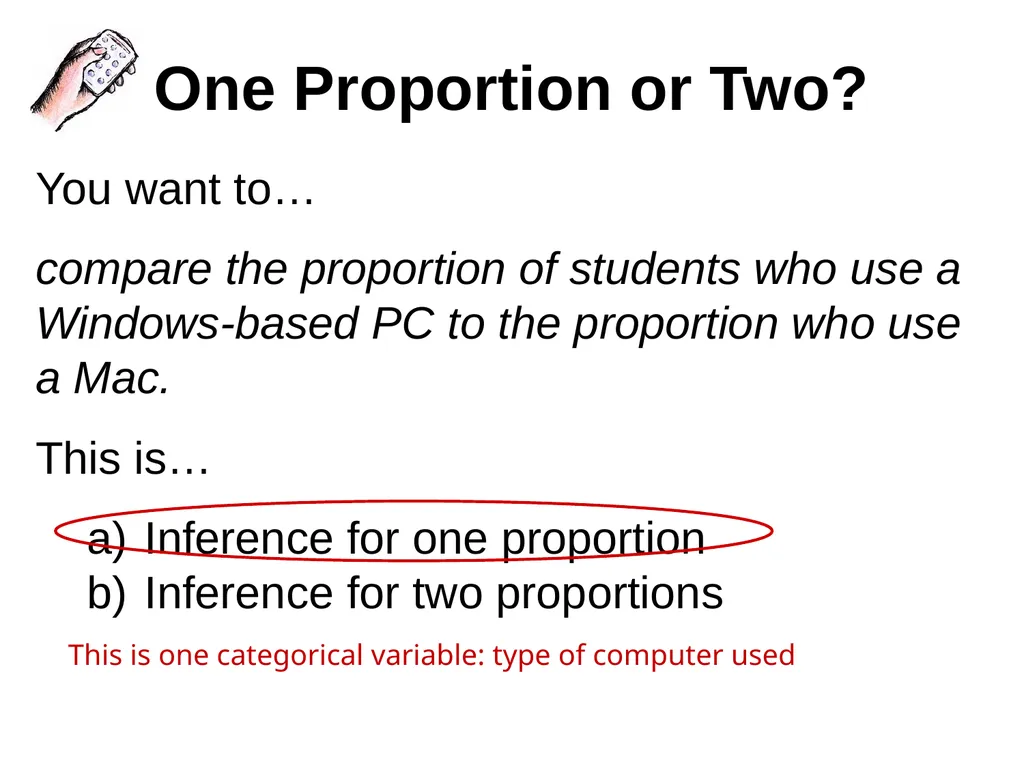
One Proportion or Two? You want to…
compare the proportion of students who use a Windows-based PC to the proportion who use a Mac.
This is…
Inference for one proportion
Inference for two proportions This is one categorical variable: type of computer used<br>
compare the proportion of students who use a Windows-based PC to the proportion who use a Mac.
This is…
Inference for one proportion
Inference for two proportions This is one categorical variable: type of computer used<br>
98
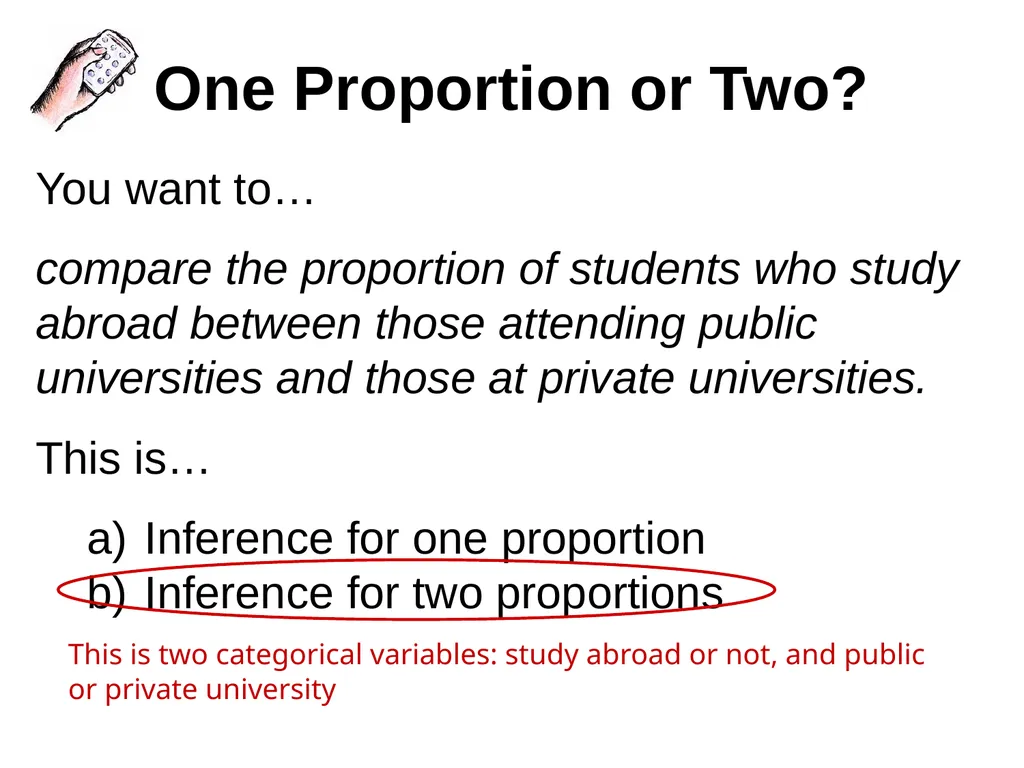
One Proportion or Two? You want to…
compare the proportion of students who study abroad between those attending public universities and those at private universities.
This is…
Inference for one proportion
Inference for two proportions This is two categorical variables: study abroad or not, and public or private university<br>
compare the proportion of students who study abroad between those attending public universities and those at private universities.
This is…
Inference for one proportion
Inference for two proportions This is two categorical variables: study abroad or not, and public or private university<br>
99
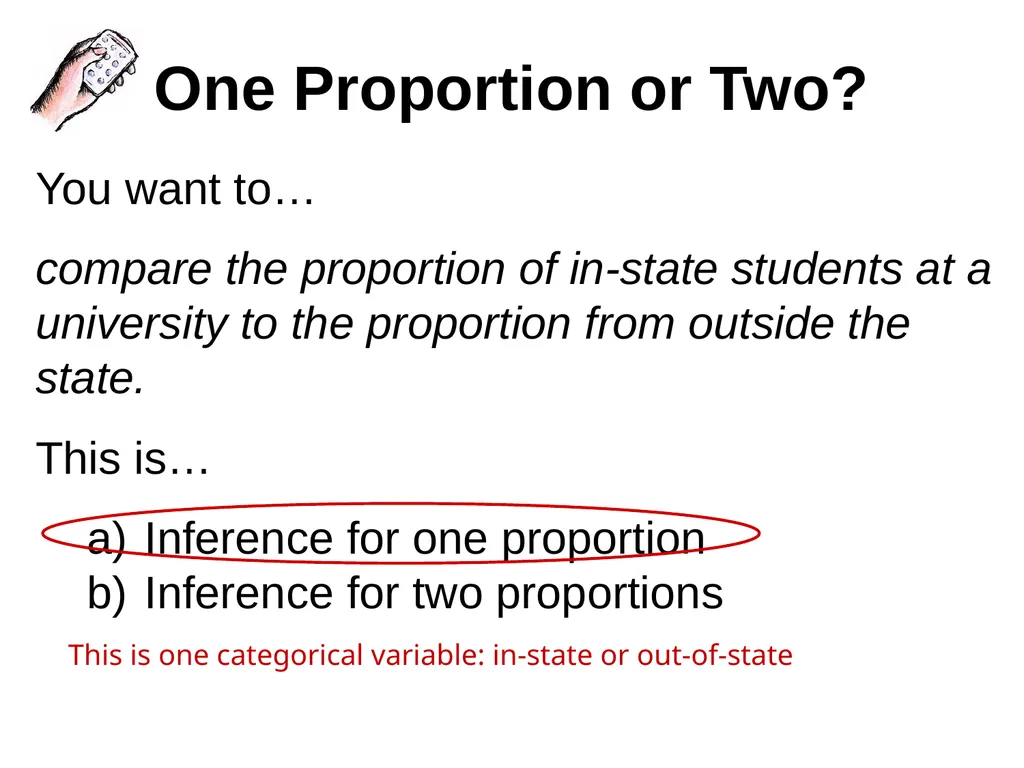
One Proportion or Two? You want to…
compare the proportion of in-state students at a university to the proportion from outside the state.
This is…
Inference for one proportion
Inference for two proportions This is one categorical variable: in-state or out-of-state<br>
compare the proportion of in-state students at a university to the proportion from outside the state.
This is…
Inference for one proportion
Inference for two proportions This is one categorical variable: in-state or out-of-state<br>
100
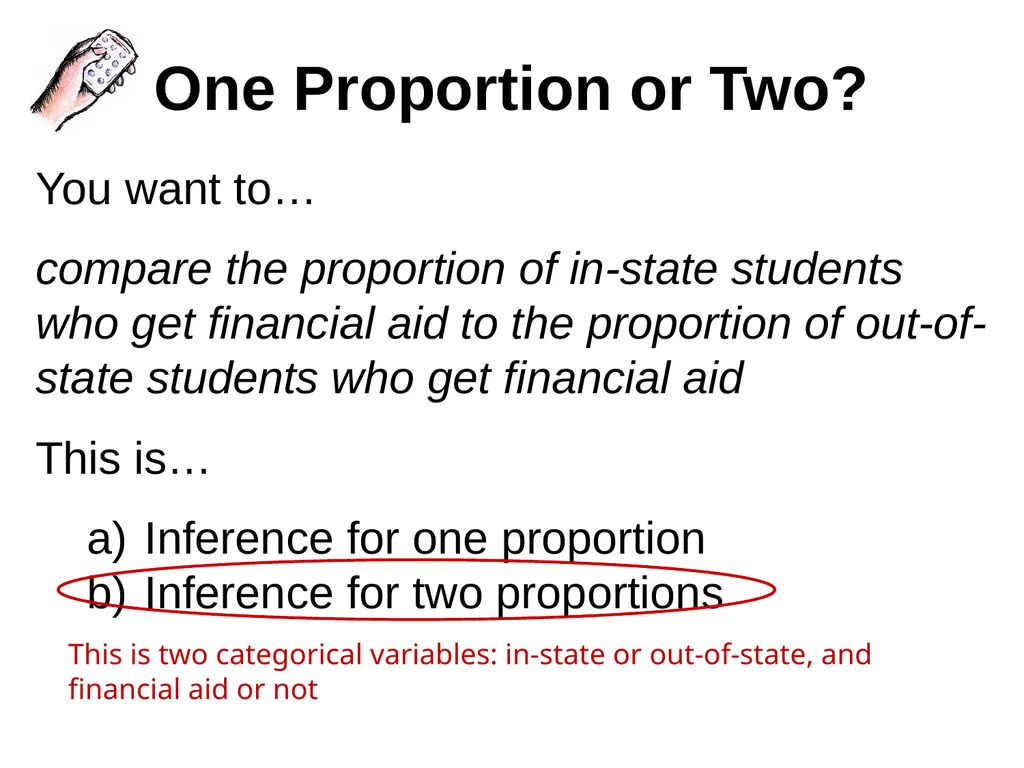
One Proportion or Two? You want to…
compare the proportion of in-state students who get financial aid to the proportion of out-of-state students who get financial aid
This is…
Inference for one proportion
Inference for two proportions This is two categorical variables: in-state or out-of-state, and financial aid or not<br>
compare the proportion of in-state students who get financial aid to the proportion of out-of-state students who get financial aid
This is…
Inference for one proportion
Inference for two proportions This is two categorical variables: in-state or out-of-state, and financial aid or not<br>
101
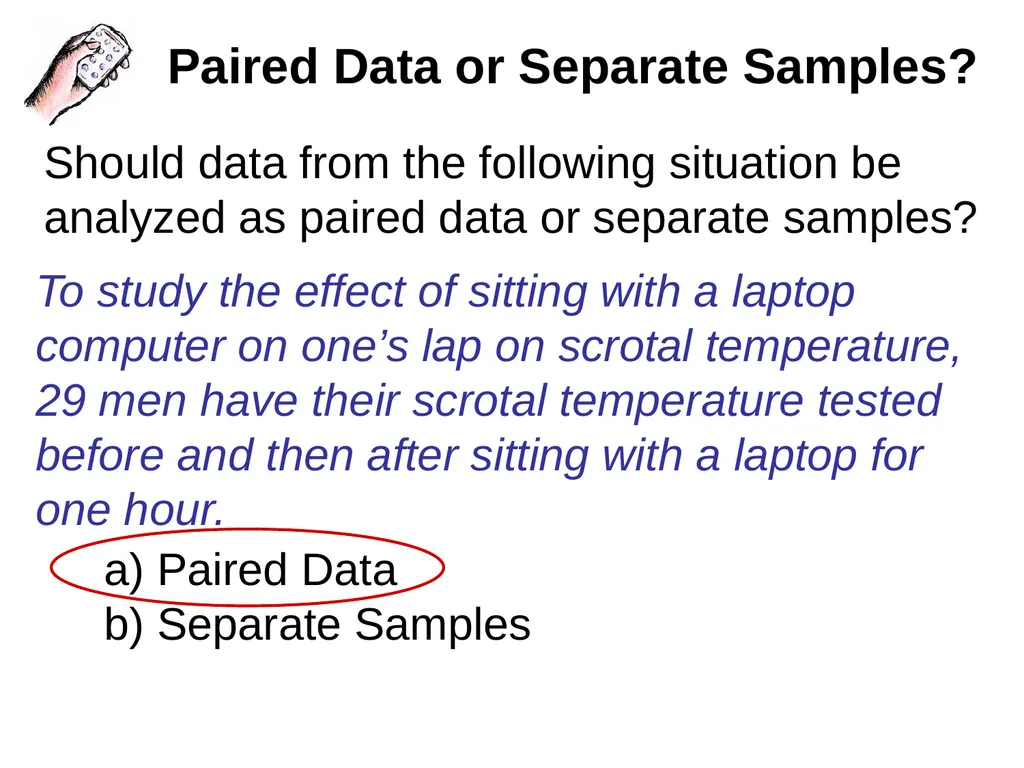
Paired Data or Separate Samples? Should data from the following situation be analyzed as paired data or separate samples? Paired Data
Separate Samples To study the effect of sitting with a laptop computer on one’s lap on scrotal temperature, 29 men have their scrotal temperature tested before and then after sitting with a laptop for one hour.<br>
Separate Samples To study the effect of sitting with a laptop computer on one’s lap on scrotal temperature, 29 men have their scrotal temperature tested before and then after sitting with a laptop for one hour.<br>
102
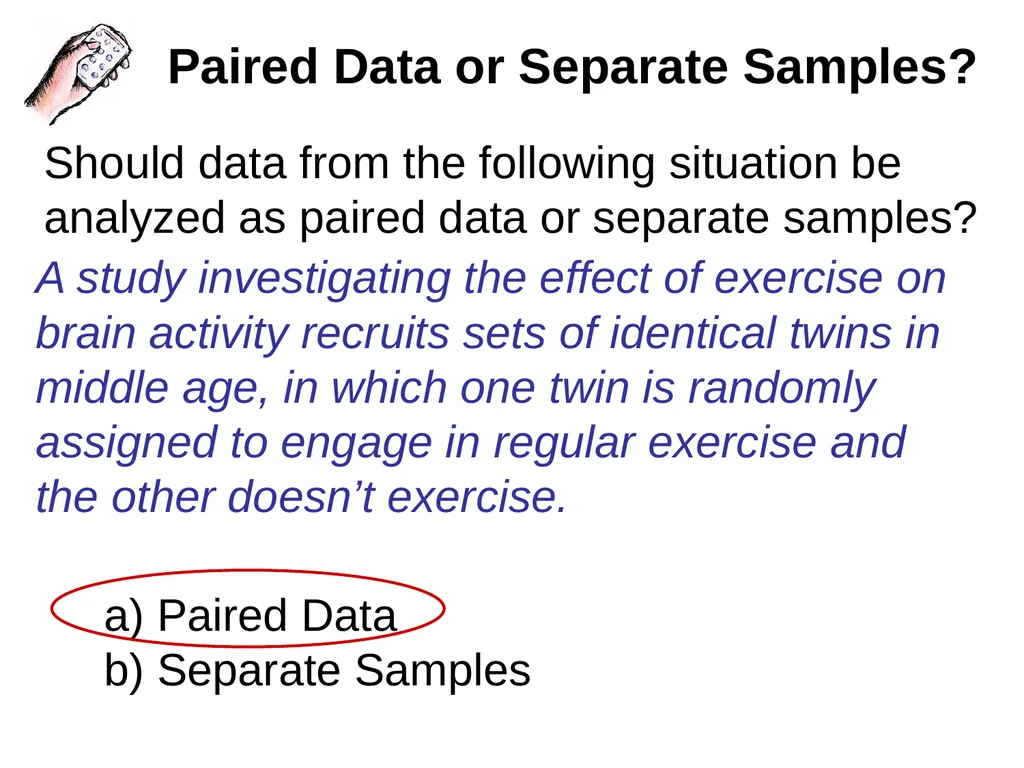
Paired Data or Separate Samples? Should data from the following situation be analyzed as paired data or separate samples? Paired Data
Separate Samples A study investigating the effect of exercise on brain activity recruits sets of identical twins in middle age, in which one twin is randomly assigned to engage in regular exercise and the other doesn’t exercise.<br>
Separate Samples A study investigating the effect of exercise on brain activity recruits sets of identical twins in middle age, in which one twin is randomly assigned to engage in regular exercise and the other doesn’t exercise.<br>
103
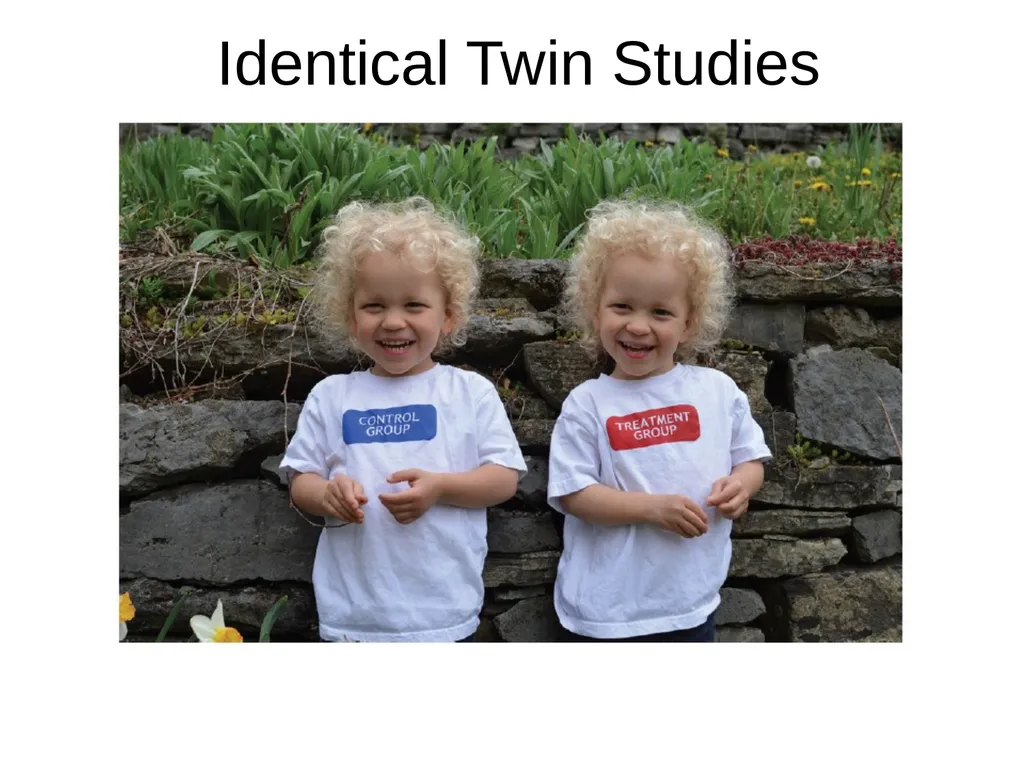
Identical Twin Studies<br>
104
Paired Data or Separate Samples? Should data from the following situation be analyzed as paired data or separate samples? Paired Data
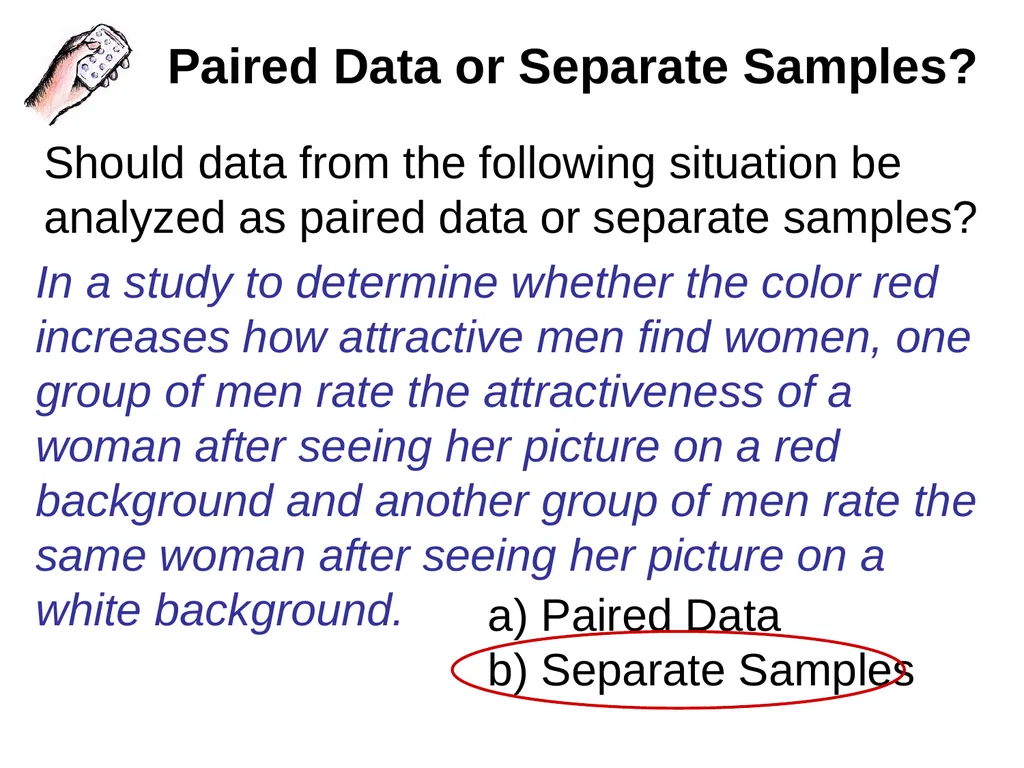
Separate Samples In a study to determine whether the color red increases how attractive men find women, one group of men rate the attractiveness of a woman after seeing her picture on a red background and another group of men rate the same woman after seeing her picture on a white background.<br>
Separate Samples In a study to determine whether the color red increases how attractive men find women, one group of men rate the attractiveness of a woman after seeing her picture on a red background and another group of men rate the same woman after seeing her picture on a white background.<br>
105
Paired Data or Separate Samples? Should data from the following situation be analyzed as paired data or separate samples? Paired Data
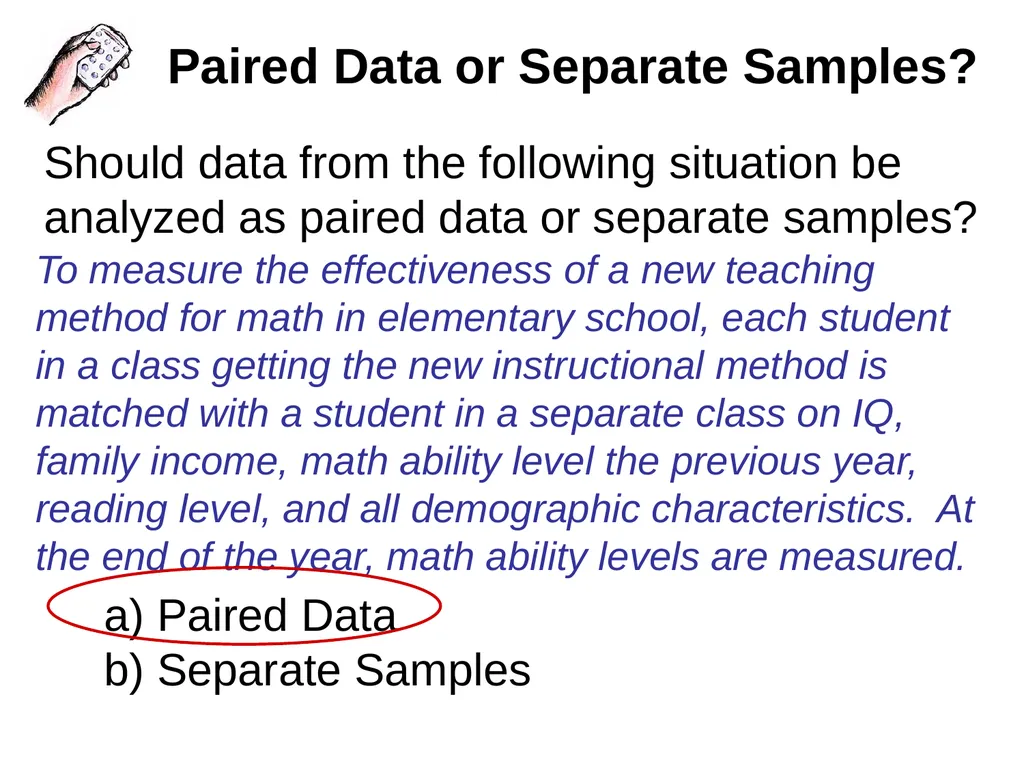
Separate Samples To measure the effectiveness of a new teaching method for math in elementary school, each student in a class getting the new instructional method is matched with a student in a separate class on IQ, family income, math ability level the previous year, reading level, and all demographic characteristics. At the end of the year, math ability levels are measured.<br>
Separate Samples To measure the effectiveness of a new teaching method for math in elementary school, each student in a class getting the new instructional method is matched with a student in a separate class on IQ, family income, math ability level the previous year, reading level, and all demographic characteristics. At the end of the year, math ability levels are measured.<br>
106
From the Bridge course….
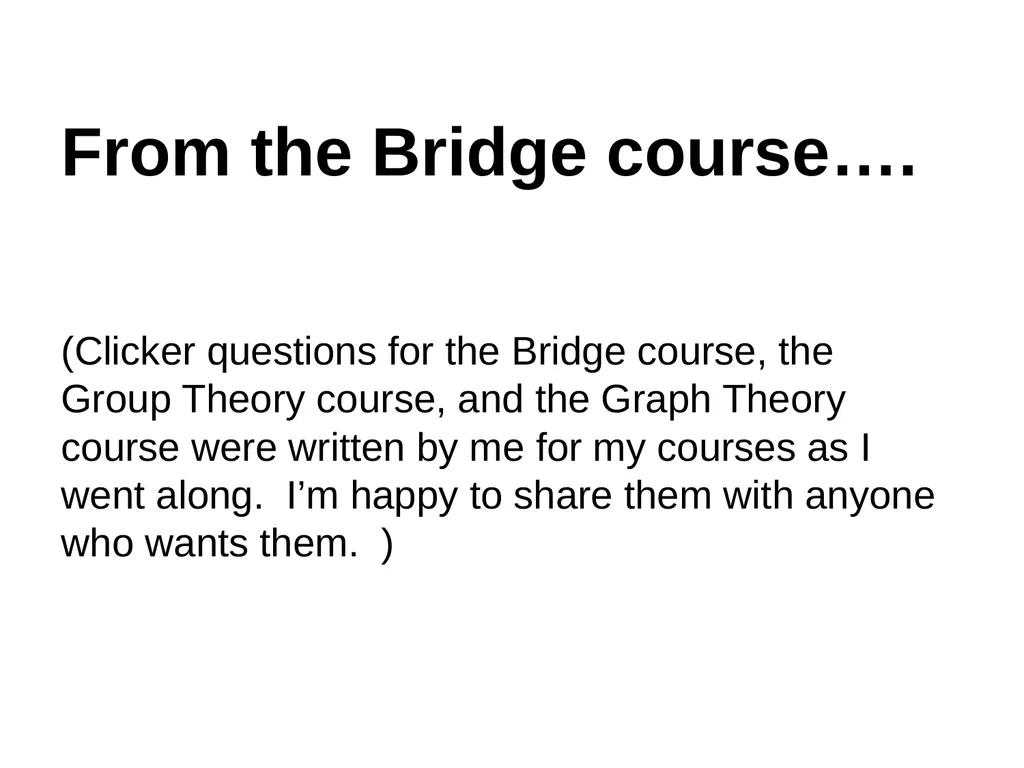
(Clicker questions for the Bridge course, the Group Theory course, and the Graph Theory course were written by me for my courses as I went along. I’m happy to share them with anyone who wants them. )<br>
(Clicker questions for the Bridge course, the Group Theory course, and the Graph Theory course were written by me for my courses as I went along. I’m happy to share them with anyone who wants them. )<br>
107
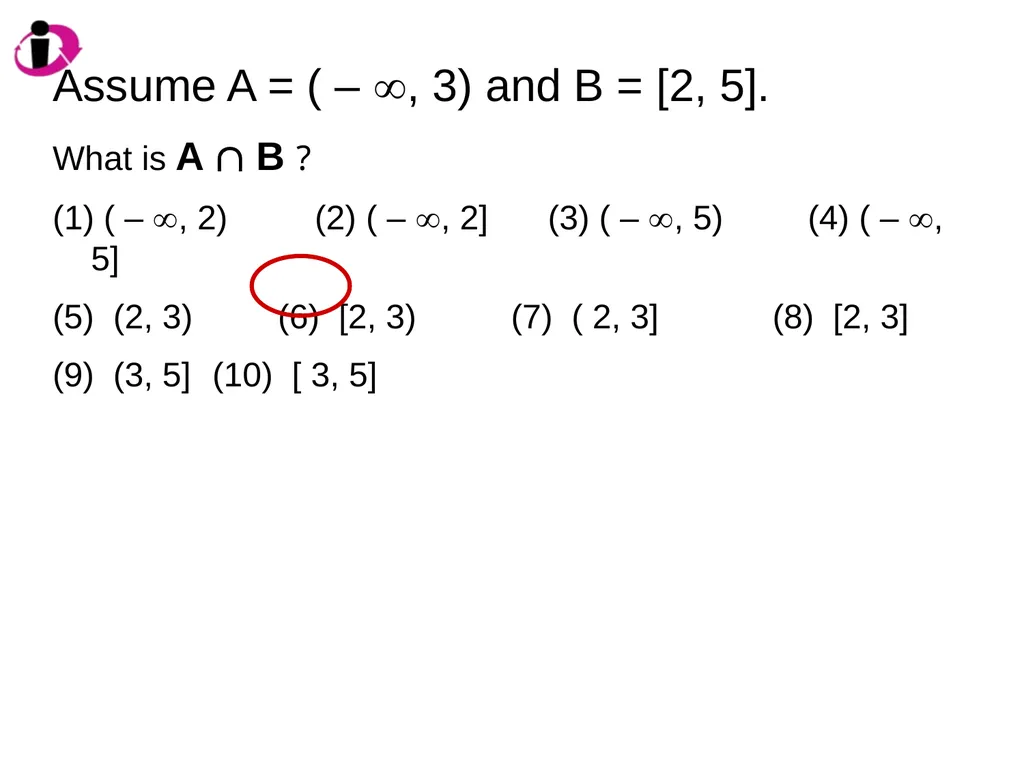
Assume A = ( – , 3) and B = [2, 5].
What is A B ?
( – , 2) (2) ( – , 2] (3) ( – , 5) (4) ( – , 5]
(5) (2, 3) (6) [2, 3) (7) ( 2, 3] (8) [2, 3]
(9) (3, 5] (10) [ 3, 5]<br>
What is A B ?
( – , 2) (2) ( – , 2] (3) ( – , 5) (4) ( – , 5]
(5) (2, 3) (6) [2, 3) (7) ( 2, 3] (8) [2, 3]
(9) (3, 5] (10) [ 3, 5]<br>
108
What is the first line of the proof?
If a divides b, then a divides b – c.
If a divides b, then a divides c.
Assume a divides b – c.
Assume a divides b and a divides c.
Assume a does not divide b and a does not divide c. If a divides b and a divides c, then a divides b – c.<br>
If a divides b, then a divides b – c.
If a divides b, then a divides c.
Assume a divides b – c.
Assume a divides b and a divides c.
Assume a does not divide b and a does not divide c. If a divides b and a divides c, then a divides b – c.<br>
109
What is the next line of the proof?
Then a must divide b – c.
Then a does not divide b – c.
Then b = ka and c = ka for some integer k.
Then b = ka and c = ja for some integers j and k.
Then a = kb and a = kc for some integer k.
Then a = kb and a = jc for some integers j and k. If a divides b and a divides c, then a divides b – c.<br>
Then a must divide b – c.
Then a does not divide b – c.
Then b = ka and c = ka for some integer k.
Then b = ka and c = ja for some integers j and k.
Then a = kb and a = kc for some integer k.
Then a = kb and a = jc for some integers j and k. If a divides b and a divides c, then a divides b – c.<br>
110
What is the next line of the proof?
Then b – c = ka.
Then division is distributive so a divides b – c.
Then a divides b – c.
Then k – j = …
Then b – c = …
Then a = … If a divides b and a divides c, then a divides b – c.<br>
Then b – c = ka.
Then division is distributive so a divides b – c.
Then a divides b – c.
Then k – j = …
Then b – c = …
Then a = … If a divides b and a divides c, then a divides b – c.<br>
111
What is the last line of the proof?
Then a divides b – c.
Then a does not divide b – c.
Then b = ka and c = ka for some integer k.
Then b = ka and c = ja for some integers j and k.
Then a = kb and a = kc for some integer k.
Then a = kb and a = jc for some integers j and k. If a divides b and a divides c, then a divides b – c.<br>
Then a divides b – c.
Then a does not divide b – c.
Then b = ka and c = ka for some integer k.
Then b = ka and c = ja for some integers j and k.
Then a = kb and a = kc for some integer k.
Then a = kb and a = jc for some integers j and k. If a divides b and a divides c, then a divides b – c.<br>
112
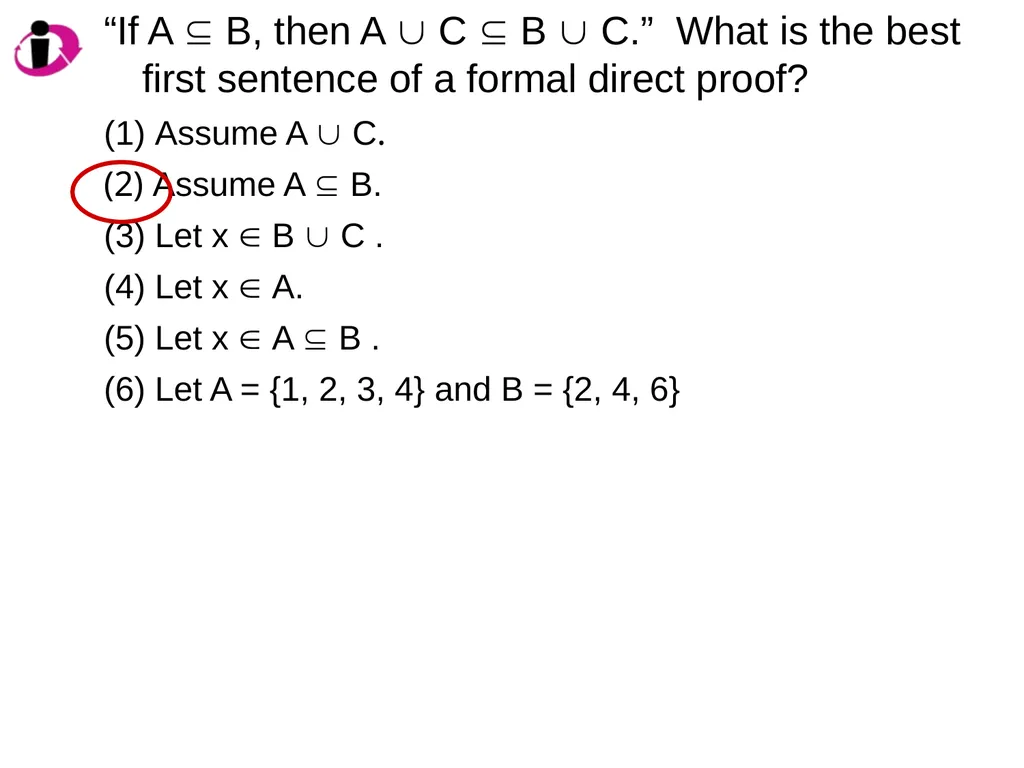
“If A B, then A C B C.” What is the best first sentence of a formal direct proof?
Assume A C.
Assume A B.
Let x B C .
Let x A.
Let x A B .
Let A = {1, 2, 3, 4} and B = {2, 4, 6}<br>
Assume A C.
Assume A B.
Let x B C .
Let x A.
Let x A B .
Let A = {1, 2, 3, 4} and B = {2, 4, 6}<br>
113
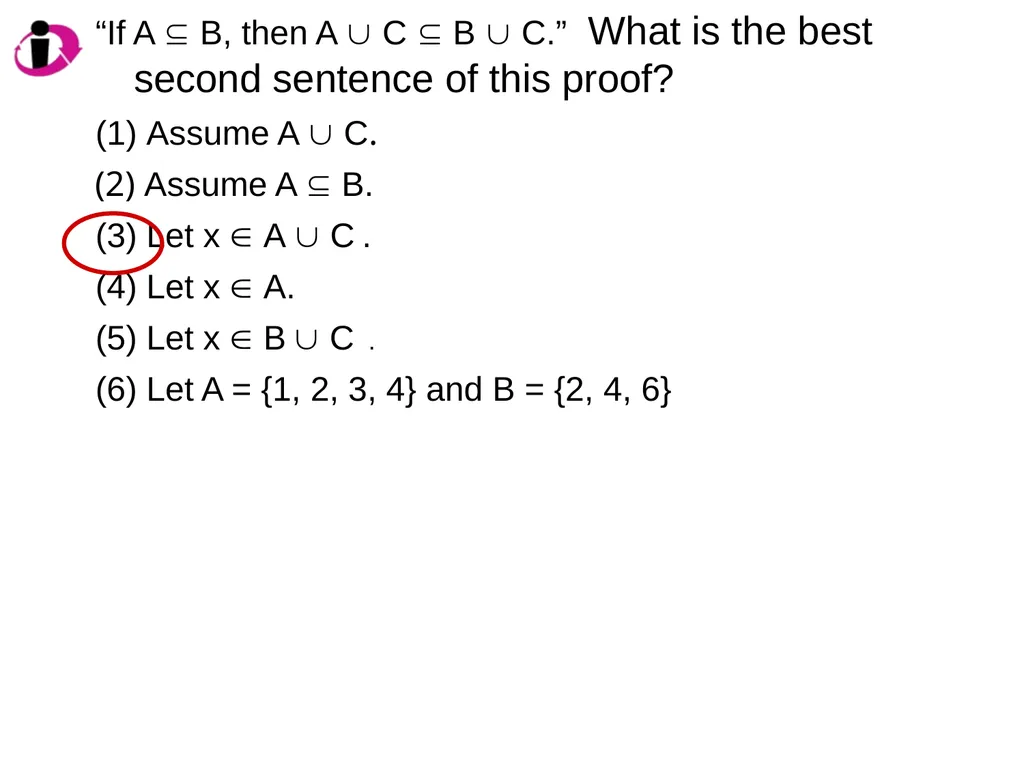
“If A B, then A C B C.” What is the best second sentence of this proof?
Assume A C.
Assume A B.
Let x A C .
Let x A.
Let x B C .
Let A = {1, 2, 3, 4} and B = {2, 4, 6}<br>
Assume A C.
Assume A B.
Let x A C .
Let x A.
Let x B C .
Let A = {1, 2, 3, 4} and B = {2, 4, 6}<br>
114
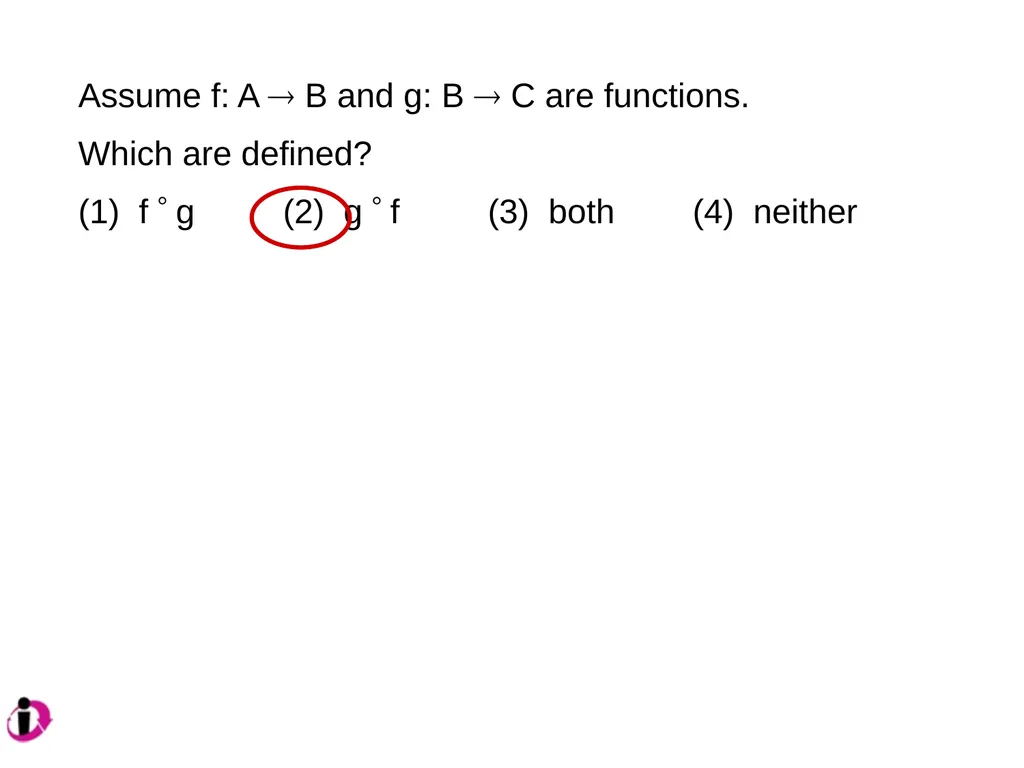
Assume f: A B and g: B C are functions.
Which are defined?
(1) f g (2) g f (3) both (4) neither<br>
Which are defined?
(1) f g (2) g f (3) both (4) neither<br>
115
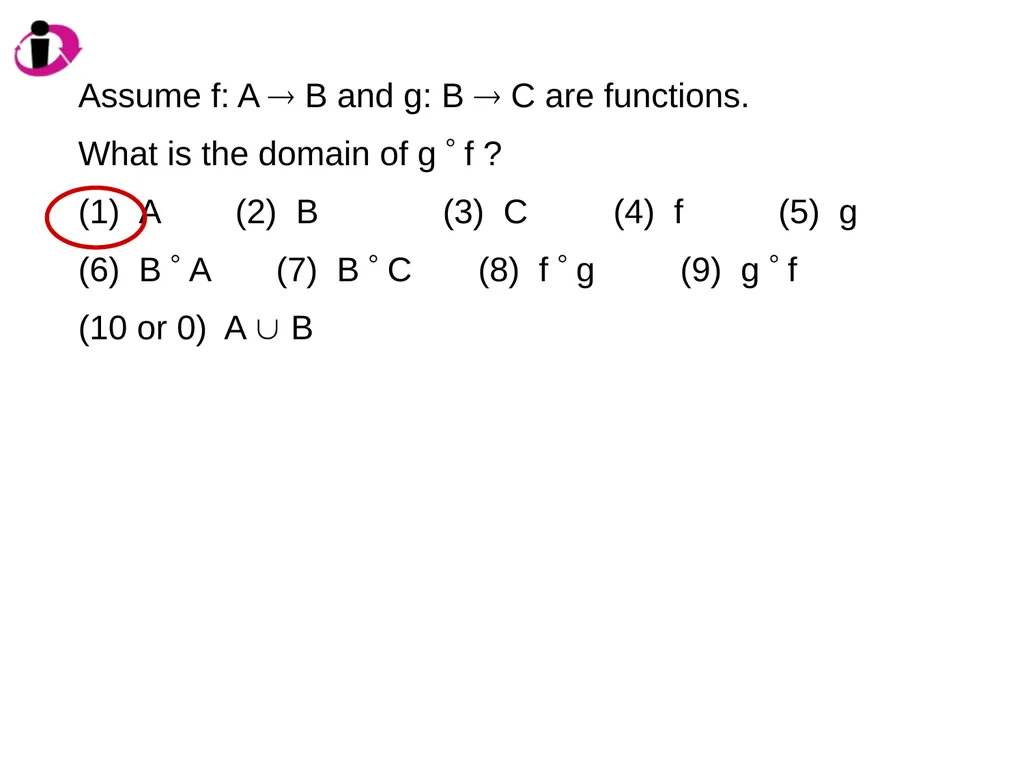
Assume f: A B and g: B C are functions.
What is the domain of g f ?
A (2) B (3) C (4) f (5) g
B A (7) B C (8) f g (9) g f
(10 or 0) A B<br>
What is the domain of g f ?
A (2) B (3) C (4) f (5) g
B A (7) B C (8) f g (9) g f
(10 or 0) A B<br>
116
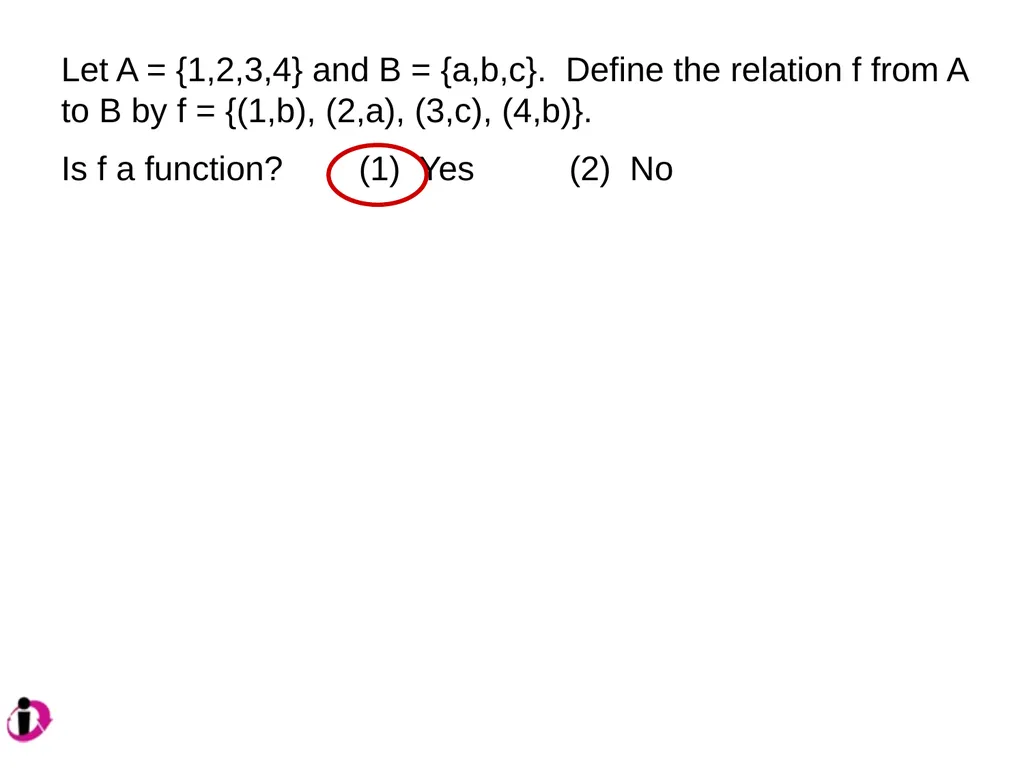
Let A = {1,2,3,4} and B = {a,b,c}. Define the relation f from A to B by f = {(1,b), (2,a), (3,c), (4,b)}.
Is f a function? (1) Yes (2) No<br>
Is f a function? (1) Yes (2) No<br>
117
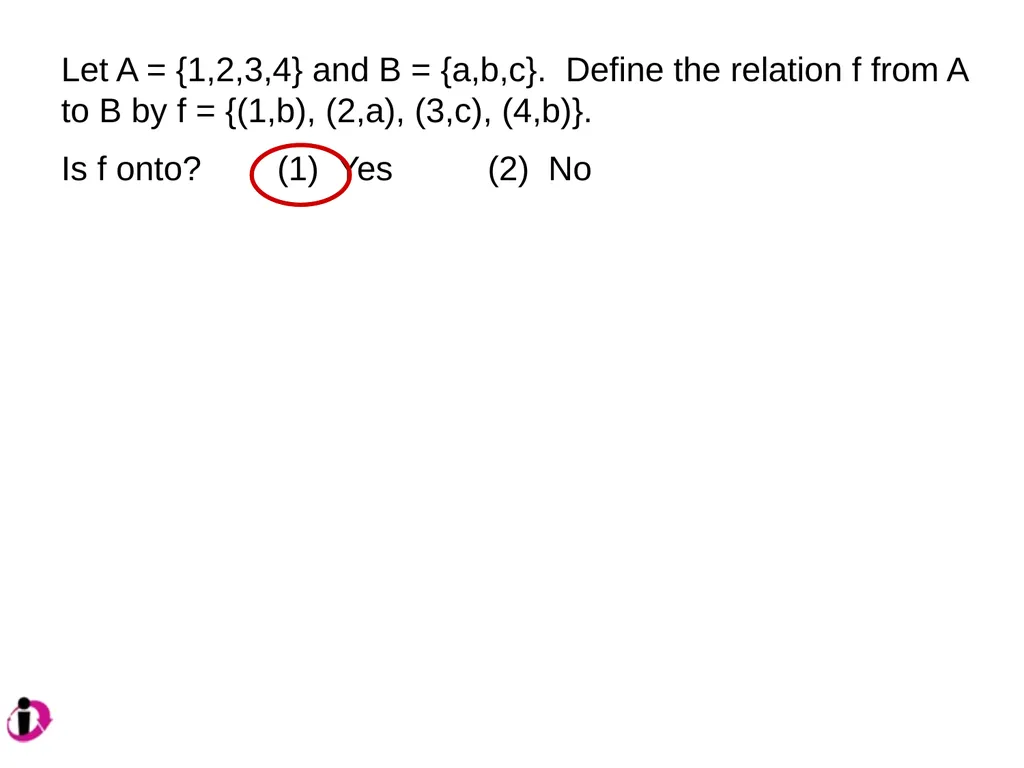
Let A = {1,2,3,4} and B = {a,b,c}. Define the relation f from A to B by f = {(1,b), (2,a), (3,c), (4,b)}.
Is f onto? (1) Yes (2) No<br>
Is f onto? (1) Yes (2) No<br>
118
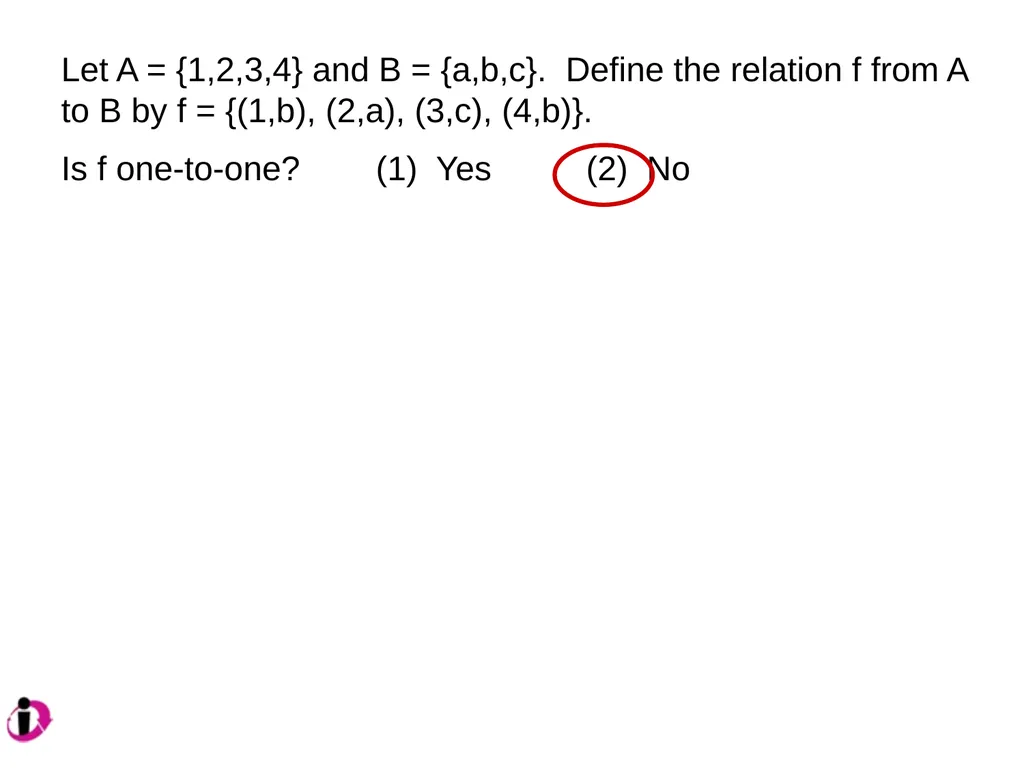
Let A = {1,2,3,4} and B = {a,b,c}. Define the relation f from A to B by f = {(1,b), (2,a), (3,c), (4,b)}.
Is f one-to-one? (1) Yes (2) No<br>
Is f one-to-one? (1) Yes (2) No<br>
119
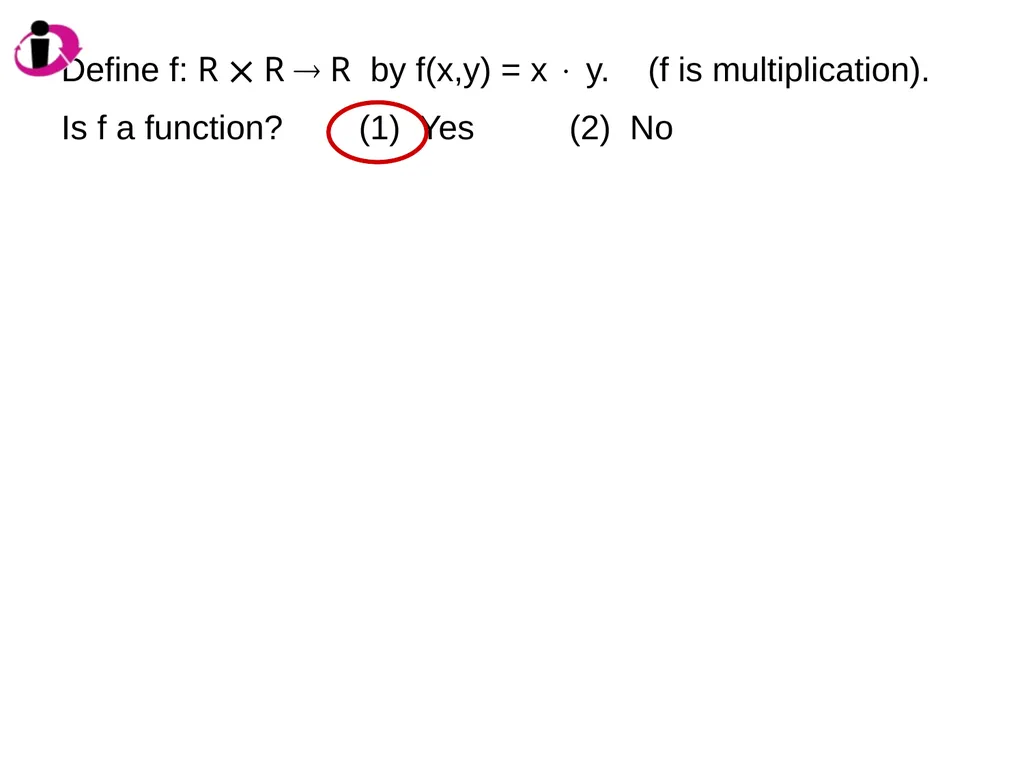
Define f: R R R by f(x,y) = x y. (f is multiplication).
Is f a function? (1) Yes (2) No<br>
Is f a function? (1) Yes (2) No<br>
120
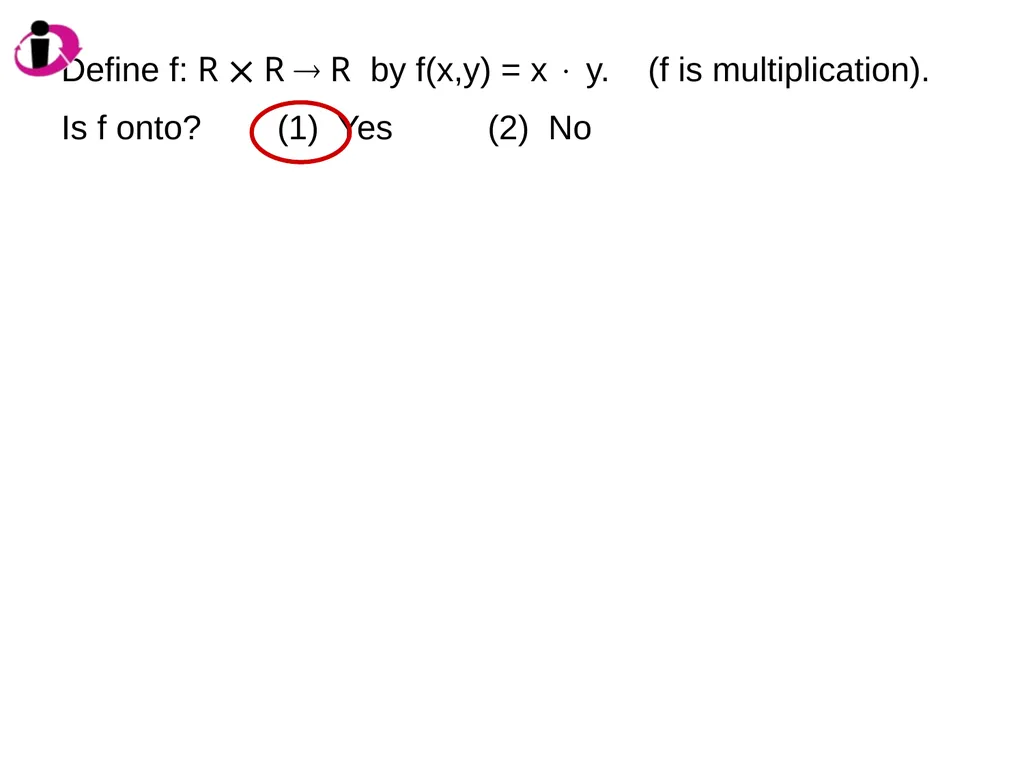
Define f: R R R by f(x,y) = x y. (f is multiplication).
Is f onto? (1) Yes (2) No<br>
Is f onto? (1) Yes (2) No<br>
121
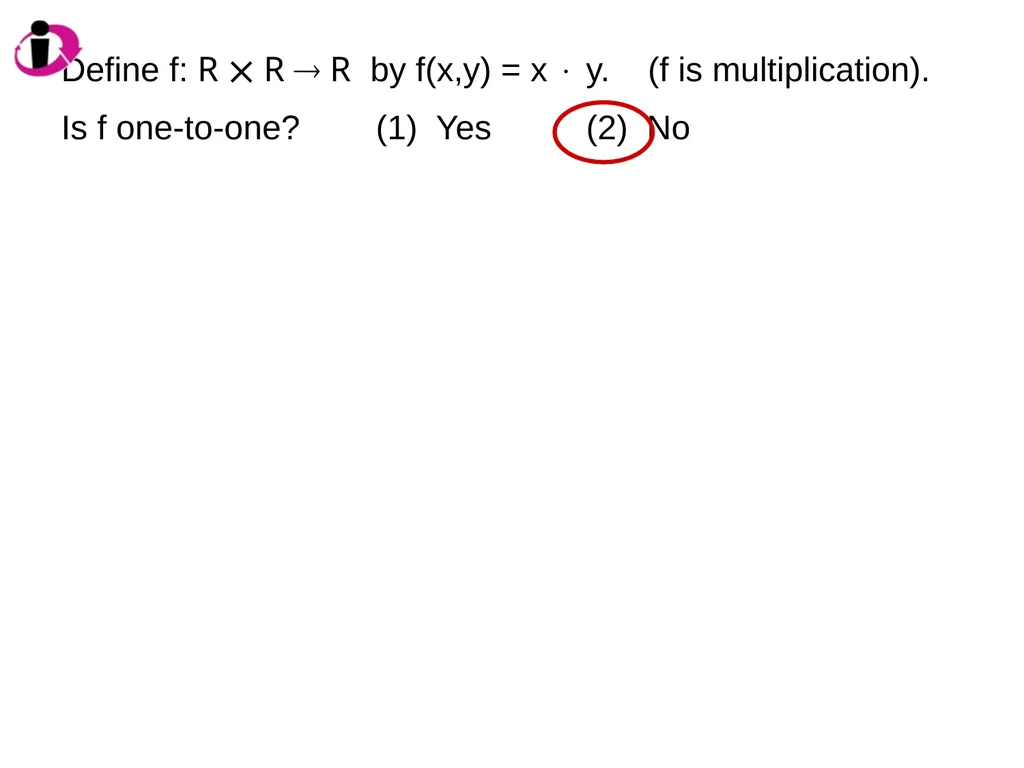
Define f: R R R by f(x,y) = x y. (f is multiplication).
Is f one-to-one? (1) Yes (2) No<br>
Is f one-to-one? (1) Yes (2) No<br>
122
From the Group Theory course….
(Again, questions homegrown and available to any who want them.)<br>
(Again, questions homegrown and available to any who want them.)<br>
123
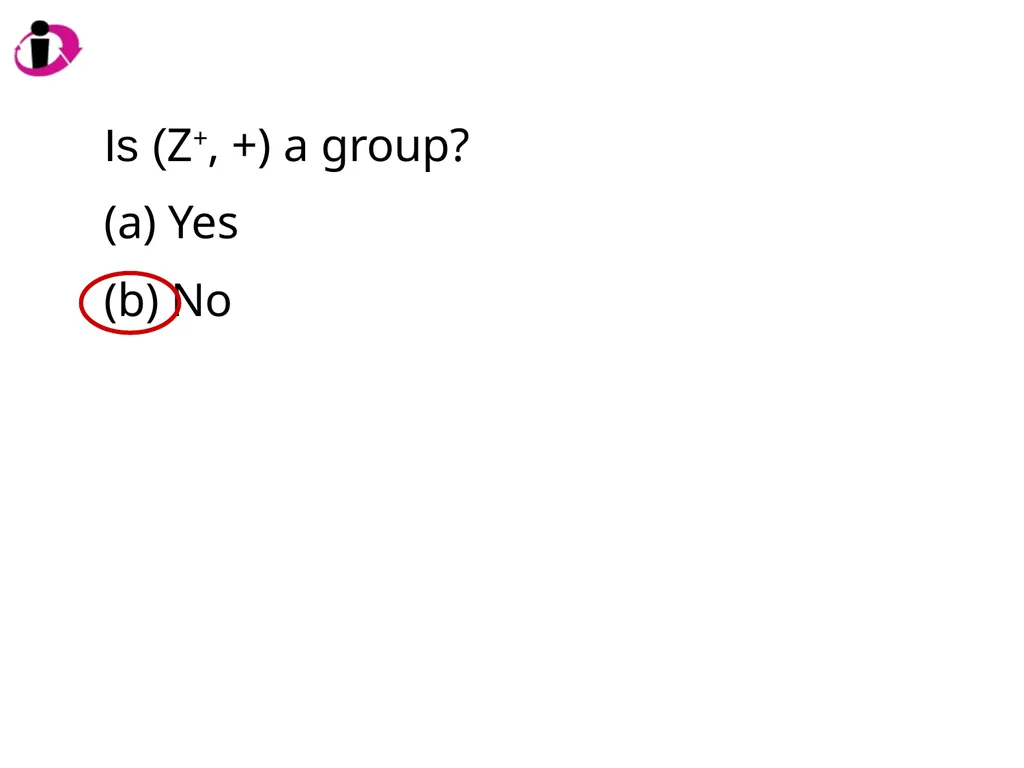
Is (Z+, +) a group?
Yes
No<br>
Yes
No<br>
124
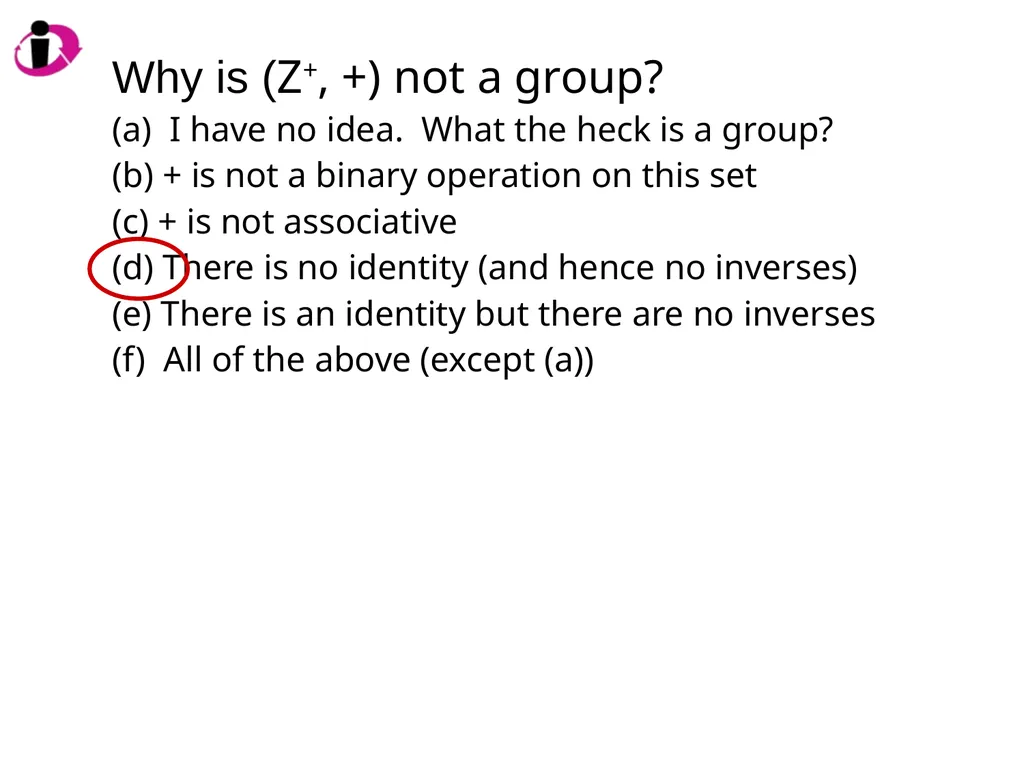
Why is (Z+, +) not a group?
(a) I have no idea. What the heck is a group?
(b) + is not a binary operation on this set
(c) + is not associative
(d) There is no identity (and hence no inverses)
(e) There is an identity but there are no inverses
(f) All of the above (except (a))<br>
(a) I have no idea. What the heck is a group?
(b) + is not a binary operation on this set
(c) + is not associative
(d) There is no identity (and hence no inverses)
(e) There is an identity but there are no inverses
(f) All of the above (except (a))<br>
125
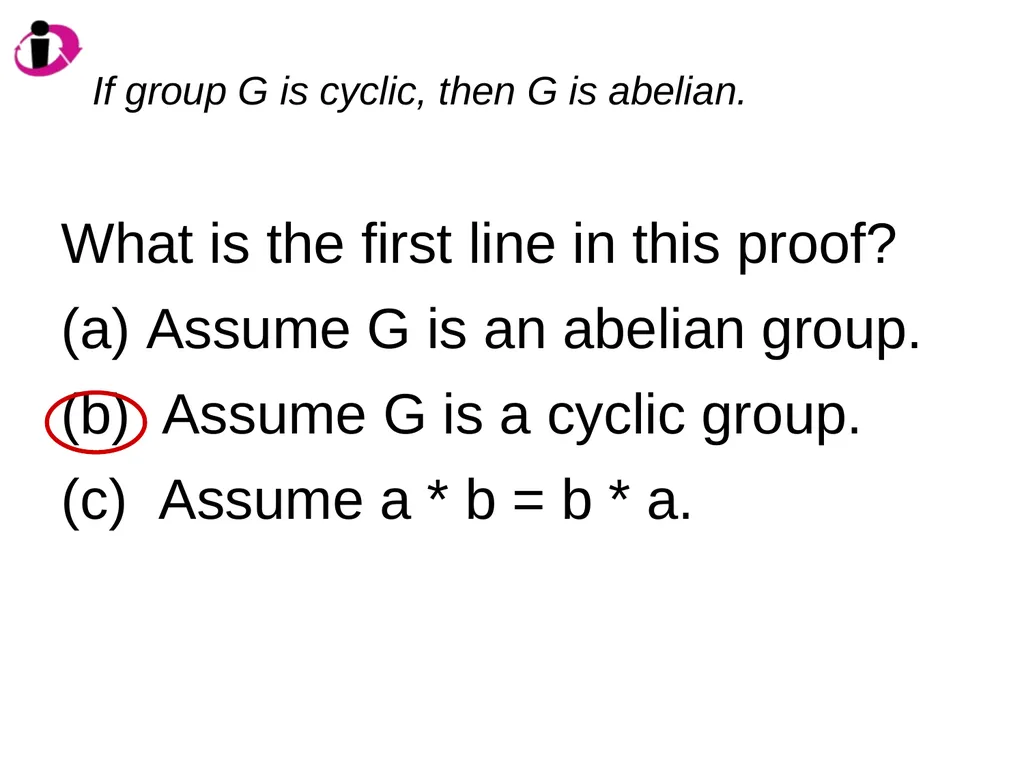
What is the first line in this proof?
Assume G is an abelian group.
Assume G is a cyclic group.
Assume a * b = b * a. If group G is cyclic, then G is abelian.<br>
Assume G is an abelian group.
Assume G is a cyclic group.
Assume a * b = b * a. If group G is cyclic, then G is abelian.<br>
126
What is the next line in this proof?
Then G is abelian.
Then G contains inverses.
Then a * b = b * a for all a, b in G.
Then G = <x> for some x in G. If group G is cyclic, then G is abelian.<br>
Then G is abelian.
Then G contains inverses.
Then a * b = b * a for all a, b in G.
Then G = <x> for some x in G. If group G is cyclic, then G is abelian.<br>
127
What is the next line in this proof?
Choose any two elements of G.
Then G has finite order.
Then a * b = b * a for all a, b in G.
Choose any element x and its inverse. If group G is cyclic, then G is abelian.<br>
Choose any two elements of G.
Then G has finite order.
Then a * b = b * a for all a, b in G.
Choose any element x and its inverse. If group G is cyclic, then G is abelian.<br>
128
What is the last line in this proof?
Thus G is abelian.
Thus G contains inverses.
Therefore G is cyclic.
Then G has primary order. If group G is cyclic, then G is abelian.<br>
Thus G is abelian.
Thus G contains inverses.
Therefore G is cyclic.
Then G has primary order. If group G is cyclic, then G is abelian.<br>
129
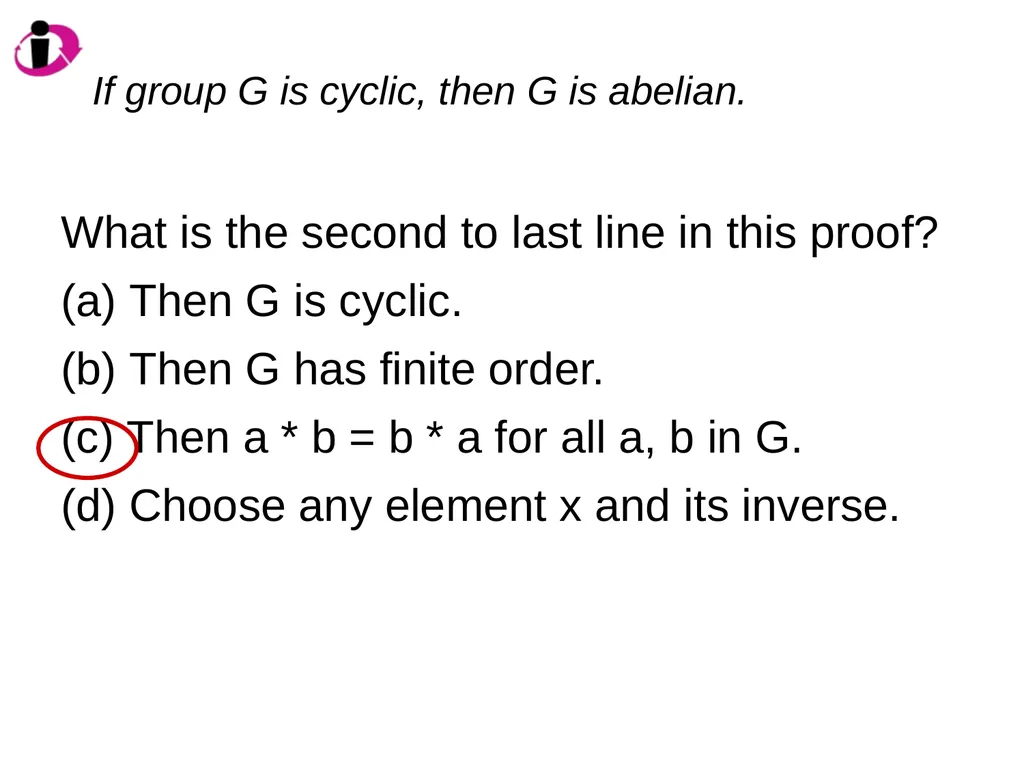
What is the second to last line in this proof?
Then G is cyclic.
Then G has finite order.
Then a * b = b * a for all a, b in G.
Choose any element x and its inverse. If group G is cyclic, then G is abelian.<br>
Then G is cyclic.
Then G has finite order.
Then a * b = b * a for all a, b in G.
Choose any element x and its inverse. If group G is cyclic, then G is abelian.<br>
130
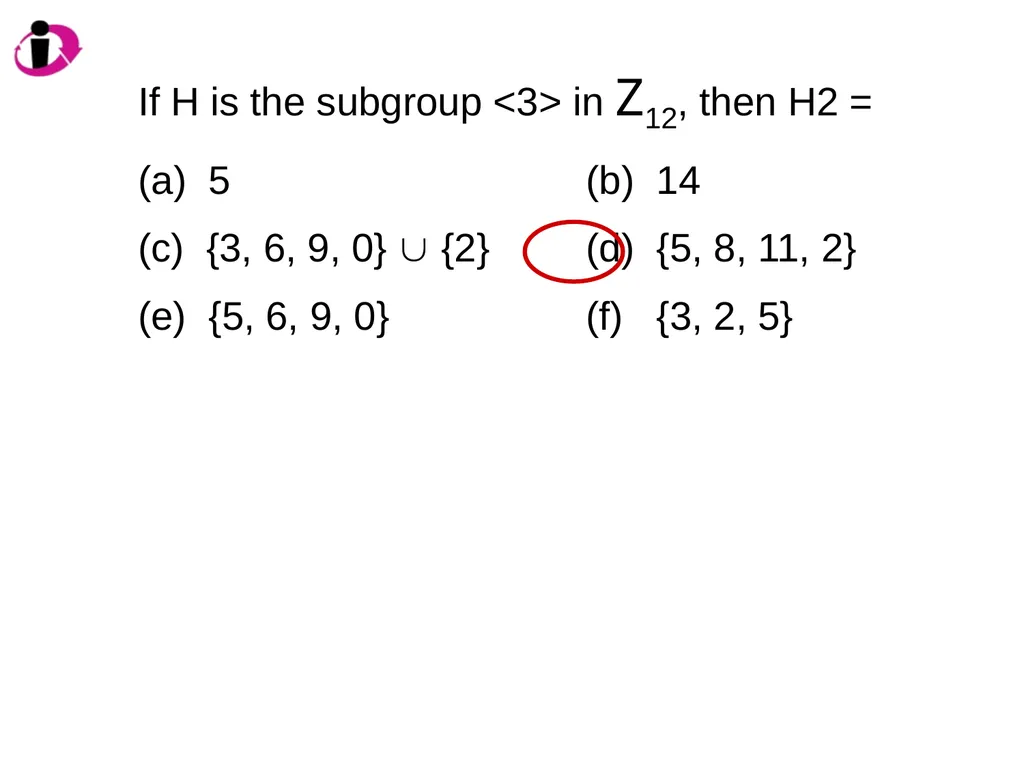
If H is the subgroup <3> in Z12, then H2 =
5 (b) 14
{3, 6, 9, 0} {2} (d) {5, 8, 11, 2}
(e) {5, 6, 9, 0} (f) {3, 2, 5}<br>
5 (b) 14
{3, 6, 9, 0} {2} (d) {5, 8, 11, 2}
(e) {5, 6, 9, 0} (f) {3, 2, 5}<br>
131
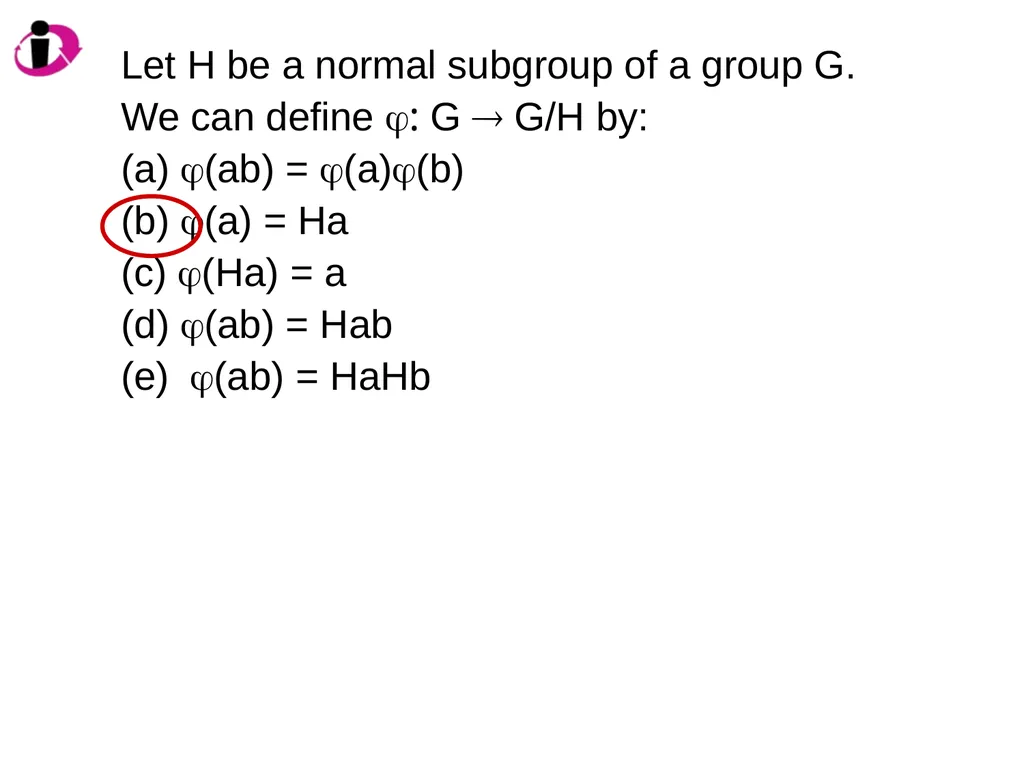
Let H be a normal subgroup of a group G.
We can define : G G/H by:
(ab) = (a)(b)
(a) = Ha
(Ha) = a
(ab) = Hab
(e) (ab) = HaHb<br>
We can define : G G/H by:
(ab) = (a)(b)
(a) = Ha
(Ha) = a
(ab) = Hab
(e) (ab) = HaHb<br>
132
From the Graph Theory course….
(Again, questions homegrown and available to any who want them.)<br>
(Again, questions homegrown and available to any who want them.)<br>
133
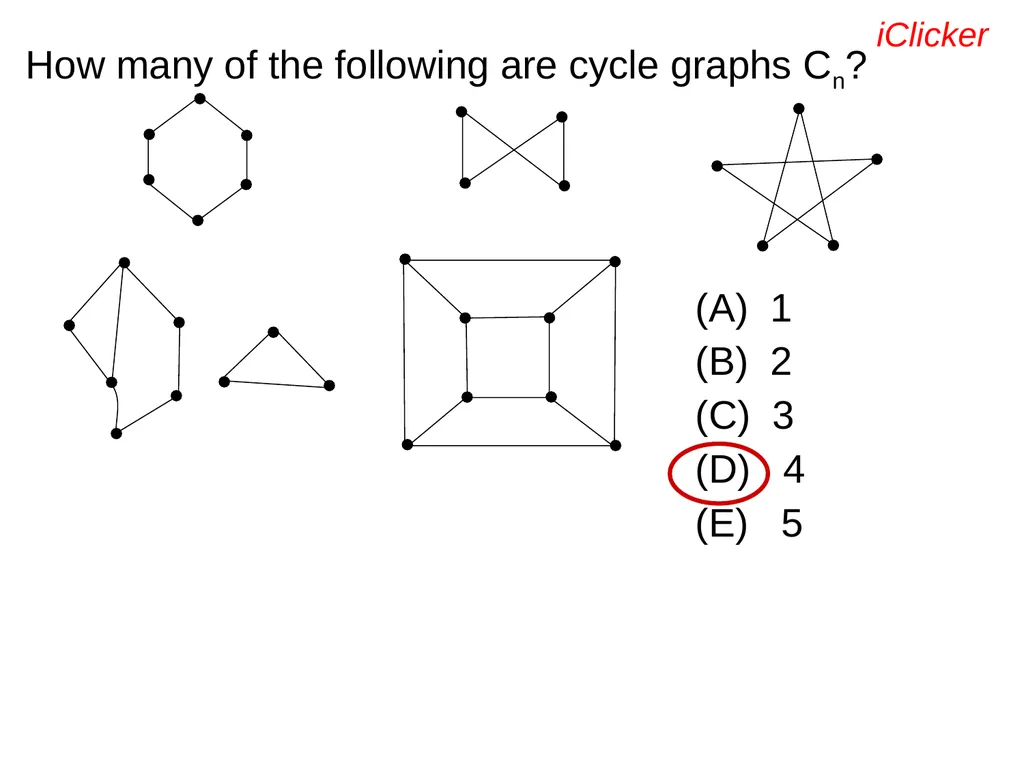
How many of the following are cycle graphs Cn? (A) 1
(B) 2
(C) 3
(D) 4
(E) 5 iClicker<br>
(B) 2
(C) 3
(D) 4
(E) 5 iClicker<br>
134
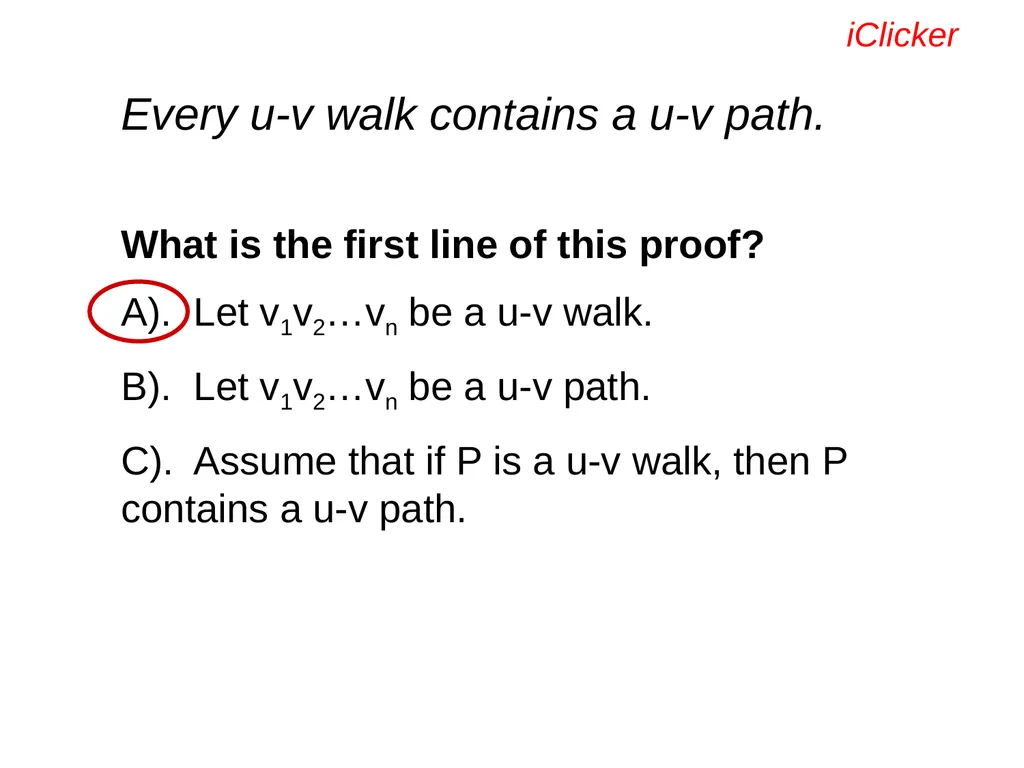
What is the first line of this proof?
A). Let v1v2…vn be a u-v walk.
B). Let v1v2…vn be a u-v path.
C). Assume that if P is a u-v walk, then P contains a u-v path. iClicker Every u-v walk contains a u-v path.<br>
A). Let v1v2…vn be a u-v walk.
B). Let v1v2…vn be a u-v path.
C). Assume that if P is a u-v walk, then P contains a u-v path. iClicker Every u-v walk contains a u-v path.<br>
135
What is the first line of this proof?
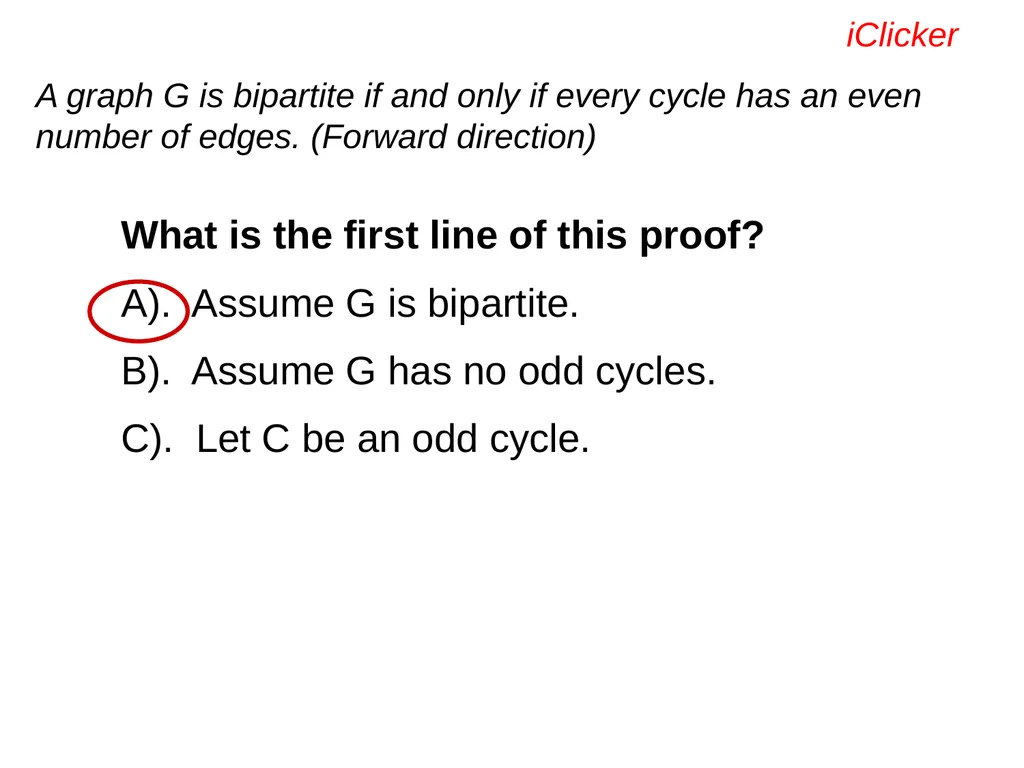
A). Assume G is bipartite.
B). Assume G has no odd cycles.
C). Let C be an odd cycle. iClicker A graph G is bipartite if and only if every cycle has an even number of edges. (Forward direction)<br>
A). Assume G is bipartite.
B). Assume G has no odd cycles.
C). Let C be an odd cycle. iClicker A graph G is bipartite if and only if every cycle has an even number of edges. (Forward direction)<br>
136
What is the next line of this proof?
A). Assume C is an even cycle.
B). Assume G has no odd cycles.
C). Let C be an odd cycle.
D). Let C be any cycle.
E). Assume that there are no even cycles. iClicker A graph G is bipartite if and only if every cycle has an even number of edges. (Forward direction)<br>
A). Assume C is an even cycle.
B). Assume G has no odd cycles.
C). Let C be an odd cycle.
D). Let C be any cycle.
E). Assume that there are no even cycles. iClicker A graph G is bipartite if and only if every cycle has an even number of edges. (Forward direction)<br>
137
What is the first line of this proof?
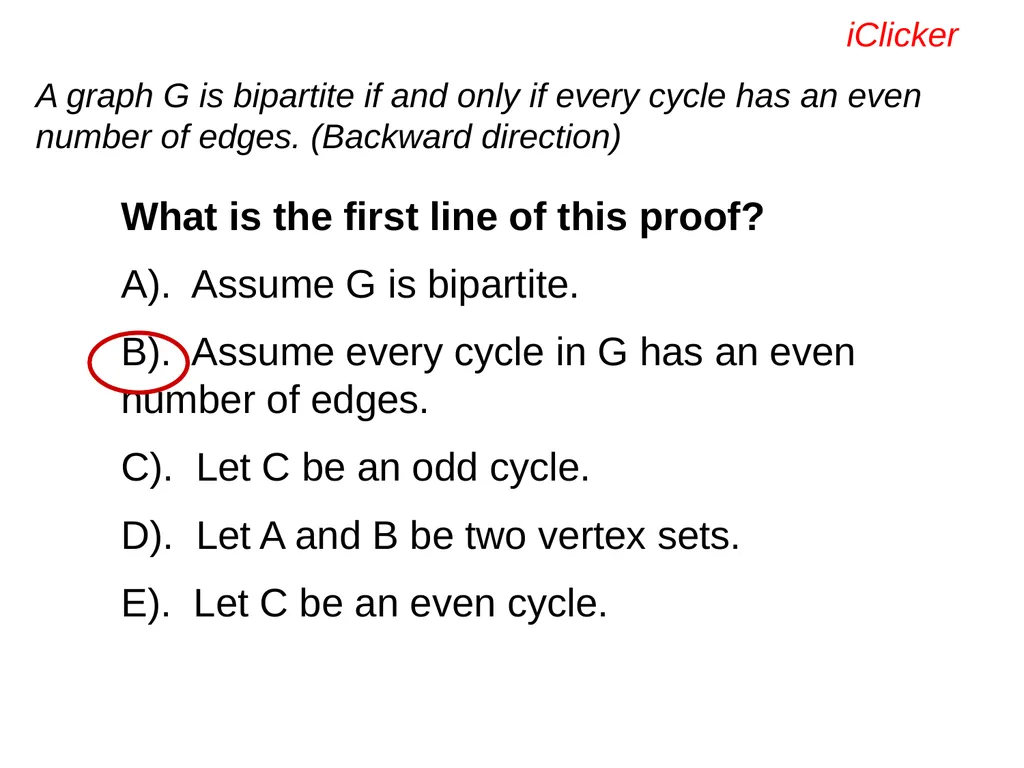
A). Assume G is bipartite.
B). Assume every cycle in G has an even number of edges.
C). Let C be an odd cycle.
D). Let A and B be two vertex sets.
E). Let C be an even cycle. iClicker A graph G is bipartite if and only if every cycle has an even number of edges. (Backward direction)<br>
A). Assume G is bipartite.
B). Assume every cycle in G has an even number of edges.
C). Let C be an odd cycle.
D). Let A and B be two vertex sets.
E). Let C be an even cycle. iClicker A graph G is bipartite if and only if every cycle has an even number of edges. (Backward direction)<br>
138
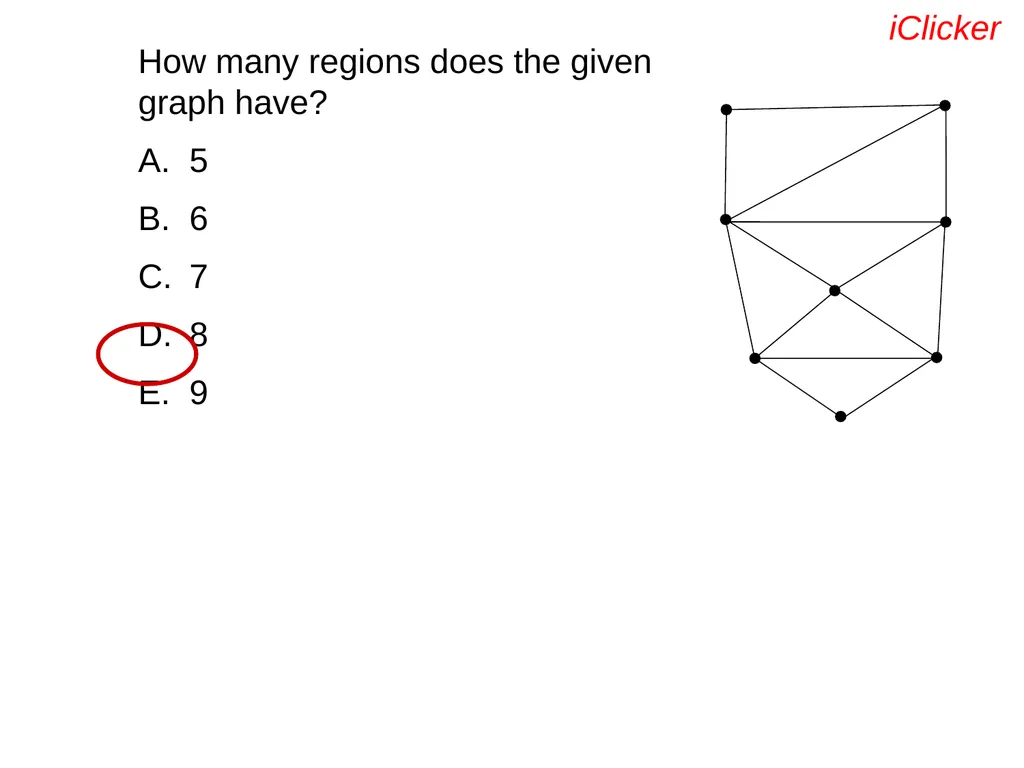
How many regions does the given graph have?
5
6
7
8
9 iClicker<br>
5
6
7
8
9 iClicker<br>
139
And some fun ones where all answers get credit…..<br>
140
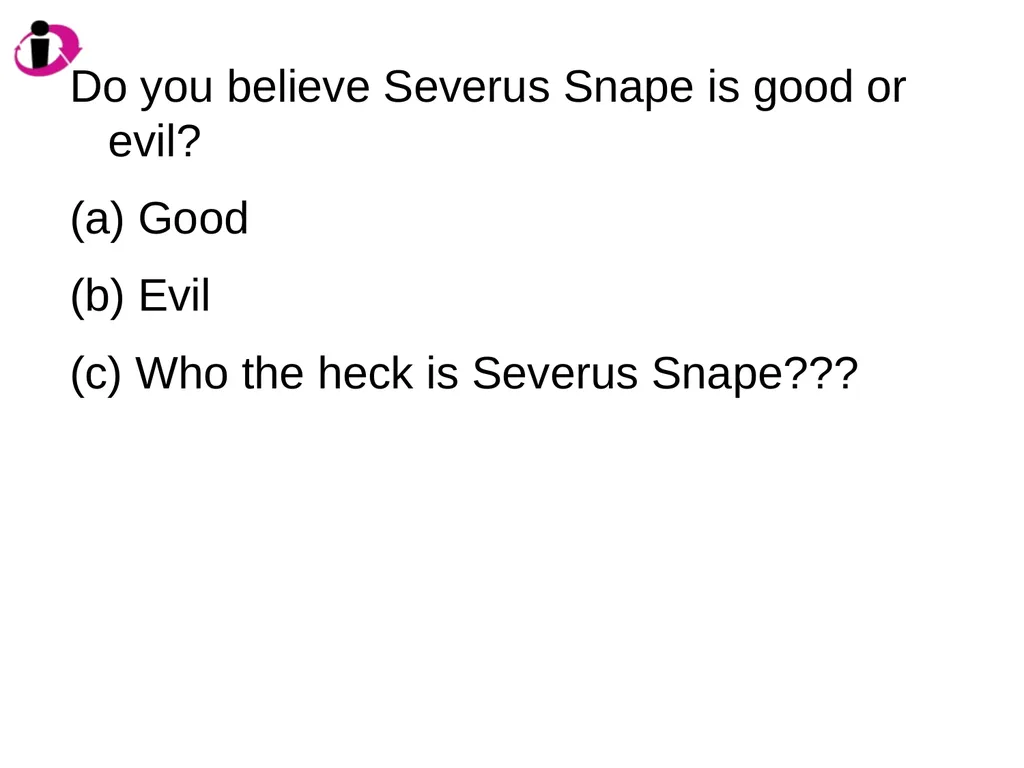
Do you believe Severus Snape is good or evil?
Good
Evil
Who the heck is Severus Snape???<br>
Good
Evil
Who the heck is Severus Snape???<br>
141
Thank you! plock@stlawu.edu
www.lock5stat.com<br>
www.lock5stat.com<br>