Exploring the Mangrove Use of bioindicators for mangrove assessment Mangrove Protocol Proposal Geneviéve Sontowinggolo Project coordinator Green Heritage Fund Suriname Suriname Background information Photo by Geneviéve Sontowinggolo
"Exploring the Mangrove Use of bioindicators for" is the property of its rightful owner. Permission is granted to
download and print the materials on this website for personal, non-commercial use only, and to display it
on your personal computer provided you do not modify the materials and that you retain all copyright
notices contained in the materials. By downloading content from our website, you accept the terms of this
agreement.
Presentation Transcript
01
Exploring the Mangrove
Use of bioindicators for mangrove assessment<br>
02
Mangrove Protocol Proposal Geneviéve Sontowinggolo
Project coordinator
Green Heritage Fund Suriname
Suriname<br>
03
Background information Photo by Geneviéve Sontowinggolo Mangrove ecosystems face increasing threats from human disturbance and environmental change, necessitating regular health assessments to inform management and restoration. Bio indicators, organisms, or ecological attributes sensitive to environmental conditions offer a practical and scientifically validated means for communities to monitor ecosystem health.<br>
04
Objective To enable communities to assess mangrove health using bio indicators, detect degradation early, and guide conservation through accessible, science-based monitoring. Monitor key ecological parameters:
Vegetation structure
Faunal diversity
Abiotic conditions Detect early signs of degradation:
Reduced seedling density
Shifts in crab abundance
Bird diversity loss Empower communities with actionable data to guide conservation efforts and adaptive management practices Foster long-term stewardship by integrating local ecological knowledge with systematic monitoring frameworks<br>
05
Bio indicators used for this assessment Indicators selected based on their:
Representativeness: Accurately reflects ecosystem health and responds to both natural and anthropogenic changes.
Systematicity: Scientifically validated, with clear definitions and relevance to key ecosystem functions.
Feasibility: Practical for community monitoring, requiring minimal specialized equipment or training. Key bio indicators for mangrove health include:
Bird diversity: Sensitive to habitat quality and structural complexity.
Crab activity: Abundance and diversity of burrowing crabs, which influence soil aeration and nutrient cycling.
Water and sediment quality: Simple visual or rapid tests for water and sediment characteristics.<br>
06
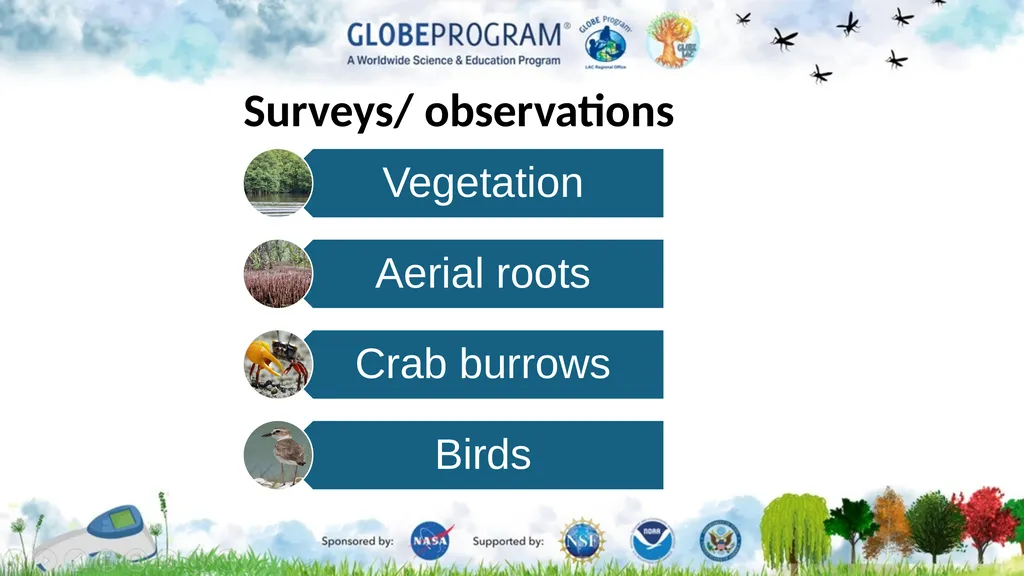
Surveys/ observations<br>
07
Vegetation Survey Objective:
To assess mangrove ecosystem health by quantifying tree species composition, generational structure (seedling, young, or adult), and the presence of aerial roots within a defined survey area. Data Collection
Step 1: Choose and Mark Your Plot
Find a representative spot:
Use local knowledge and, if possible, aerial photos or maps to pick a spot that resembles your mangrove area (not too close to the edge or a disturbed site).
Measure out a 10×10 meter square:
Use a tape measure, rope, or marked sticks. Mark the four corners clearly (e.g., with stakes, flags, or painted stones).
Record the location:
Write down a description and, if possible, take GPS coordinates so you can find the same spot again.
Why This Design?
Easy to learn and repeat, no special equipment or technical skills needed.
Captures key changes in mangrove health and regeneration.
Builds ownership and understanding within the community, increasing the likelihood of long-term conservation success.
Flexible: Can be adapted to include additional indicators (e.g., crab holes, litter, or birds) if the community is interested<br>
08
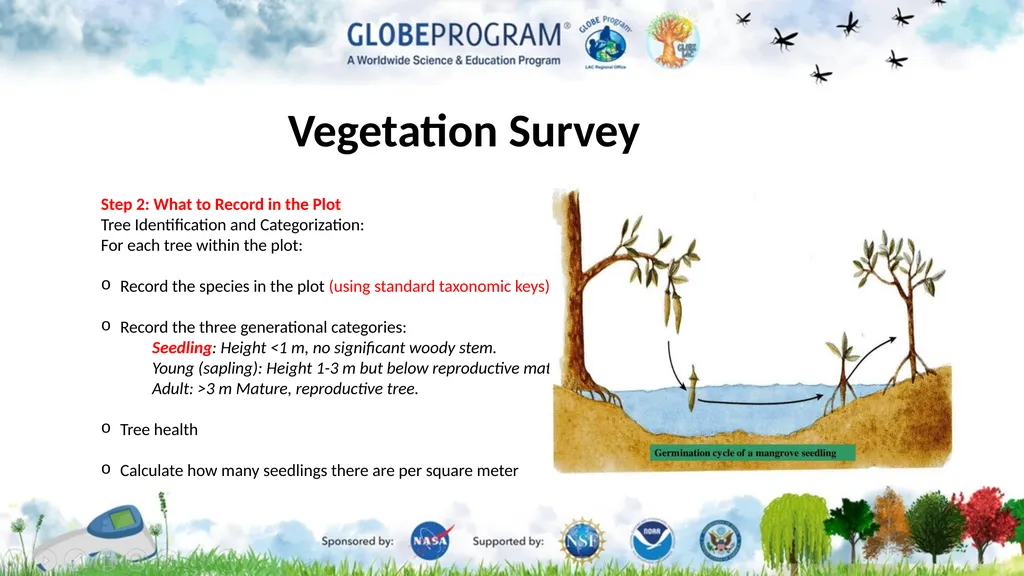
Vegetation Survey Step 2: What to Record in the Plot
Tree Identification and Categorization:
For each tree within the plot:
Record the species in the plot (using standard taxonomic keys).
Record the three generational categories:
Seedling: Height <1 m, no significant woody stem.
Young (sapling): Height 1-3 m but below reproductive maturity.
Adult: >3 m Mature, reproductive tree.
Tree health
Calculate how many seedlings there are per square meter<br>
09
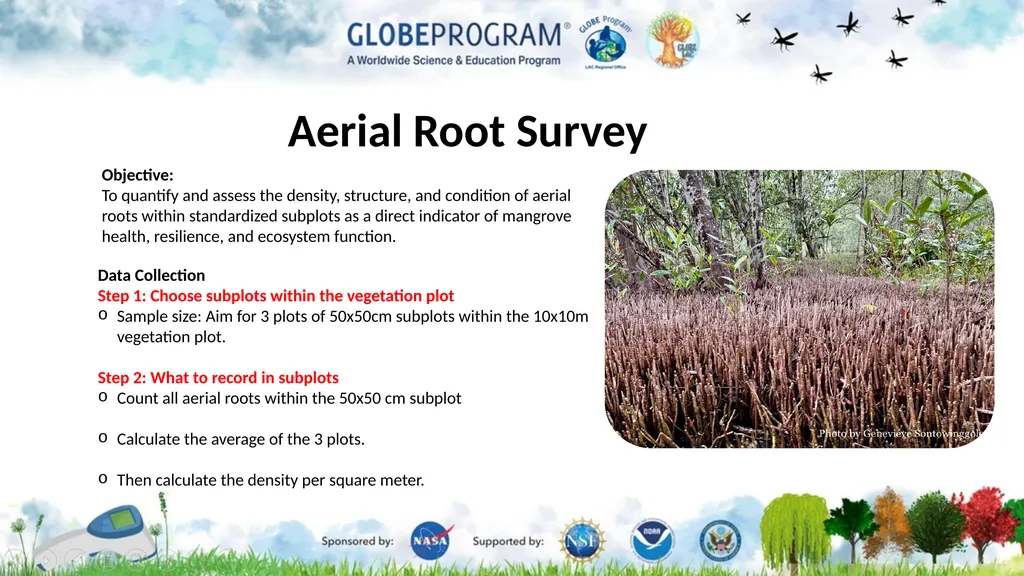
Aerial Root Survey Data Collection
Step 1: Choose subplots within the vegetation plot
Sample size: Aim for 3 plots of 50x50cm subplots within the 10x10m vegetation plot.
Step 2: What to record in subplots
Count all aerial roots within the 50x50 cm subplot
Calculate the average of the 3 plots.
Then calculate the density per square meter. Objective:
To quantify and assess the density, structure, and condition of aerial roots within standardized subplots as a direct indicator of mangrove health, resilience, and ecosystem function.<br>
10
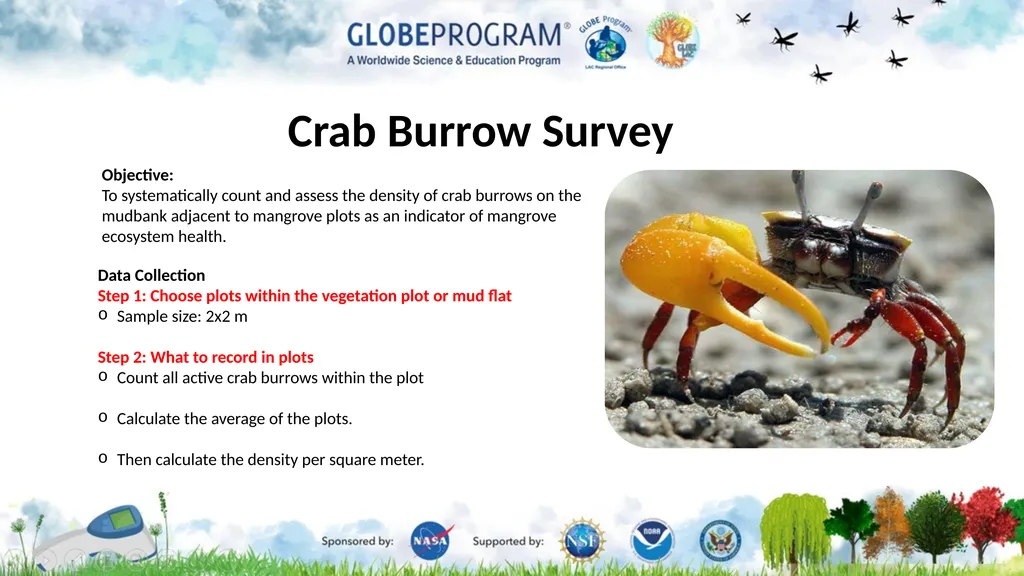
Crab Burrow Survey Data Collection
Step 1: Choose plots within the vegetation plot or mud flat
Sample size: 2x2 m
Step 2: What to record in plots
Count all active crab burrows within the plot
Calculate the average of the plots.
Then calculate the density per square meter. Objective:
To systematically count and assess the density of crab burrows on the mudbank adjacent to mangrove plots as an indicator of mangrove ecosystem health.<br>
11
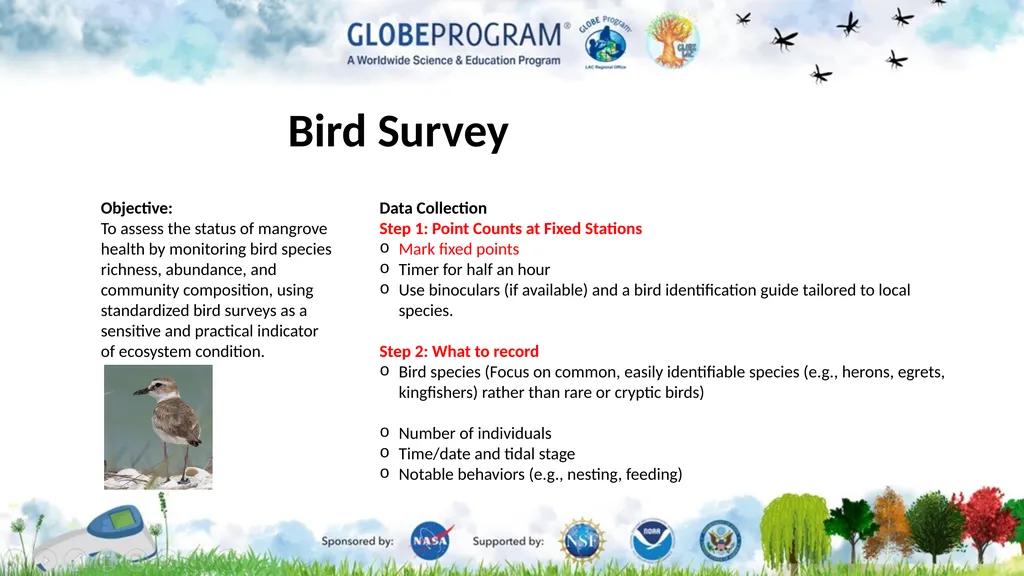
Bird Survey Data Collection
Step 1: Point Counts at Fixed Stations
Mark fixed points
Timer for half an hour
Use binoculars (if available) and a bird identification guide tailored to local species.
Step 2: What to record
Bird species (Focus on common, easily identifiable species (e.g., herons, egrets, kingfishers) rather than rare or cryptic birds)
Number of individuals
Time/date and tidal stage
Notable behaviors (e.g., nesting, feeding) Objective:
To assess the status of mangrove health by monitoring bird species richness, abundance, and community composition, using standardized bird surveys as a sensitive and practical indicator of ecosystem condition.<br>
12
Mangroves Committee Por favor agregar una foto suya con sus nombres debajo. Geneviéve Sontowinggolo
Developer of mangrove protocol
Trainer
Suriname<br>