
Finding Meaning in Our Measures: Overcoming

Description: Finding Meaning in Our Measures: Overcoming Challenges to Quantitative Food Security USDA Economic Research Service February 9, 2015 Food Security As Resilience: Reconciling Definition And Measurement Empirical Example from Northern Kenya
Related Topics
Download Presentation
"Finding Meaning in Our Measures: Overcoming" is the property of its rightful owner. Permission is granted to download and print the materials on this website for personal, non-commercial use only, and to display it on your personal computer provided you do not modify the materials and that you retain all copyright notices contained in the materials. By downloading content from our website, you accept the terms of this agreement.
Presentation Transcript
slide1. Finding Meaning in Our Measures: Overcoming Challenges to Quantitative Food Security
USDA
Economic Research Service
February 9, 2015 Food Security As Resilience: Reconciling Definition And Measurement Empirical Example from Northern Kenya Joanna Upton, Jenn Cissé and Chris Barrett The Dyson School, Cornell University<br>
slide2. Implement the Barrett and Constas (2014) framework following a decomposable poverty measure approach
Prevalence of food (in)security, or population with an acceptable probability of falling (below)above a given health/nutrition threshold over time
For individuals or any aggregate (entire sample, female-headed households, specific livelihood group…)
Satisfies all four axioms of food security measurement
Can then be used to measure impacts of shocks or interventions Motivation<br>
slide3. To implement, need to make (at least) two normative statements:
Level – An acceptable standard of well-being, for an individual or population
e.g. individual MUAC ≥ 125mm;
and/or < 10% of population with MUAC < 125mm
Probability – An acceptable ikelihood of meeting that standard of well-being
These must be set by prior research, analysis of context, comparing to other measures, etc. Measurement<br>
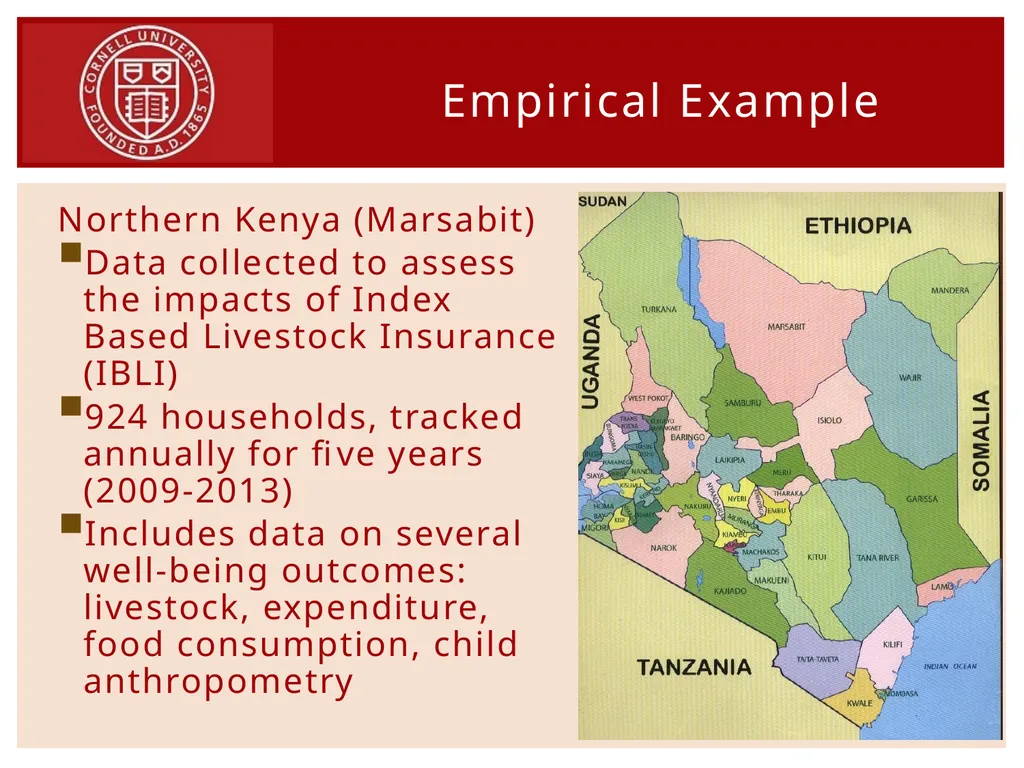
slide4. Northern Kenya (Marsabit)
Data collected to assess the impacts of Index Based Livestock Insurance (IBLI)
924 households, tracked annually for five years (2009-2013)
Includes data on several well-being outcomes: livestock, expenditure, food consumption, child anthropometry Empirical Example<br>
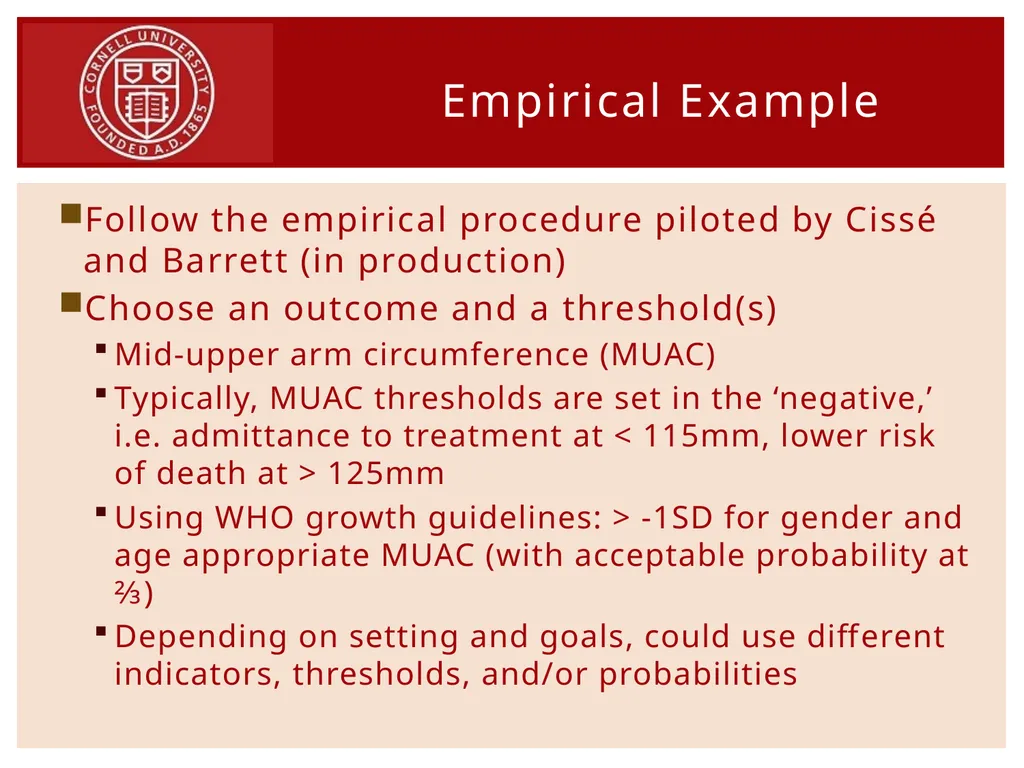
slide5. Follow the empirical procedure piloted by Cissé and Barrett (in production)
Choose an outcome and a threshold(s)
Mid-upper arm circumference (MUAC)
Typically, MUAC thresholds are set in the ‘negative,’ i.e. admittance to treatment at < 115mm, lower risk of death at > 125mm
Using WHO growth guidelines: > -1SD for gender and age appropriate MUAC (with acceptable probability at ⅔)
Depending on setting and goals, could use different indicators, thresholds, and/or probabilities Empirical Example<br>
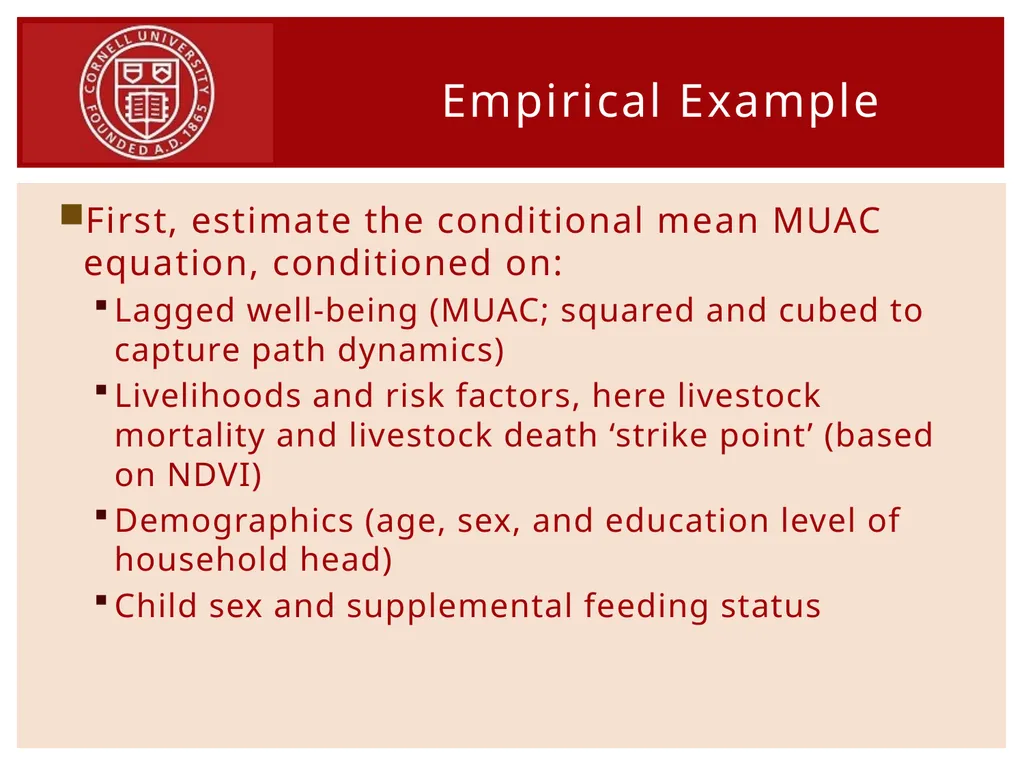
slide6. First, estimate the conditional mean MUAC equation, conditioned on:
Lagged well-being (MUAC; squared and cubed to capture path dynamics)
Livelihoods and risk factors, here livestock mortality and livestock death ‘strike point’ (based on NDVI)
Demographics (age, sex, and education level of household head)
Child sex and supplemental feeding status Empirical Example<br>
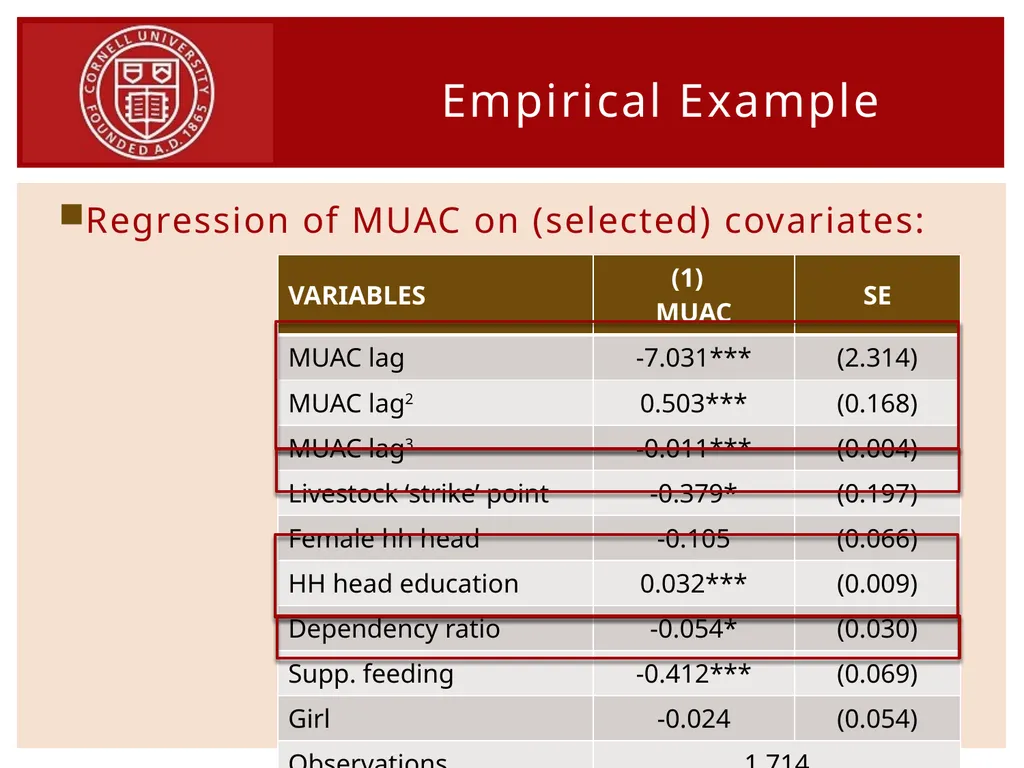
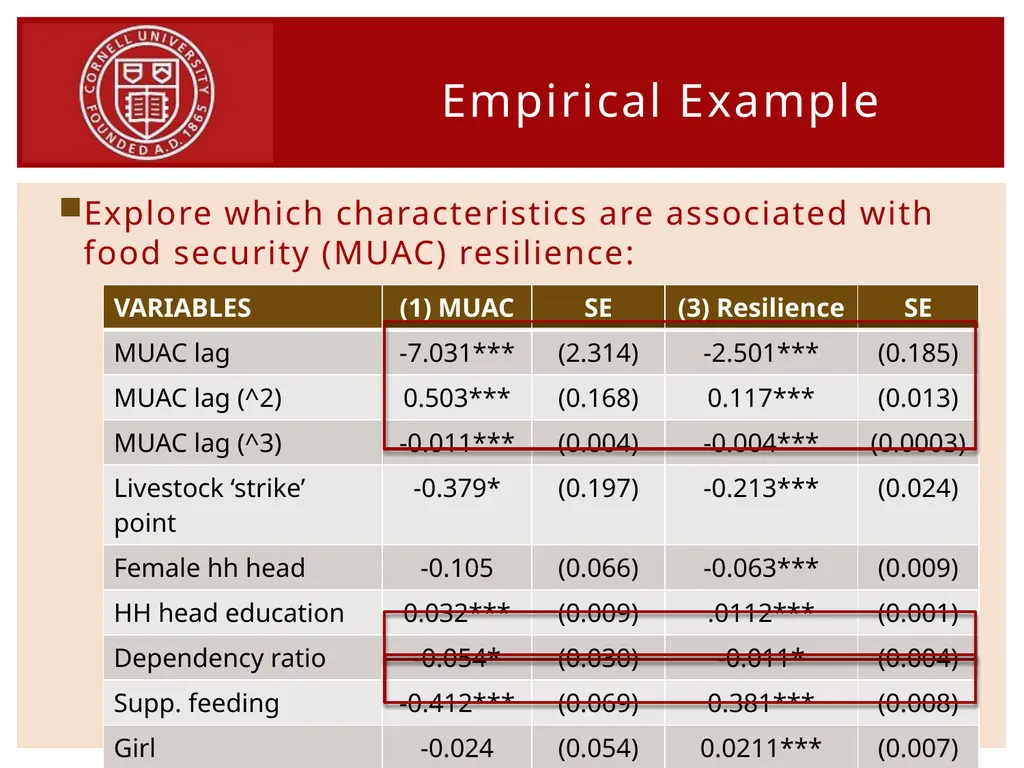
slide7. Regression of MUAC on (selected) covariates: Empirical Example<br>
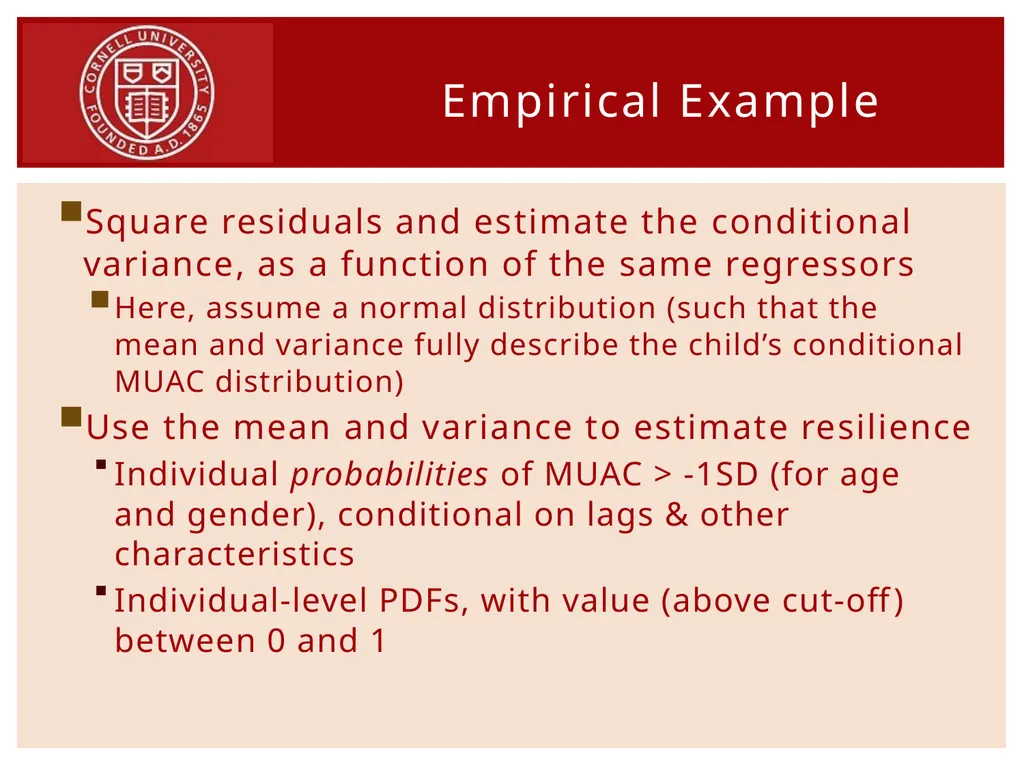
slide8. Square residuals and estimate the conditional variance, as a function of the same regressors
Here, assume a normal distribution (such that the mean and variance fully describe the child’s conditional MUAC distribution)
Use the mean and variance to estimate resilience
Individual probabilities of MUAC > -1SD (for age and gender), conditional on lags & other characteristics
Individual-level PDFs, with value (above cut-off) between 0 and 1 Empirical Example<br>
slide9. Explore which characteristics are associated with food security (MUAC) resilience: Empirical Example<br>
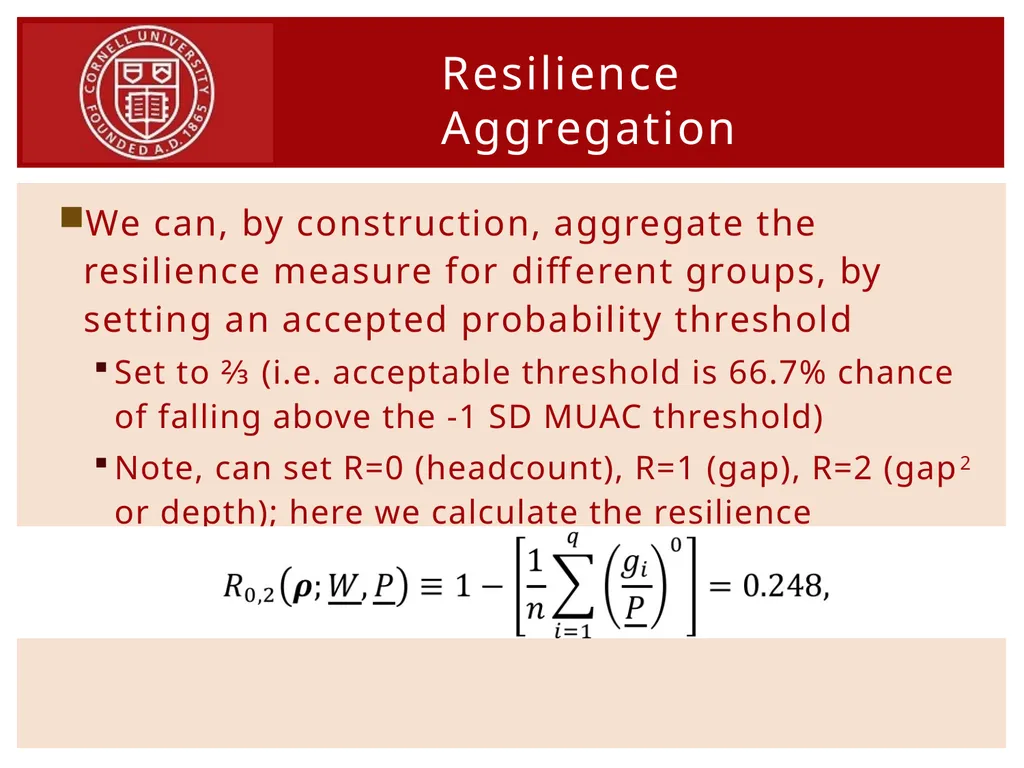
slide10. We can, by construction, aggregate the resilience measure for different groups, by setting an accepted probability threshold
Set to ⅔ (i.e. acceptable threshold is 66.7% chance of falling above the -1 SD MUAC threshold)
Note, can set R=0 (headcount), R=1 (gap), R=2 (gap2 or depth); here we calculate the resilience ‘headcount’ Resilience Aggregation<br>
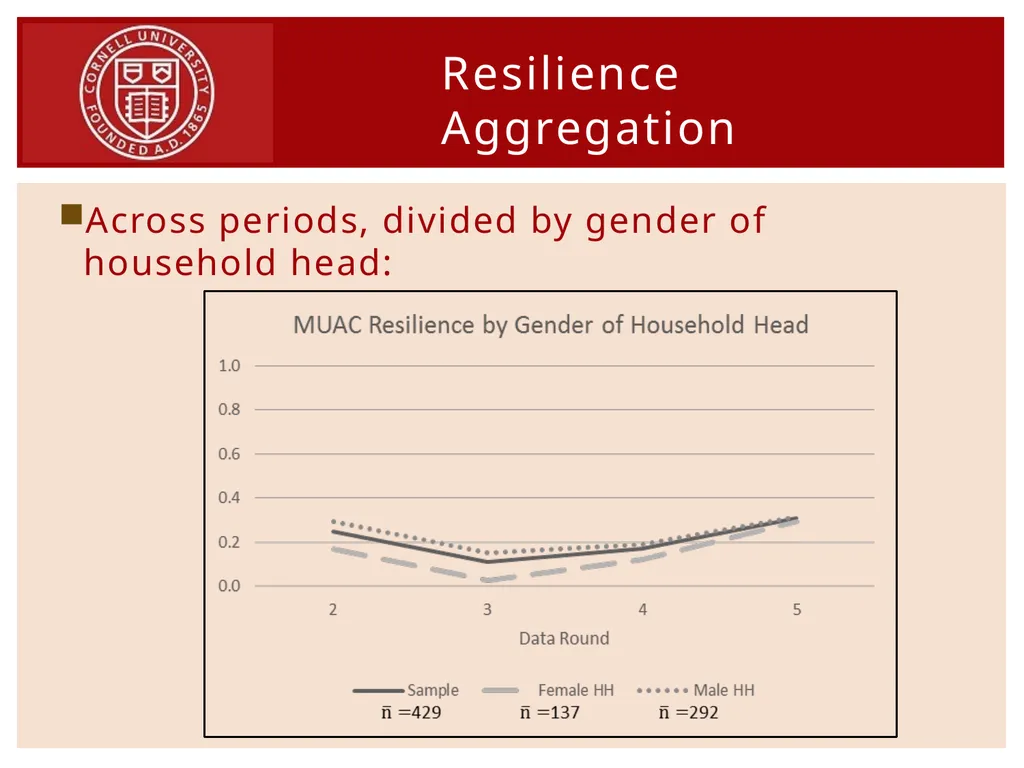
slide11. Across periods, divided by gender of household head: Resilience Aggregation<br>
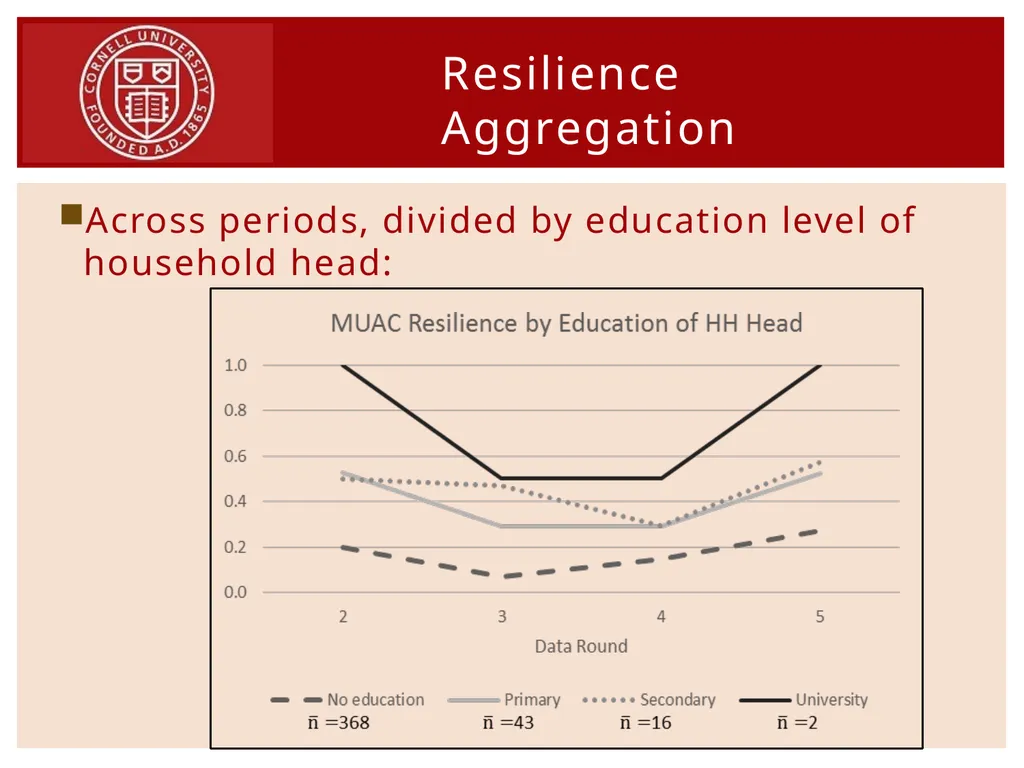
slide12. Across periods, divided by education level of household head: Resilience Aggregation<br>
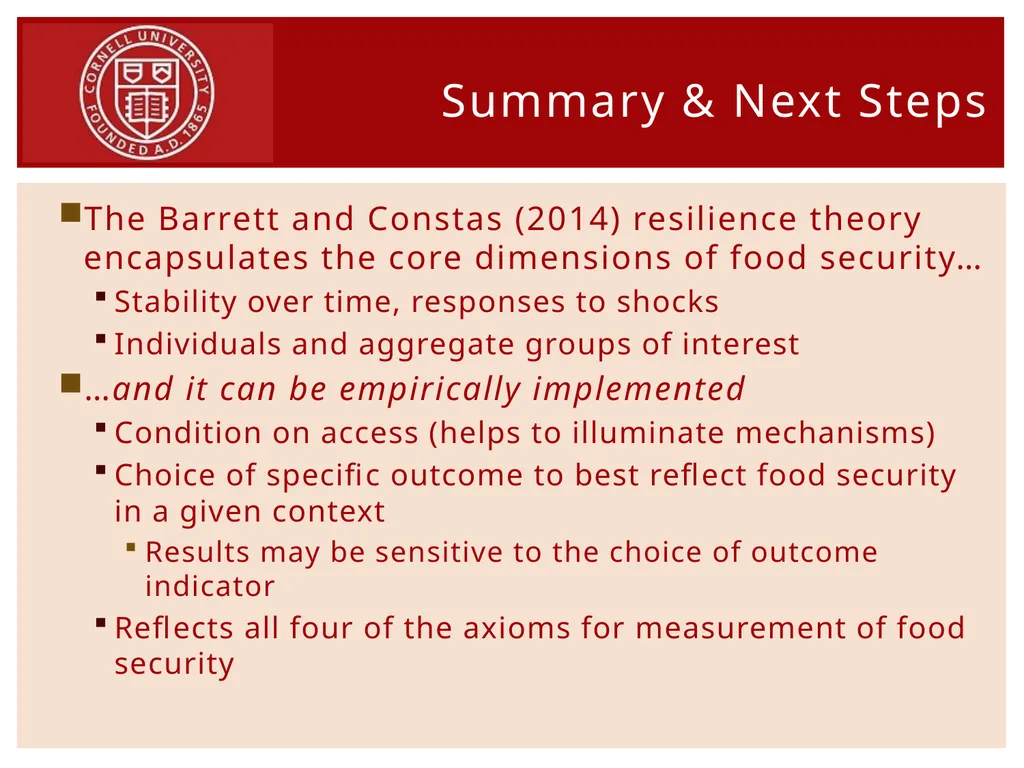
slide13. The Barrett and Constas (2014) resilience theory encapsulates the core dimensions of food security…
Stability over time, responses to shocks
Individuals and aggregate groups of interest
…and it can be empirically implemented
Condition on access (helps to illuminate mechanisms)
Choice of specific outcome to best reflect food security in a given context
Results may be sensitive to the choice of outcome indicator
Reflects all four of the axioms for measurement of food security Summary & Next Steps<br>
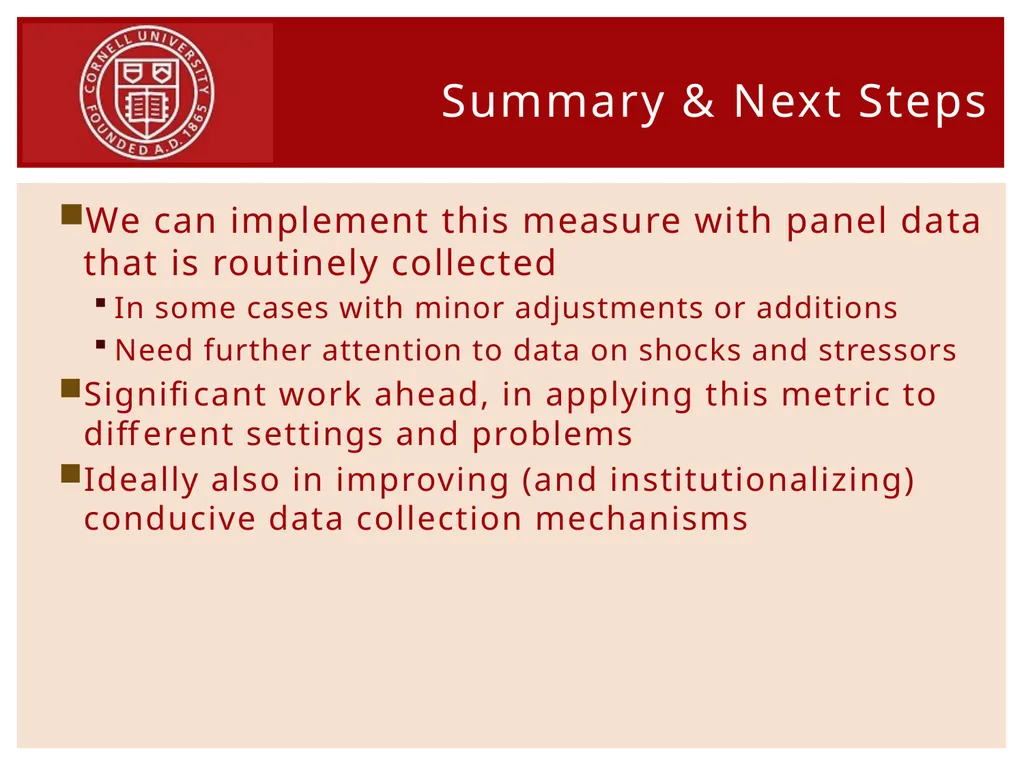
slide14. We can implement this measure with panel data that is routinely collected
In some cases with minor adjustments or additions
Need further attention to data on shocks and stressors
Significant work ahead, in applying this metric to different settings and problems
Ideally also in improving (and institutionalizing) conducive data collection mechanisms Summary & Next Steps<br>
slide15. Questions and comments (more than) welcome Thank you<br>
USDA
Economic Research Service
February 9, 2015 Food Security As Resilience: Reconciling Definition And Measurement Empirical Example from Northern Kenya Joanna Upton, Jenn Cissé and Chris Barrett The Dyson School, Cornell University<br>
slide2. Implement the Barrett and Constas (2014) framework following a decomposable poverty measure approach
Prevalence of food (in)security, or population with an acceptable probability of falling (below)above a given health/nutrition threshold over time
For individuals or any aggregate (entire sample, female-headed households, specific livelihood group…)
Satisfies all four axioms of food security measurement
Can then be used to measure impacts of shocks or interventions Motivation<br>
slide3. To implement, need to make (at least) two normative statements:
Level – An acceptable standard of well-being, for an individual or population
e.g. individual MUAC ≥ 125mm;
and/or < 10% of population with MUAC < 125mm
Probability – An acceptable ikelihood of meeting that standard of well-being
These must be set by prior research, analysis of context, comparing to other measures, etc. Measurement<br>
slide4. Northern Kenya (Marsabit)
Data collected to assess the impacts of Index Based Livestock Insurance (IBLI)
924 households, tracked annually for five years (2009-2013)
Includes data on several well-being outcomes: livestock, expenditure, food consumption, child anthropometry Empirical Example<br>
slide5. Follow the empirical procedure piloted by Cissé and Barrett (in production)
Choose an outcome and a threshold(s)
Mid-upper arm circumference (MUAC)
Typically, MUAC thresholds are set in the ‘negative,’ i.e. admittance to treatment at < 115mm, lower risk of death at > 125mm
Using WHO growth guidelines: > -1SD for gender and age appropriate MUAC (with acceptable probability at ⅔)
Depending on setting and goals, could use different indicators, thresholds, and/or probabilities Empirical Example<br>
slide6. First, estimate the conditional mean MUAC equation, conditioned on:
Lagged well-being (MUAC; squared and cubed to capture path dynamics)
Livelihoods and risk factors, here livestock mortality and livestock death ‘strike point’ (based on NDVI)
Demographics (age, sex, and education level of household head)
Child sex and supplemental feeding status Empirical Example<br>
slide7. Regression of MUAC on (selected) covariates: Empirical Example<br>
slide8. Square residuals and estimate the conditional variance, as a function of the same regressors
Here, assume a normal distribution (such that the mean and variance fully describe the child’s conditional MUAC distribution)
Use the mean and variance to estimate resilience
Individual probabilities of MUAC > -1SD (for age and gender), conditional on lags & other characteristics
Individual-level PDFs, with value (above cut-off) between 0 and 1 Empirical Example<br>
slide9. Explore which characteristics are associated with food security (MUAC) resilience: Empirical Example<br>
slide10. We can, by construction, aggregate the resilience measure for different groups, by setting an accepted probability threshold
Set to ⅔ (i.e. acceptable threshold is 66.7% chance of falling above the -1 SD MUAC threshold)
Note, can set R=0 (headcount), R=1 (gap), R=2 (gap2 or depth); here we calculate the resilience ‘headcount’ Resilience Aggregation<br>
slide11. Across periods, divided by gender of household head: Resilience Aggregation<br>
slide12. Across periods, divided by education level of household head: Resilience Aggregation<br>
slide13. The Barrett and Constas (2014) resilience theory encapsulates the core dimensions of food security…
Stability over time, responses to shocks
Individuals and aggregate groups of interest
…and it can be empirically implemented
Condition on access (helps to illuminate mechanisms)
Choice of specific outcome to best reflect food security in a given context
Results may be sensitive to the choice of outcome indicator
Reflects all four of the axioms for measurement of food security Summary & Next Steps<br>
slide14. We can implement this measure with panel data that is routinely collected
In some cases with minor adjustments or additions
Need further attention to data on shocks and stressors
Significant work ahead, in applying this metric to different settings and problems
Ideally also in improving (and institutionalizing) conducive data collection mechanisms Summary & Next Steps<br>
slide15. Questions and comments (more than) welcome Thank you<br>