
GCSE: Probability Dr J Frost
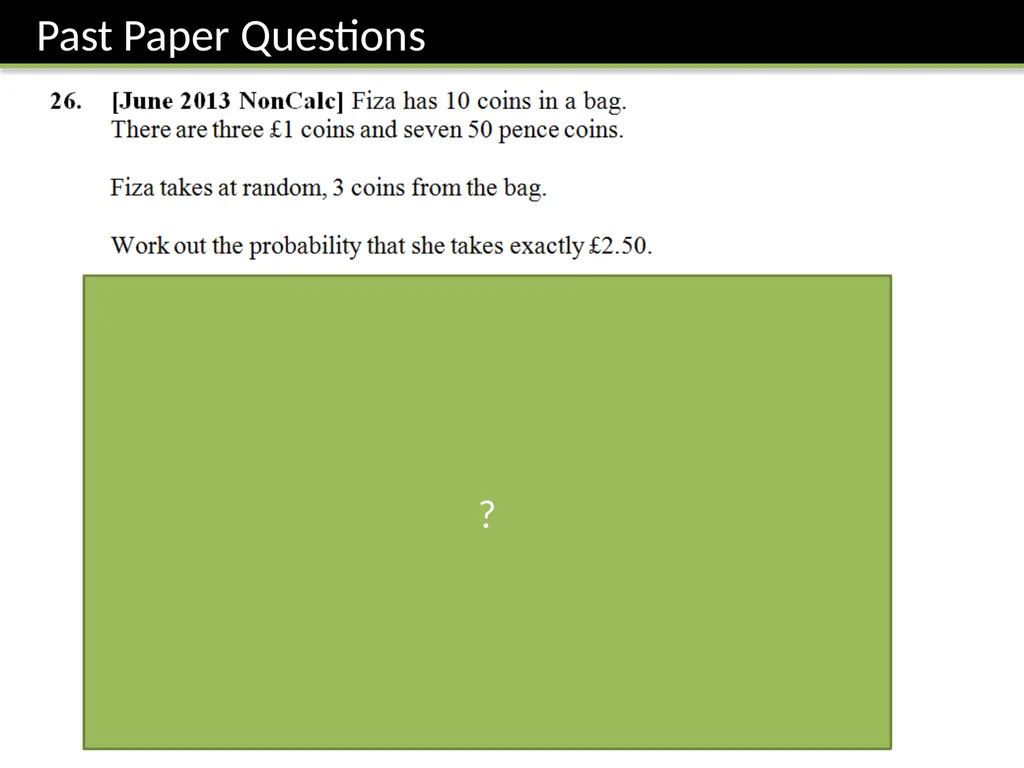
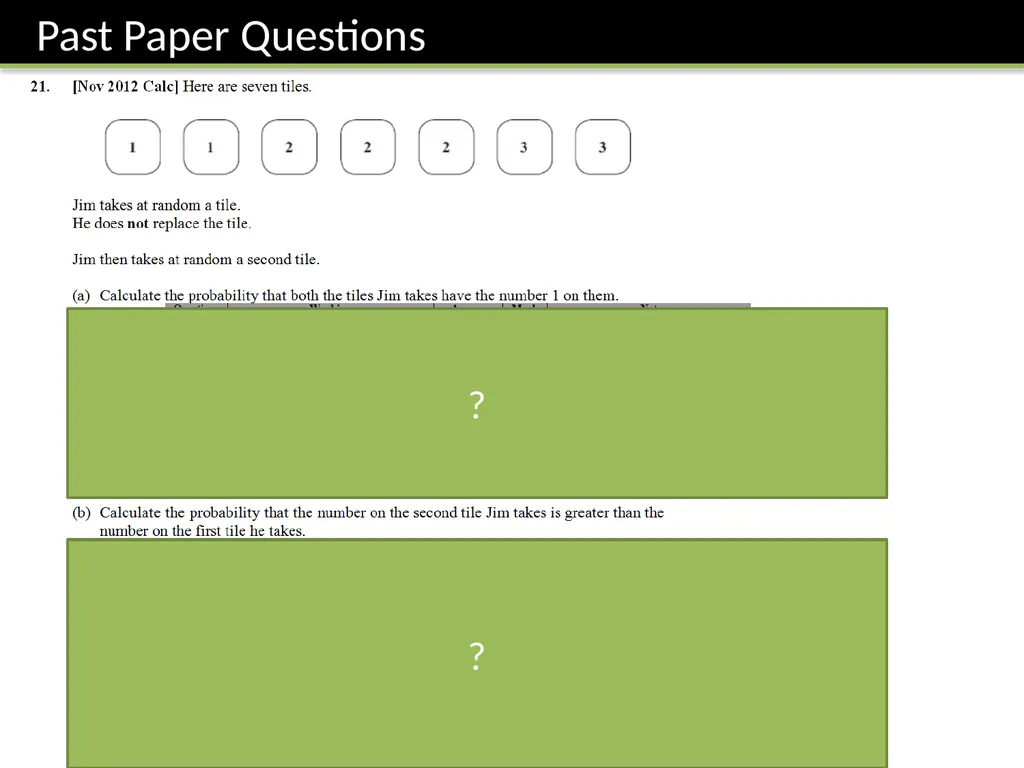
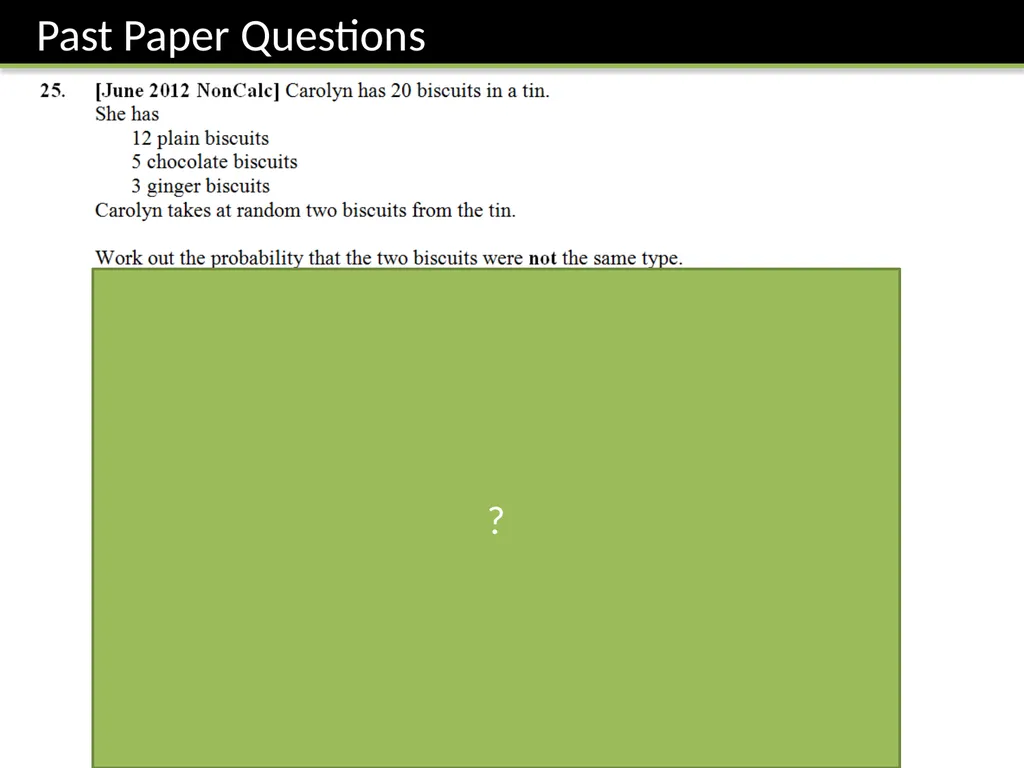
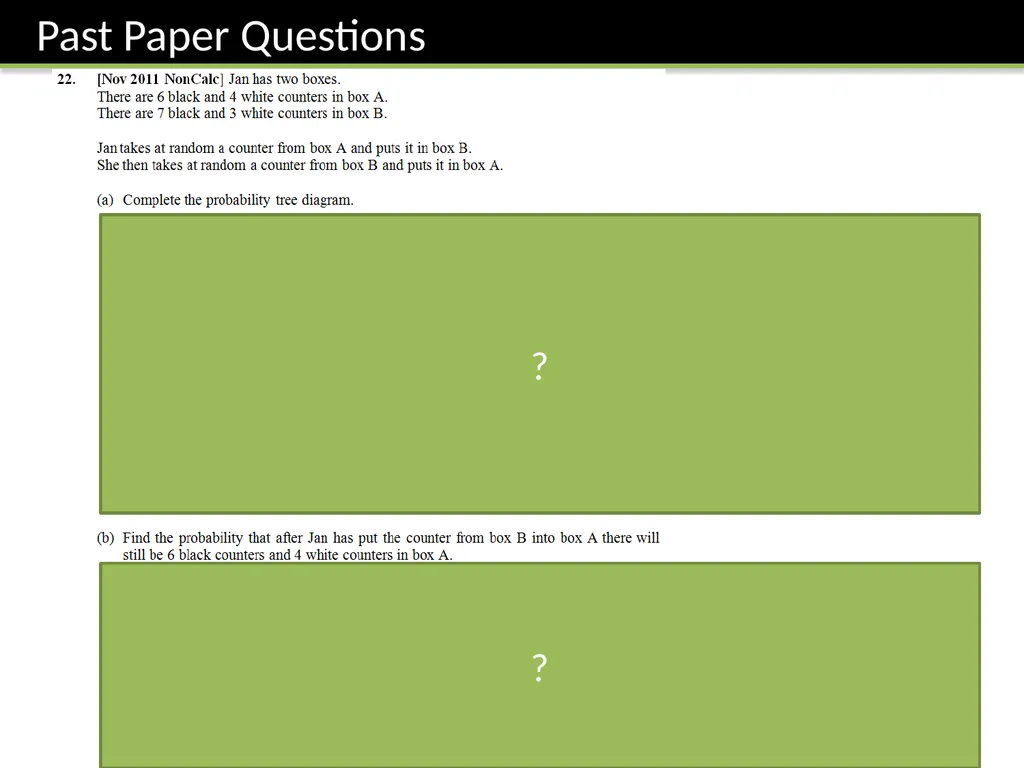
Description: GCSE: Probability Dr J Frost (jfrosttiffin.kingston.sch.uk) Last modified: 15th April 2015 GCSE Pack References: 208-215 208. Write probabilities using fractions, percentages or decimals 209. Compare experimental data and theoretical
Related Topics
Download Presentation
"GCSE: Probability Dr J Frost" is the property of its rightful owner. Permission is granted to download and print the materials on this website for personal, non-commercial use only, and to display it on your personal computer provided you do not modify the materials and that you retain all copyright notices contained in the materials. By downloading content from our website, you accept the terms of this agreement.
Presentation Transcript
slide1. GCSE: Probability Dr J Frost (jfrost@tiffin.kingston.sch.uk) Last modified: 15th April 2015 GCSE Pack References: 208-215<br>
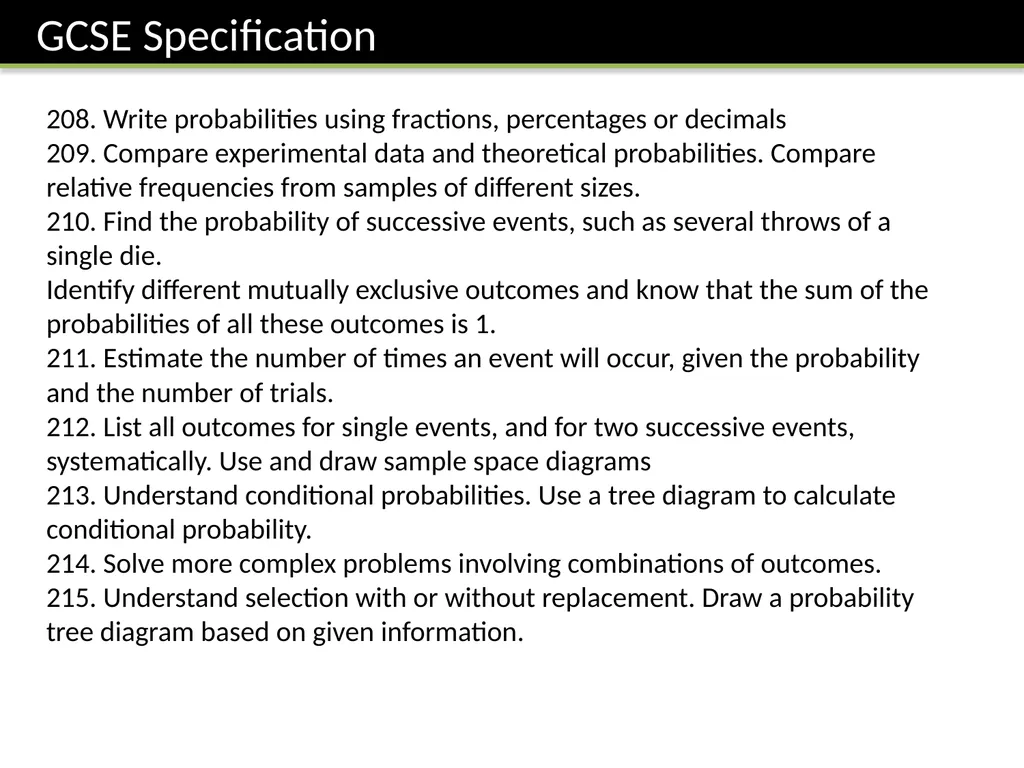
slide2. 208. Write probabilities using fractions, percentages or decimals
209. Compare experimental data and theoretical probabilities. Compare relative frequencies from samples of different sizes.
210. Find the probability of successive events, such as several throws of a single die.
Identify different mutually exclusive outcomes and know that the sum of the probabilities of all these outcomes is 1.
211. Estimate the number of times an event will occur, given the probability and the number of trials.
212. List all outcomes for single events, and for two successive events, systematically. Use and draw sample space diagrams
213. Understand conditional probabilities. Use a tree diagram to calculate conditional probability.
214. Solve more complex problems involving combinations of outcomes.
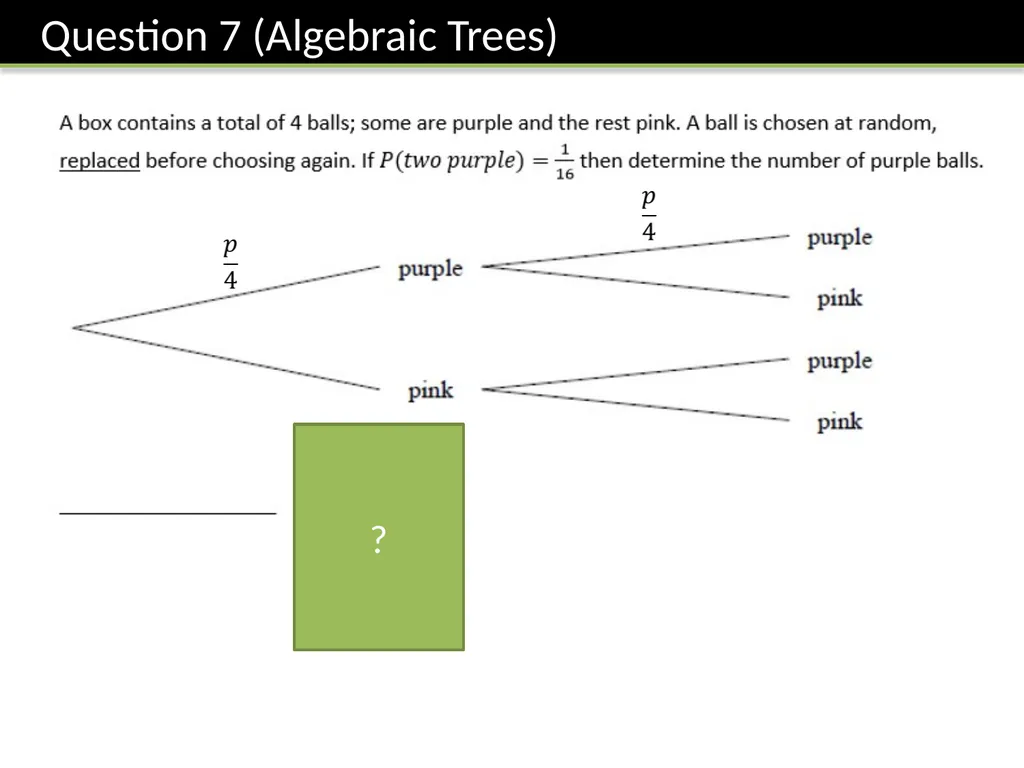
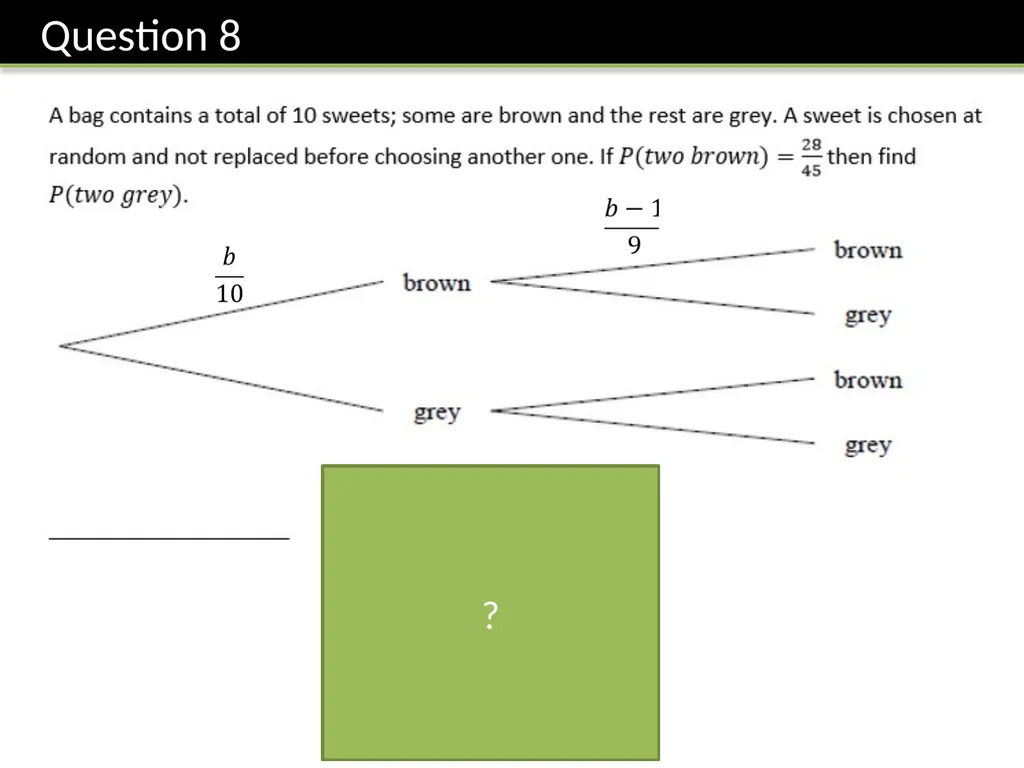
215. Understand selection with or without replacement. Draw a probability tree diagram based on given information.<br>
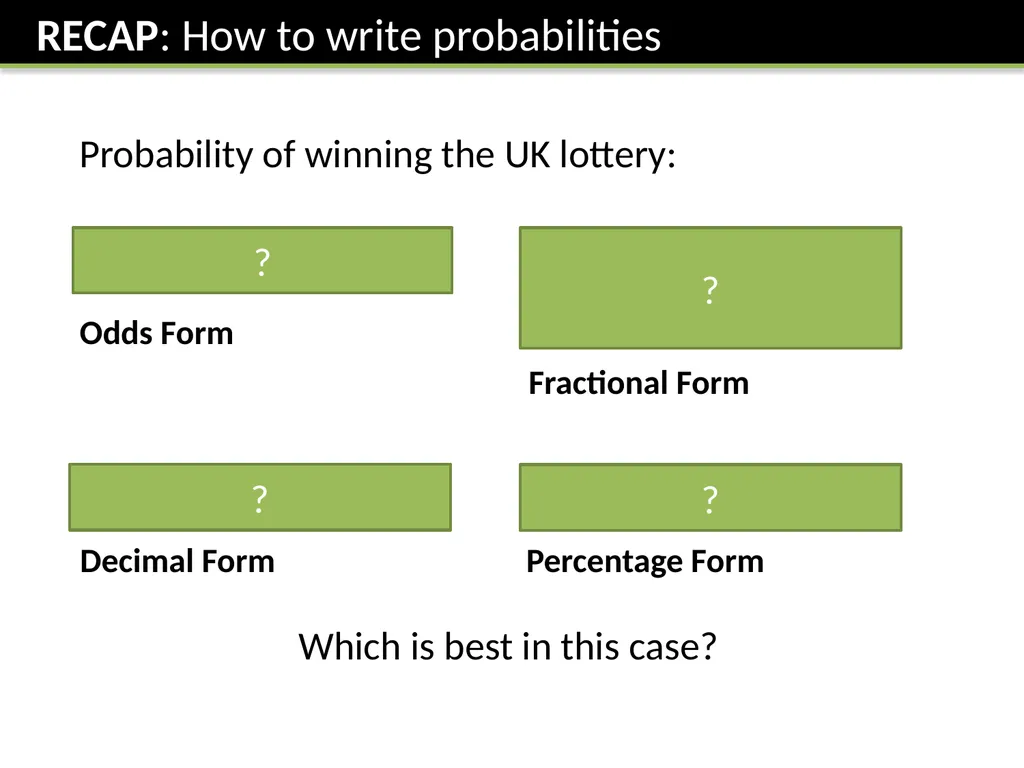
slide3. Probability of winning the UK lottery: 1 in 14,000,000 ___1___
14000000 0.000000714 0.0000714% Odds Form Fractional Form Decimal Form Percentage Form Which is best in this case? ? ? ? ?<br>
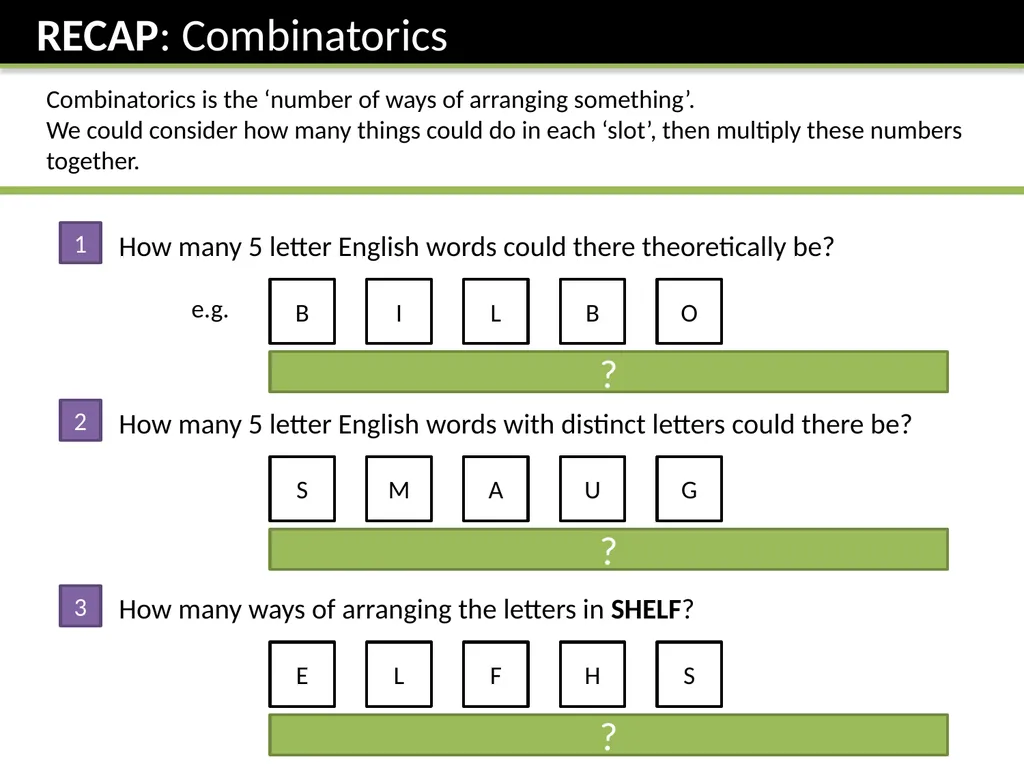
slide4. Combinatorics is the ‘number of ways of arranging something’.
We could consider how many things could do in each ‘slot’, then multiply these numbers together. How many 5 letter English words could there theoretically be? B I L B O 26 x 26 x 26 x 26 x 26 = 265 1 How many 5 letter English words with distinct letters could there be? S M A U G 26 x 25 x 24 x 23 x 22 = 7893600 2 How many ways of arranging the letters in SHELF? E L F H S 5 x 4 x 3 x 2 x 1 = 5! (“5 factorial”) 3 ? ? ? e.g.<br>
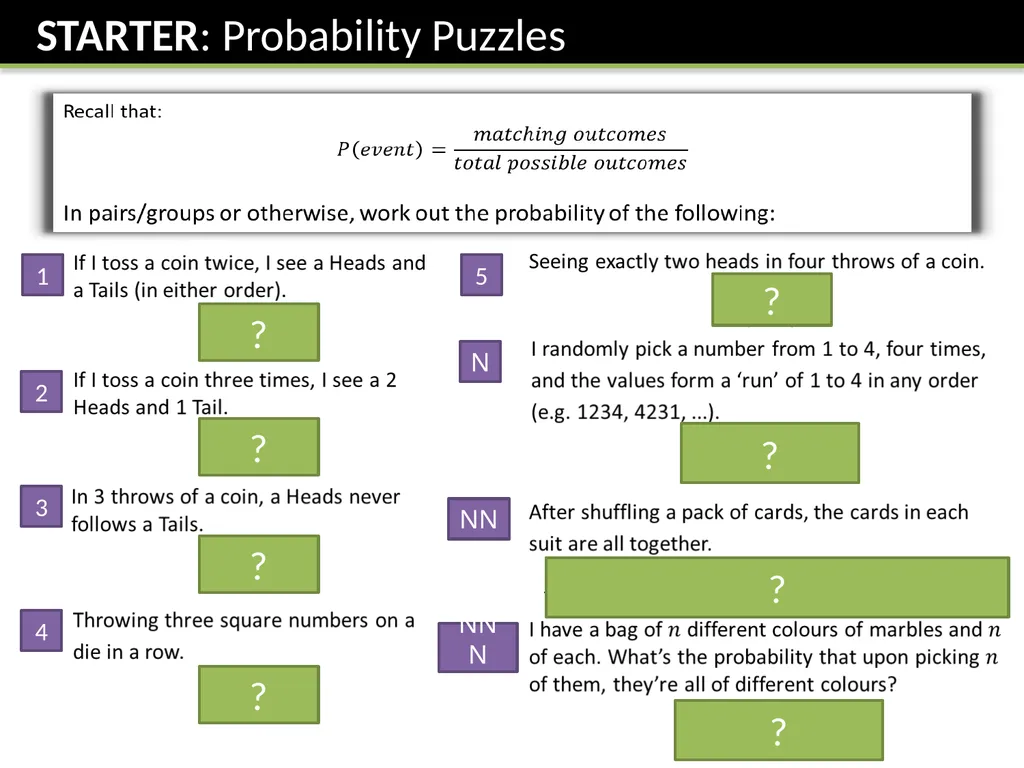
slide5. 1 2 3 4 5 N NN NNN OMG ? ? ? ? ? ? ? ?<br>
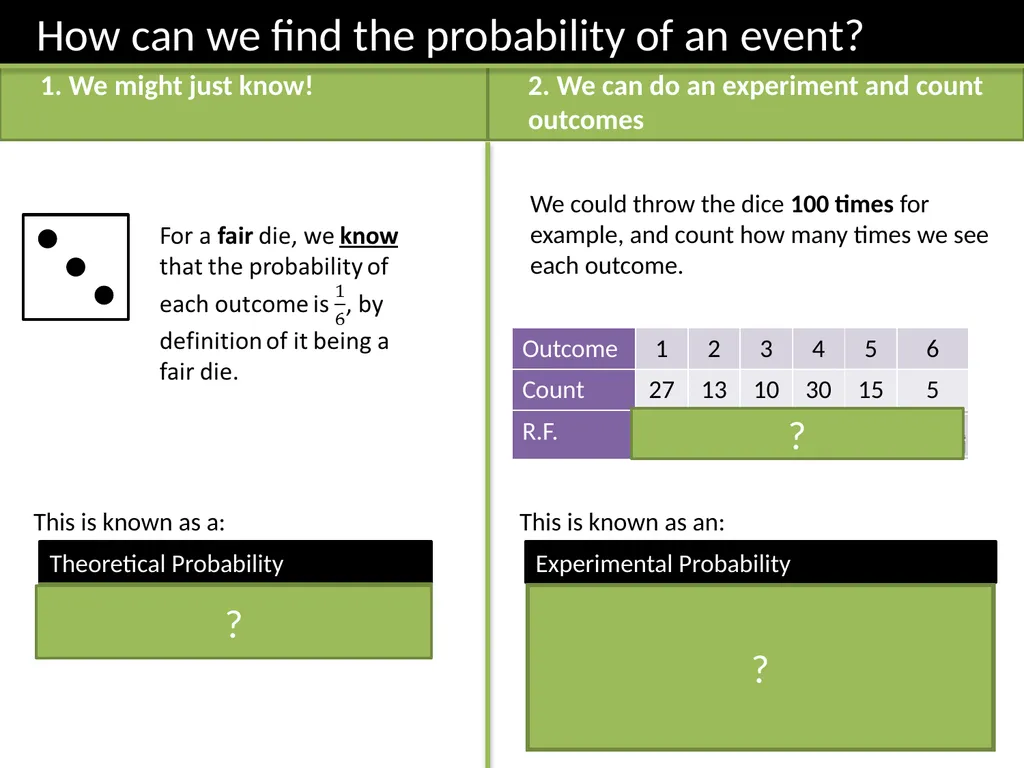
slide6. 1. We might just know! 2. We can do an experiment and count outcomes This is known as a: Theoretical Probability When we know the underlying probability of an event. We could throw the dice 100 times for example, and count how many times we see each outcome. This is known as an: Experimental Probability ? ? ?<br>
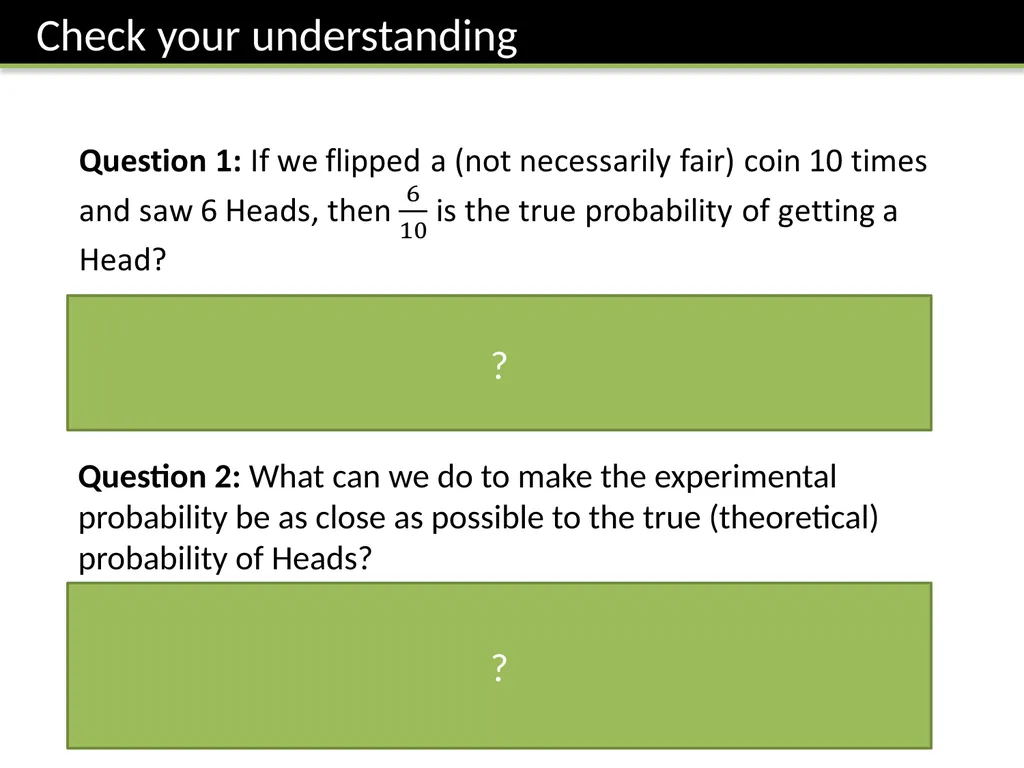
slide7. Question 2: What can we do to make the experimental probability be as close as possible to the true (theoretical) probability of Heads? No. It might for example be a fair coin: If we throw a fair coin 10 times we wouldn’t necessarily see 5 heads. In fact we could have seen 6 heads! So the relative frequency/experimental probability only provides a “sensible guess” for the true probability of Heads, based on what we’ve observed. Flip the coin lots of times. I we threw a coin just twice for example and saw 0 Heads, it’s hard to know how unfair our coin is. But if we threw it say 1000 times and saw 200 heads, then we’d have a much more accurate probability.
The law of large events states that as the number of trials becomes large, the experimental probability becomes closer to the true probability. ? ?<br>
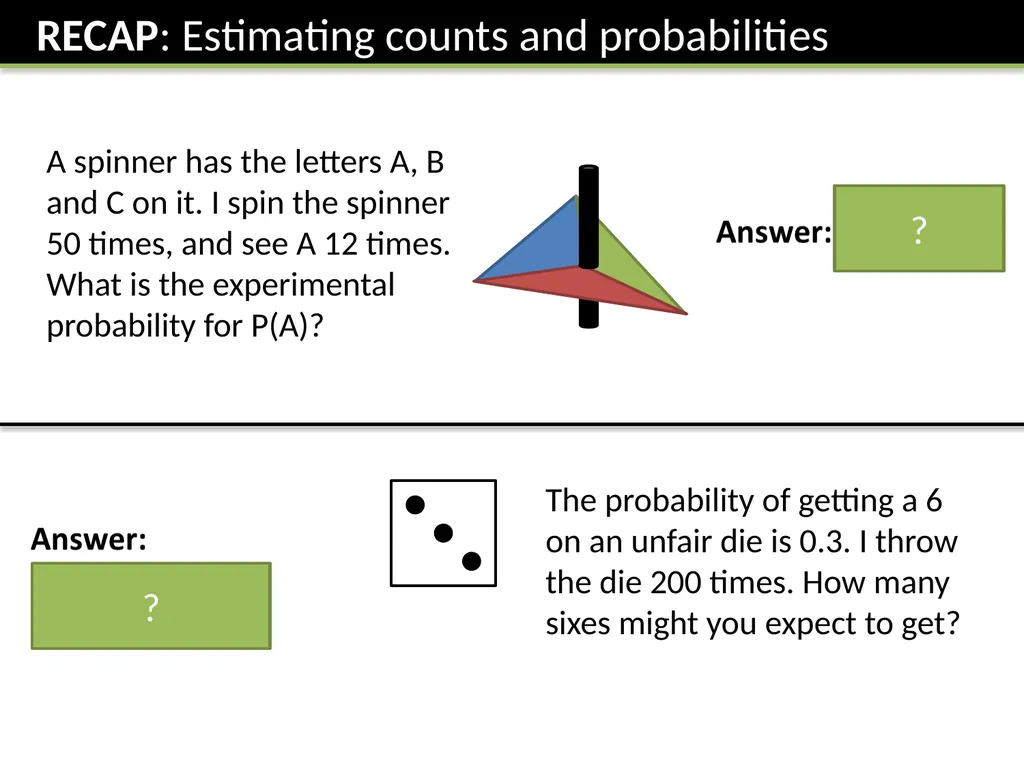
slide8. A spinner has the letters A, B and C on it. I spin the spinner 50 times, and see A 12 times. What is the experimental probability for P(A)? The probability of getting a 6 on an unfair die is 0.3. I throw the die 200 times. How many sixes might you expect to get? ? ?<br>
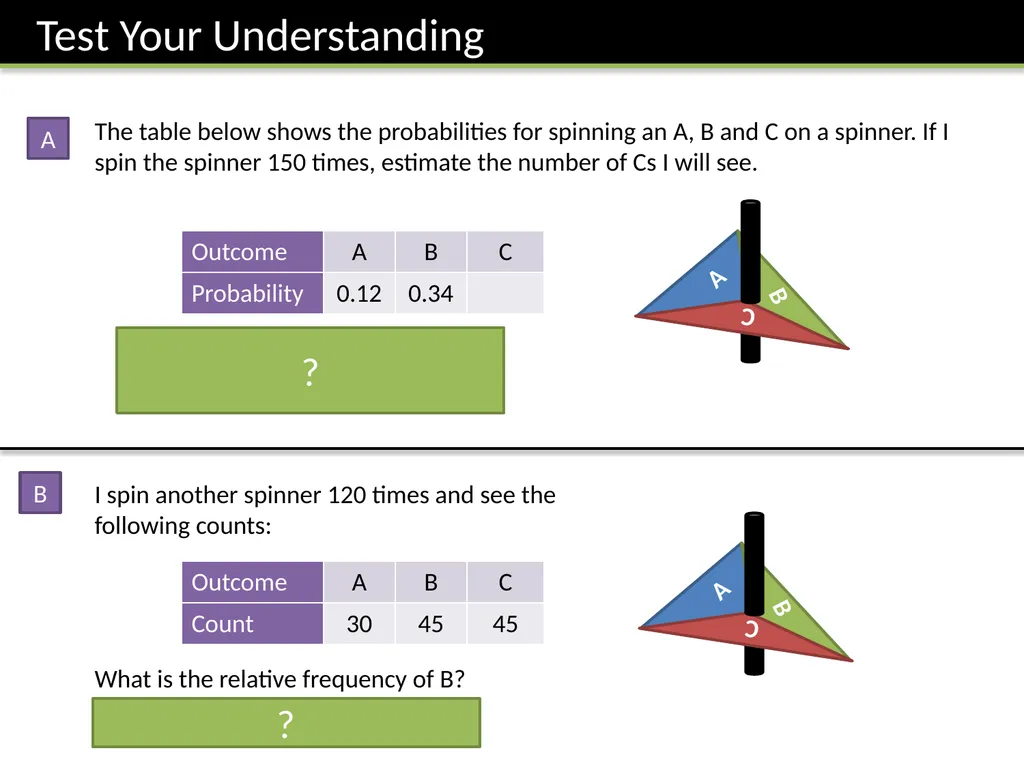
slide9. The table below shows the probabilities for spinning an A, B and C on a spinner. If I spin the spinner 150 times, estimate the number of Cs I will see. P(C) = 1 – 0.12 – 0.34 = 0.54
Estimate Cs seen = 0.54 x 150 = 81 ? A B C I spin another spinner 120 times and see the following counts:
What is the relative frequency of B?
45/120 = 0.375 ? A B A B C<br>
slide10. 208. Write probabilities using fractions, percentages or decimals
209. Compare experimental data and theoretical probabilities. Compare relative frequencies from samples of different sizes.
210. Find the probability of successive events, such as several throws of a single die.
Identify different mutually exclusive outcomes and know that the sum of the probabilities of all these outcomes is 1.
211. Estimate the number of times an event will occur, given the probability and the number of trials.
212. List all outcomes for single events, and for two successive events, systematically. Use and draw sample space diagrams
213. Understand conditional probabilities. Use a tree diagram to calculate conditional probability.
214. Solve more complex problems involving combinations of outcomes.
215. Understand selection with or without replacement. Draw a probability tree diagram based on given information. <br>
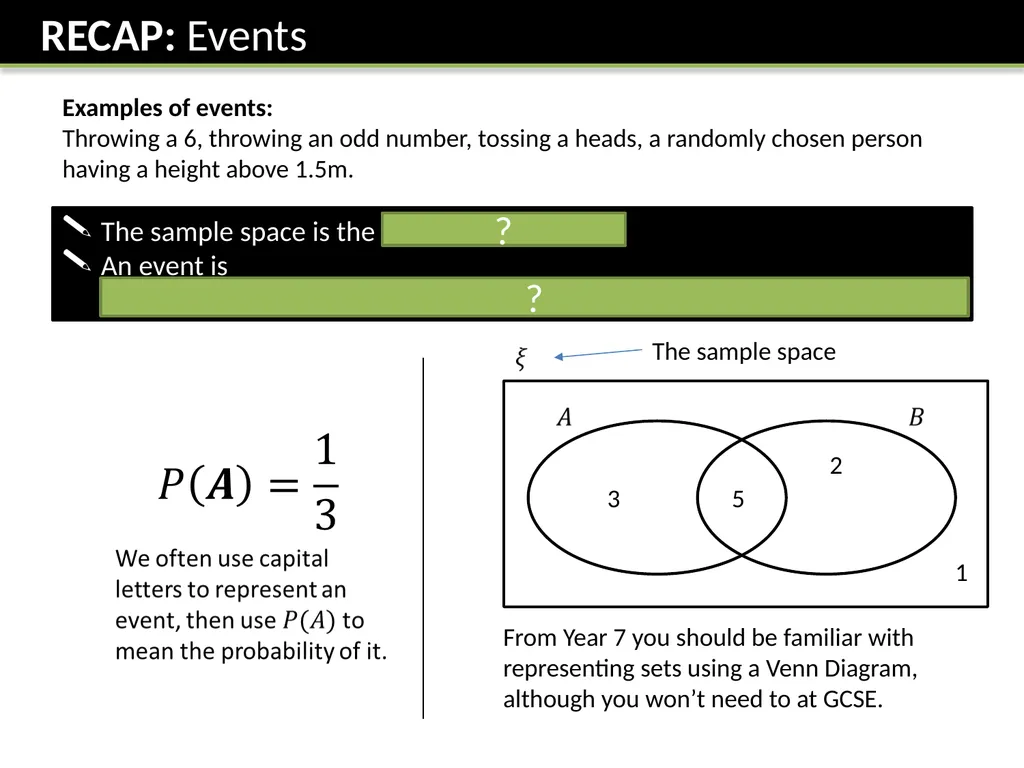
slide11. Examples of events:
Throwing a 6, throwing an odd number, tossing a heads, a randomly chosen person having a height above 1.5m. The sample space is the set of all outcomes.
An event is a description of one or more outcomes. It is a subset of the sample space. 3 2 5 1 From Year 7 you should be familiar with representing sets using a Venn Diagram, although you won’t need to at GCSE. ? ? The sample space<br>
slide12. 1
8 ? ? ?<br>
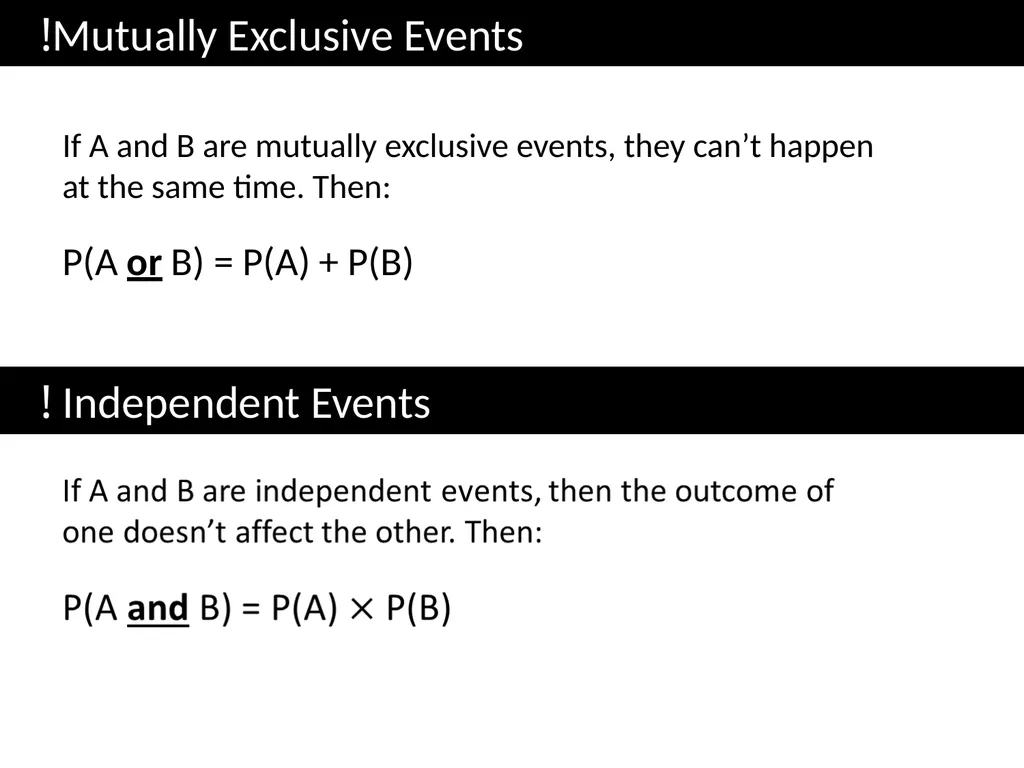
slide13. !Mutually Exclusive Events ! Independent Events If A and B are mutually exclusive events, they can’t happen at the same time. Then:
P(A or B) = P(A) + P(B)<br>
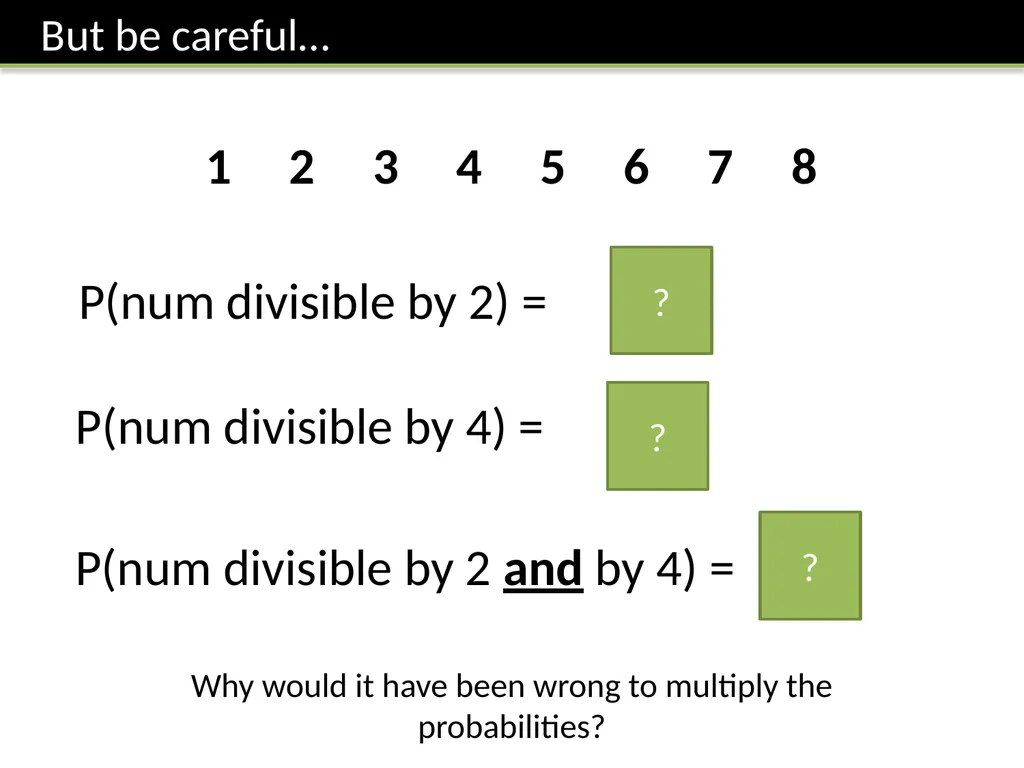
slide14. 1 2 3 4 5 6 7 8 P(num divisible by 2) = P(num divisible by 4) = P(num divisible by 2 and by 4) = 1
2 1
4 1
4 Why would it have been wrong to multiply the probabilities? ? ? ?<br>
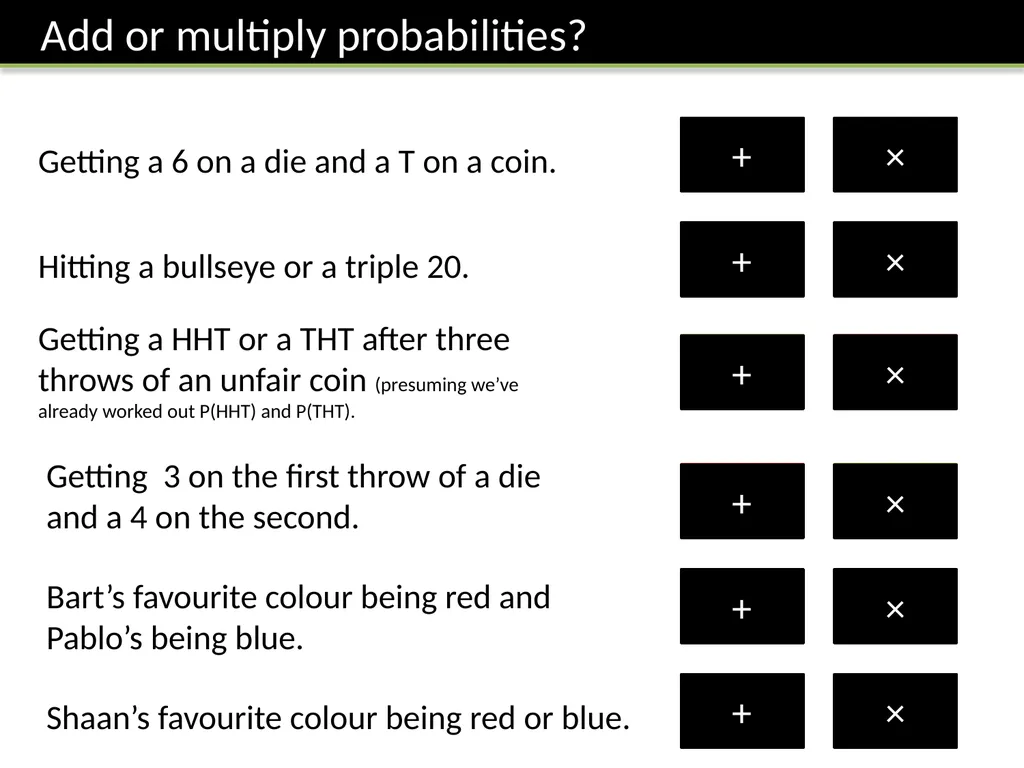
slide15. Getting a 6 on a die and a T on a coin. + × Hitting a bullseye or a triple 20. + × Getting a HHT or a THT after three throws of an unfair coin (presuming we’ve already worked out P(HHT) and P(THT). + × Getting 3 on the first throw of a die and a 4 on the second. + × Bart’s favourite colour being red and Pablo’s being blue. + × Shaan’s favourite colour being red or blue. + ×<br>
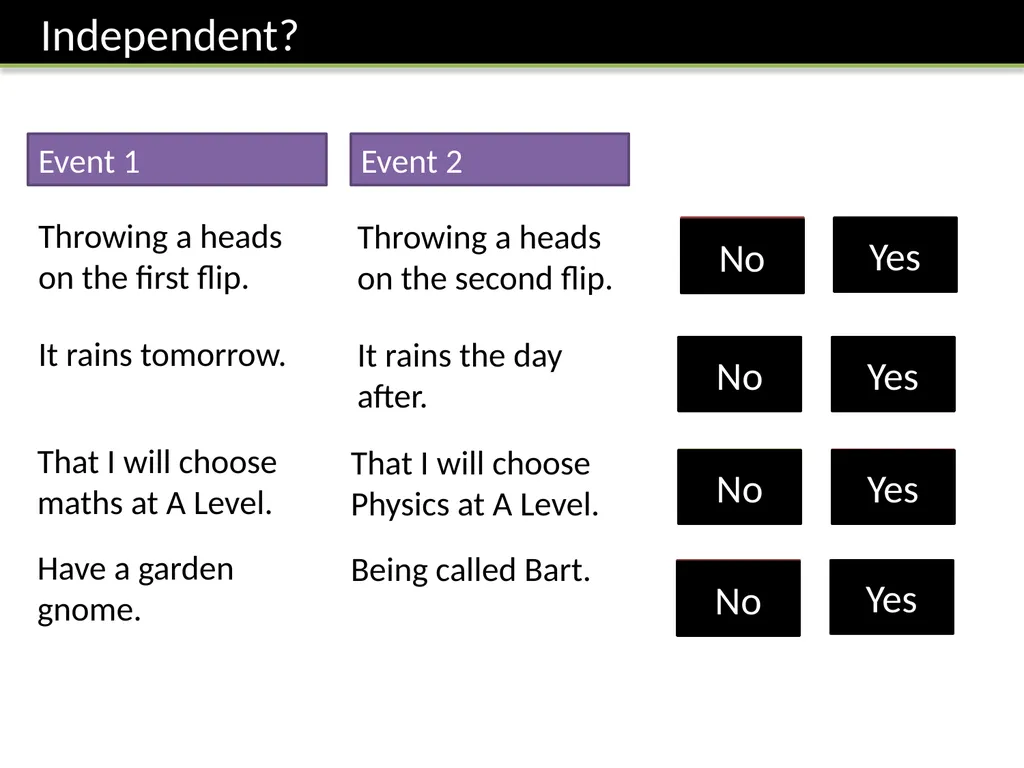
slide16. Event 1 No Yes Throwing a heads on the first flip. No Yes No Yes Event 2 Throwing a heads on the second flip. It rains tomorrow. It rains the day after. That I will choose maths at A Level. That I will choose Physics at A Level. Have a garden gnome. Being called Bart. No Yes<br>
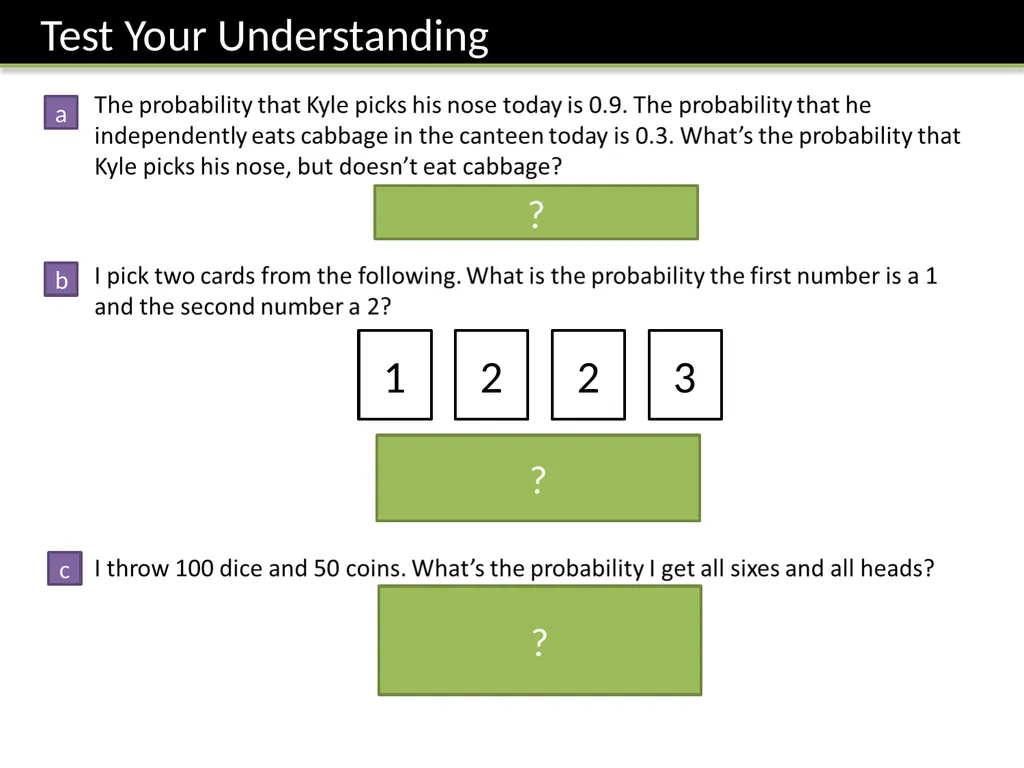
slide17. a b c ? 1 2 2 3 ? ?<br>
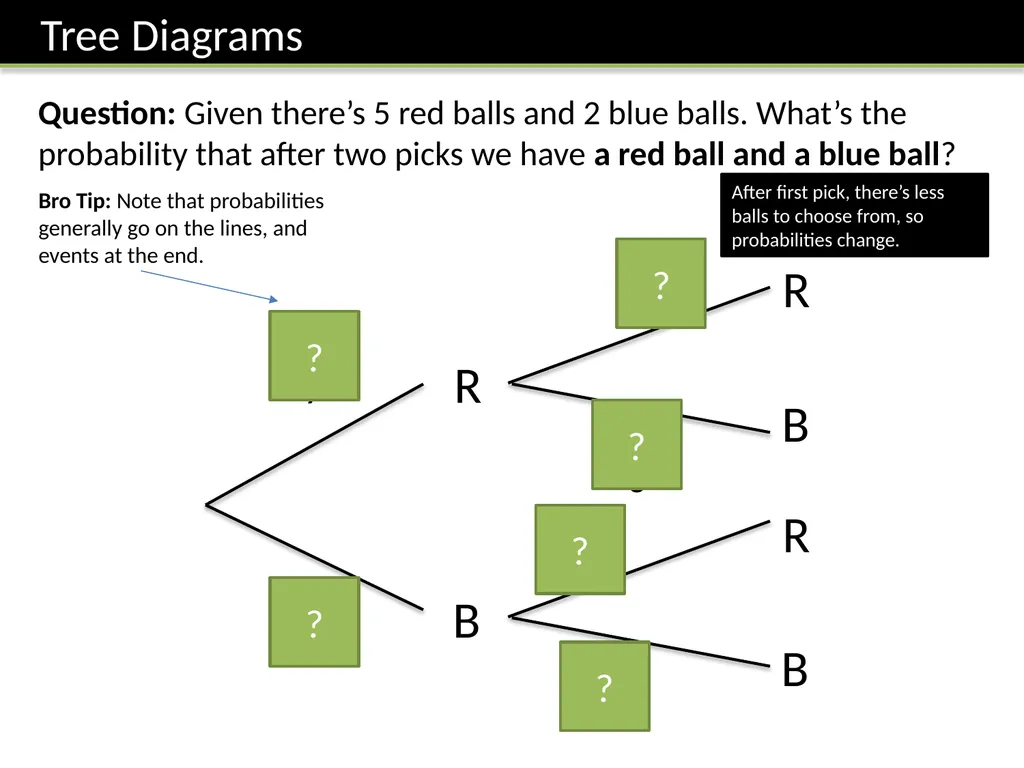
slide18. Question: Given there’s 5 red balls and 2 blue balls. What’s the probability that after two picks we have a red ball and a blue ball? R B R B R B 5
7 2
7 4
6 2
6 5
6 1
6 ? ? ? ? ? ? After first pick, there’s less balls to choose from, so probabilities change. Bro Tip: Note that probabilities generally go on the lines, and events at the end.<br>
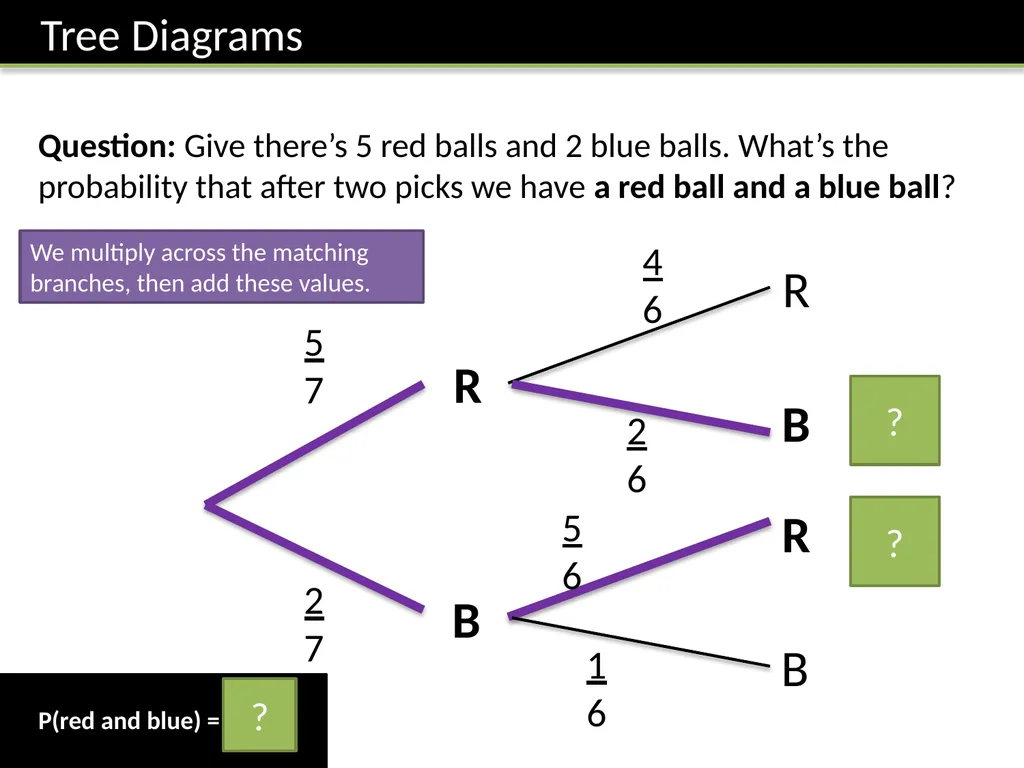
slide19. Question: Give there’s 5 red balls and 2 blue balls. What’s the probability that after two picks we have a red ball and a blue ball? R B R B R B 5
7 2
7 4
6 2
6 5
6 1
6 5
21 5
21 ? ? P(red and blue) = 10
21 ? We multiply across the matching branches, then add these values.<br>
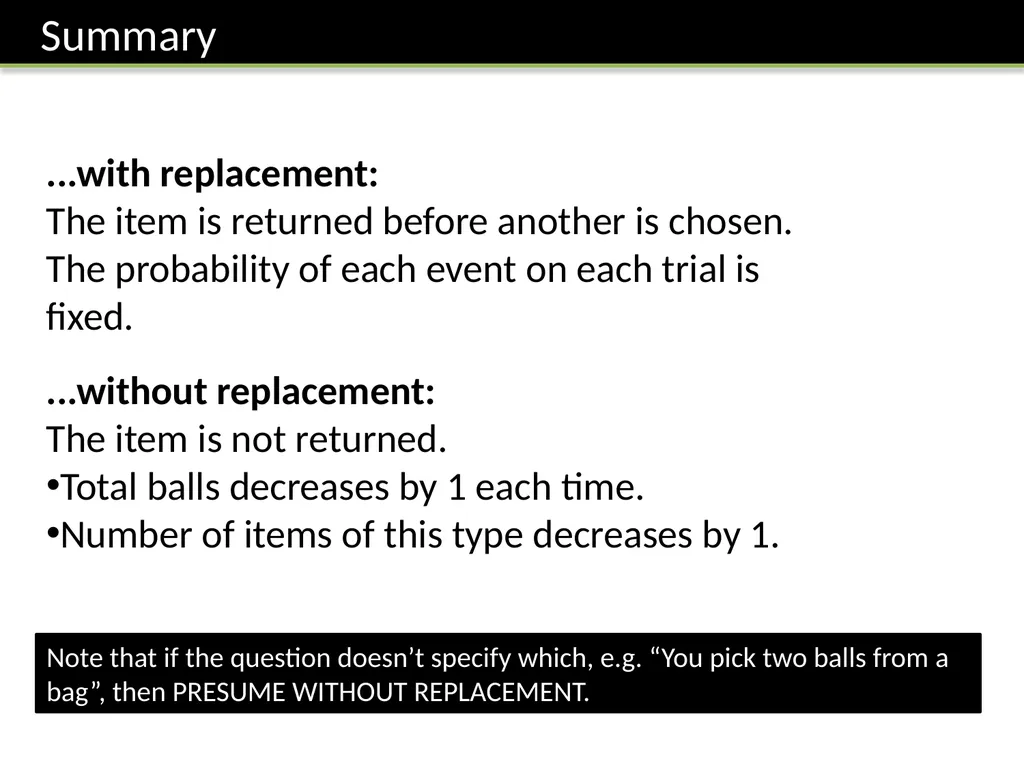
slide20. ...with replacement:
The item is returned before another is chosen. The probability of each event on each trial is fixed. ...without replacement:
The item is not returned.
Total balls decreases by 1 each time.
Number of items of this type decreases by 1. Note that if the question doesn’t specify which, e.g. “You pick two balls from a bag”, then PRESUME WITHOUT REPLACEMENT.<br>
slide21. ? ? 3
8 3
8 5
8 5
8 3
8 ? ? ? ? ?<br>
slide22. ? ? ?<br>
slide23. ? ? ? ? ?<br>
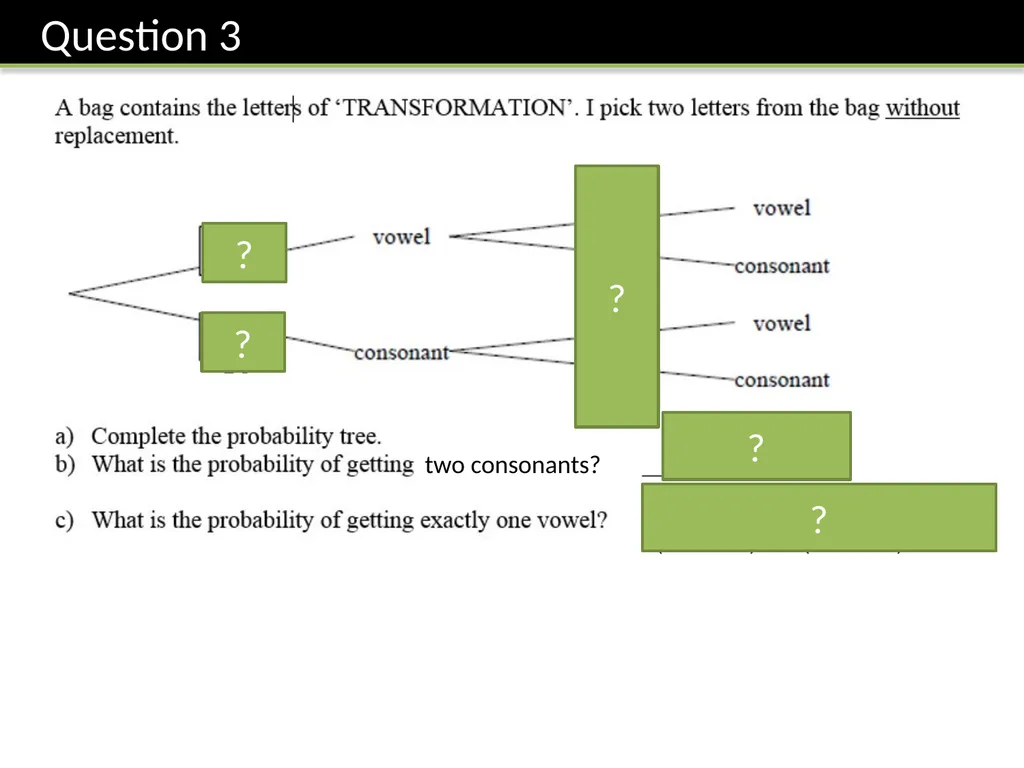
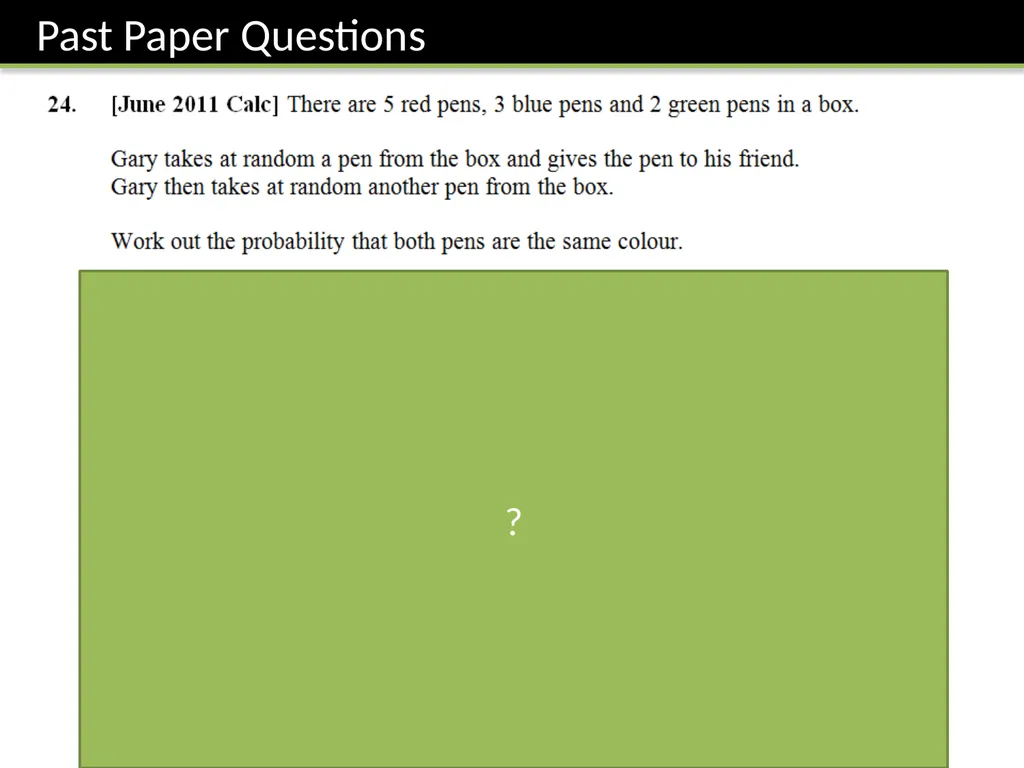
slide24. two consonants? ? ? ? ? ?<br>
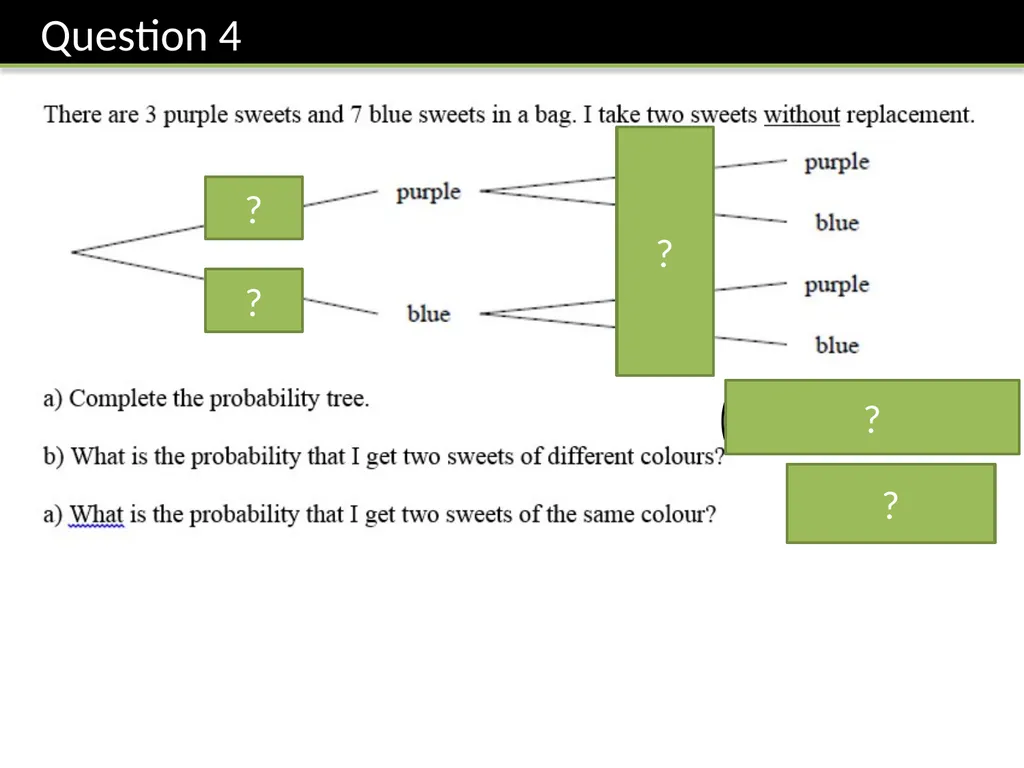
slide25. ? ? ? ? ?<br>
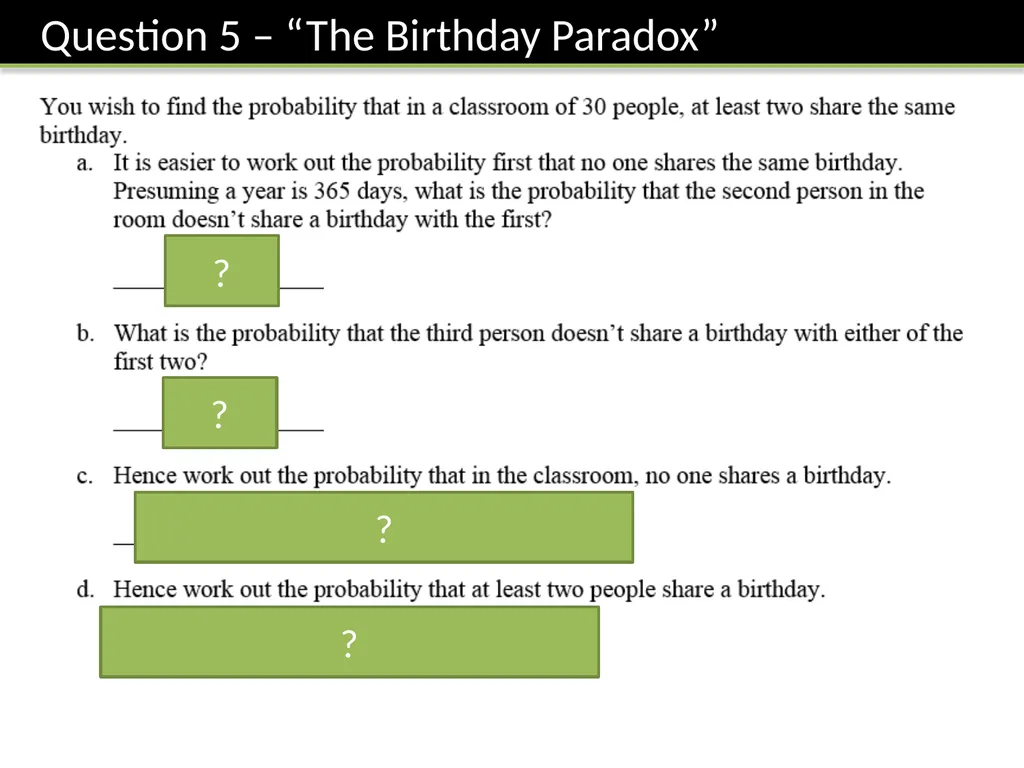
slide26. ? ? ? ?<br>
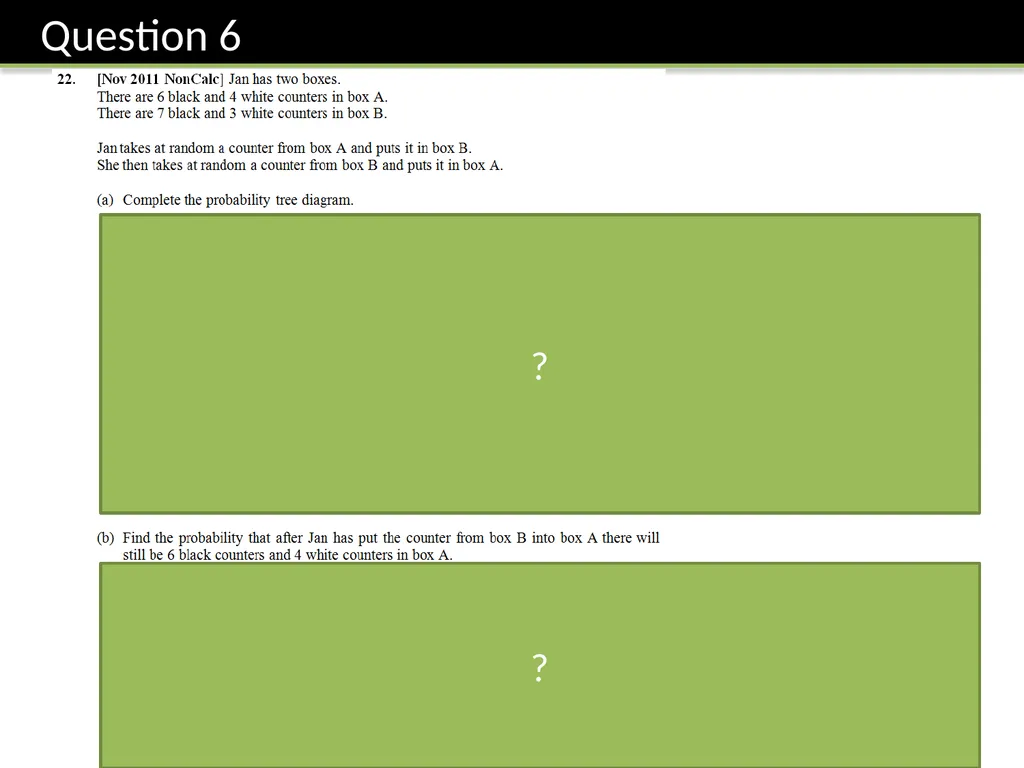
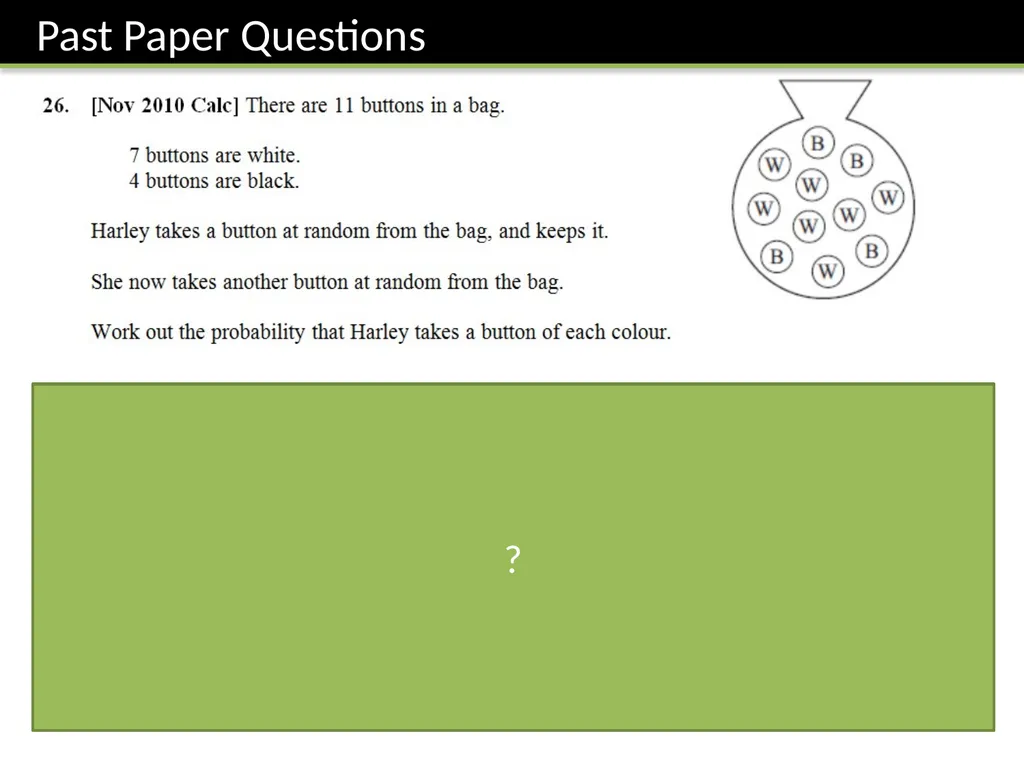
slide27. 64
110 ? ?<br>
slide28. ?<br>
slide29. ?<br>
slide30. ?<br>
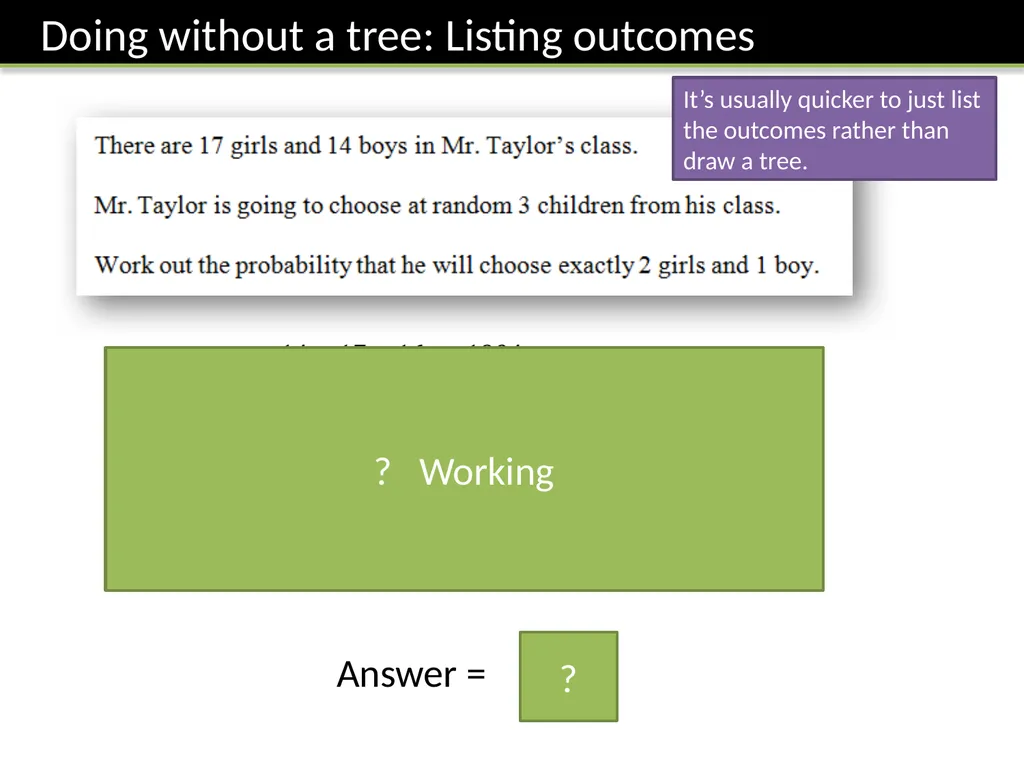
slide31. 1904
4495 ? Answer = BGG:
GBG:
GGB: It’s usually quicker to just list the outcomes rather than draw a tree. ? Working<br>
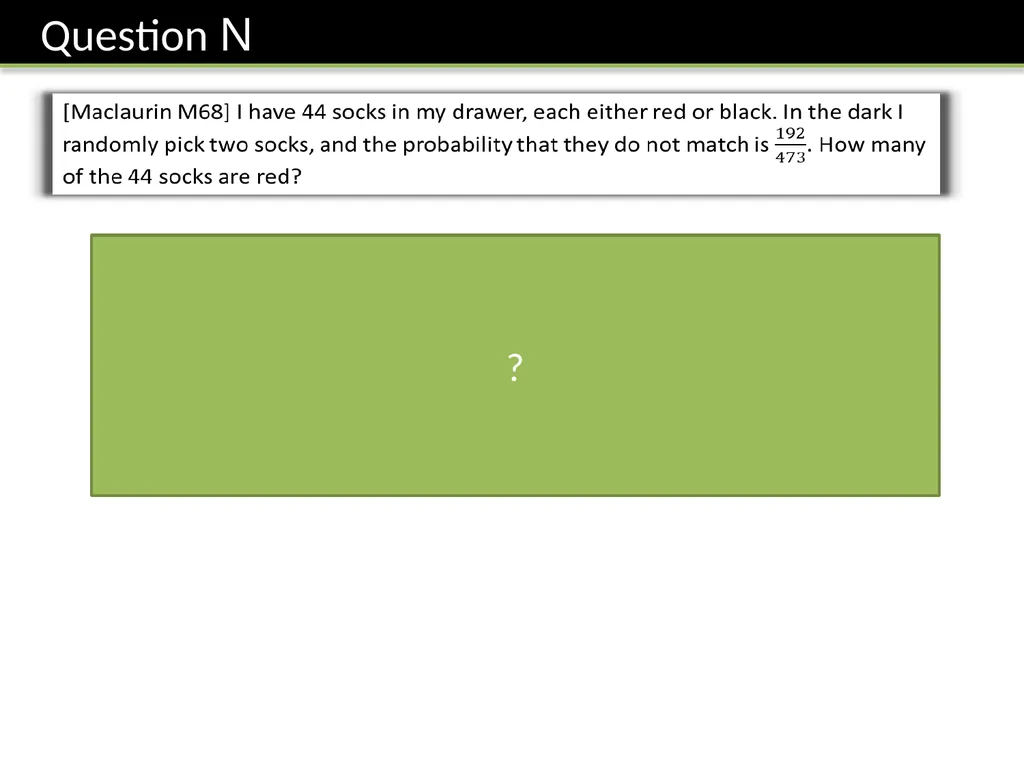
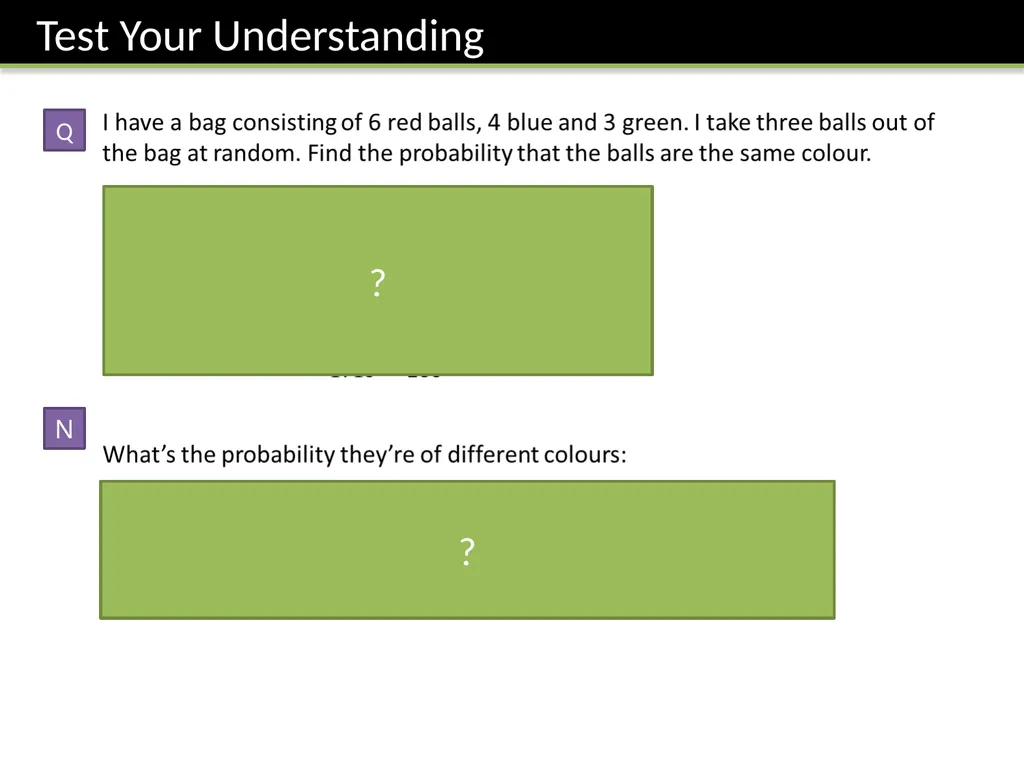
slide32. Q N ? ?<br>
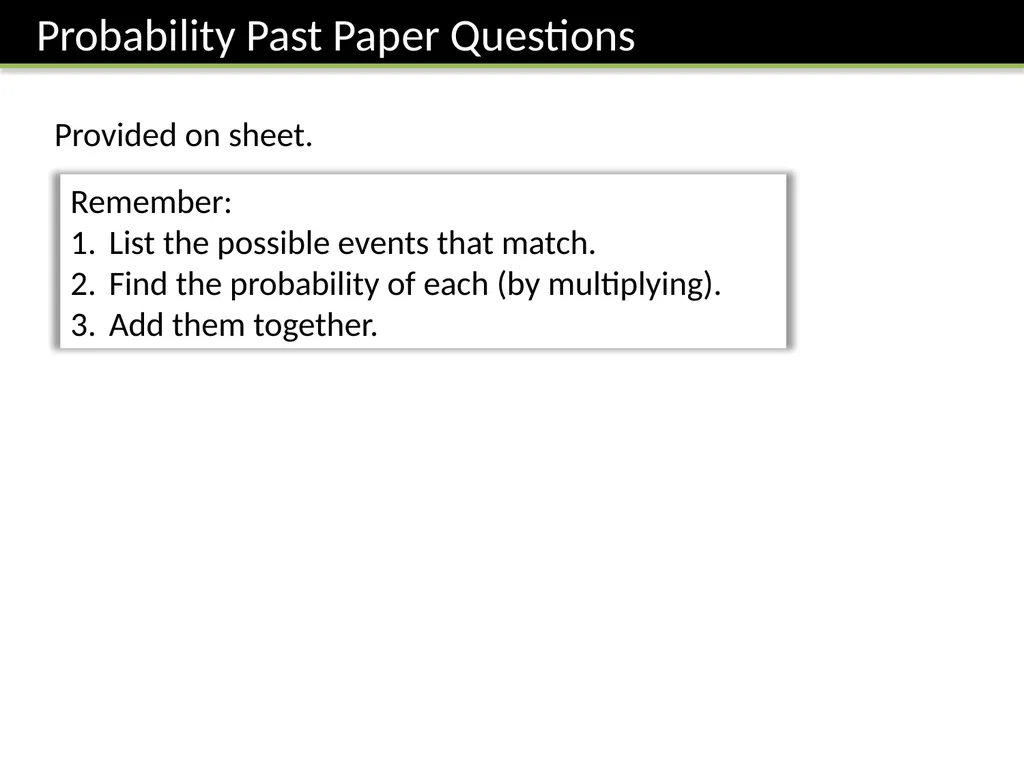
slide33. Provided on sheet. Remember:
List the possible events that match.
Find the probability of each (by multiplying).
Add them together.<br>
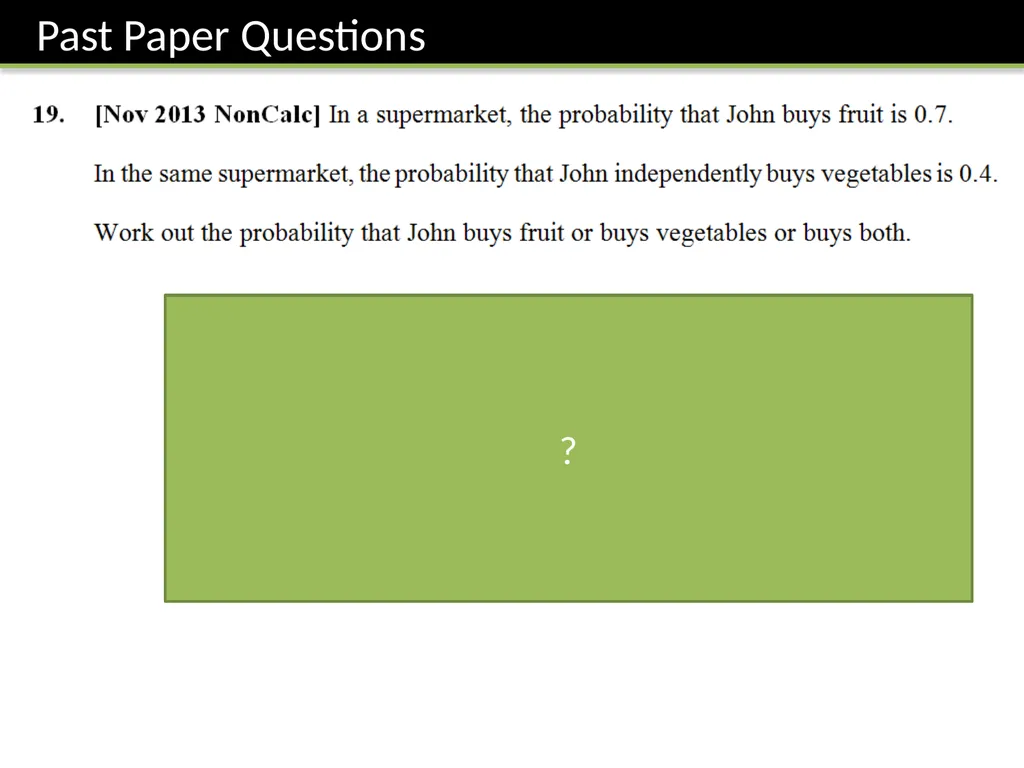
slide34. ?<br>
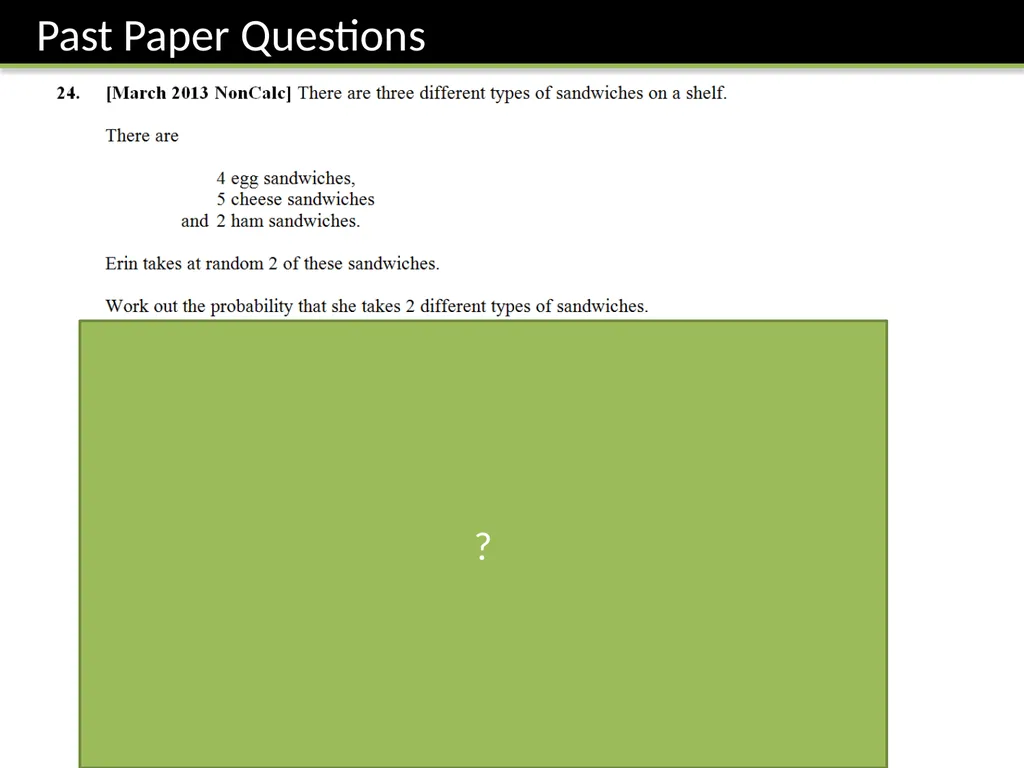
slide35. ?<br>
slide36. ?<br>
slide37. 2
42 16
42 ? ?<br>
slide38. 222
380 ?<br>
slide39. 64
110 ? ?<br>
slide40. ?<br>
slide41. ?<br>
slide2. 208. Write probabilities using fractions, percentages or decimals
209. Compare experimental data and theoretical probabilities. Compare relative frequencies from samples of different sizes.
210. Find the probability of successive events, such as several throws of a single die.
Identify different mutually exclusive outcomes and know that the sum of the probabilities of all these outcomes is 1.
211. Estimate the number of times an event will occur, given the probability and the number of trials.
212. List all outcomes for single events, and for two successive events, systematically. Use and draw sample space diagrams
213. Understand conditional probabilities. Use a tree diagram to calculate conditional probability.
214. Solve more complex problems involving combinations of outcomes.
215. Understand selection with or without replacement. Draw a probability tree diagram based on given information.<br>
slide3. Probability of winning the UK lottery: 1 in 14,000,000 ___1___
14000000 0.000000714 0.0000714% Odds Form Fractional Form Decimal Form Percentage Form Which is best in this case? ? ? ? ?<br>
slide4. Combinatorics is the ‘number of ways of arranging something’.
We could consider how many things could do in each ‘slot’, then multiply these numbers together. How many 5 letter English words could there theoretically be? B I L B O 26 x 26 x 26 x 26 x 26 = 265 1 How many 5 letter English words with distinct letters could there be? S M A U G 26 x 25 x 24 x 23 x 22 = 7893600 2 How many ways of arranging the letters in SHELF? E L F H S 5 x 4 x 3 x 2 x 1 = 5! (“5 factorial”) 3 ? ? ? e.g.<br>
slide5. 1 2 3 4 5 N NN NNN OMG ? ? ? ? ? ? ? ?<br>
slide6. 1. We might just know! 2. We can do an experiment and count outcomes This is known as a: Theoretical Probability When we know the underlying probability of an event. We could throw the dice 100 times for example, and count how many times we see each outcome. This is known as an: Experimental Probability ? ? ?<br>
slide7. Question 2: What can we do to make the experimental probability be as close as possible to the true (theoretical) probability of Heads? No. It might for example be a fair coin: If we throw a fair coin 10 times we wouldn’t necessarily see 5 heads. In fact we could have seen 6 heads! So the relative frequency/experimental probability only provides a “sensible guess” for the true probability of Heads, based on what we’ve observed. Flip the coin lots of times. I we threw a coin just twice for example and saw 0 Heads, it’s hard to know how unfair our coin is. But if we threw it say 1000 times and saw 200 heads, then we’d have a much more accurate probability.
The law of large events states that as the number of trials becomes large, the experimental probability becomes closer to the true probability. ? ?<br>
slide8. A spinner has the letters A, B and C on it. I spin the spinner 50 times, and see A 12 times. What is the experimental probability for P(A)? The probability of getting a 6 on an unfair die is 0.3. I throw the die 200 times. How many sixes might you expect to get? ? ?<br>
slide9. The table below shows the probabilities for spinning an A, B and C on a spinner. If I spin the spinner 150 times, estimate the number of Cs I will see. P(C) = 1 – 0.12 – 0.34 = 0.54
Estimate Cs seen = 0.54 x 150 = 81 ? A B C I spin another spinner 120 times and see the following counts:
What is the relative frequency of B?
45/120 = 0.375 ? A B A B C<br>
slide10. 208. Write probabilities using fractions, percentages or decimals
209. Compare experimental data and theoretical probabilities. Compare relative frequencies from samples of different sizes.
210. Find the probability of successive events, such as several throws of a single die.
Identify different mutually exclusive outcomes and know that the sum of the probabilities of all these outcomes is 1.
211. Estimate the number of times an event will occur, given the probability and the number of trials.
212. List all outcomes for single events, and for two successive events, systematically. Use and draw sample space diagrams
213. Understand conditional probabilities. Use a tree diagram to calculate conditional probability.
214. Solve more complex problems involving combinations of outcomes.
215. Understand selection with or without replacement. Draw a probability tree diagram based on given information. <br>
slide11. Examples of events:
Throwing a 6, throwing an odd number, tossing a heads, a randomly chosen person having a height above 1.5m. The sample space is the set of all outcomes.
An event is a description of one or more outcomes. It is a subset of the sample space. 3 2 5 1 From Year 7 you should be familiar with representing sets using a Venn Diagram, although you won’t need to at GCSE. ? ? The sample space<br>
slide12. 1
8 ? ? ?<br>
slide13. !Mutually Exclusive Events ! Independent Events If A and B are mutually exclusive events, they can’t happen at the same time. Then:
P(A or B) = P(A) + P(B)<br>
slide14. 1 2 3 4 5 6 7 8 P(num divisible by 2) = P(num divisible by 4) = P(num divisible by 2 and by 4) = 1
2 1
4 1
4 Why would it have been wrong to multiply the probabilities? ? ? ?<br>
slide15. Getting a 6 on a die and a T on a coin. + × Hitting a bullseye or a triple 20. + × Getting a HHT or a THT after three throws of an unfair coin (presuming we’ve already worked out P(HHT) and P(THT). + × Getting 3 on the first throw of a die and a 4 on the second. + × Bart’s favourite colour being red and Pablo’s being blue. + × Shaan’s favourite colour being red or blue. + ×<br>
slide16. Event 1 No Yes Throwing a heads on the first flip. No Yes No Yes Event 2 Throwing a heads on the second flip. It rains tomorrow. It rains the day after. That I will choose maths at A Level. That I will choose Physics at A Level. Have a garden gnome. Being called Bart. No Yes<br>
slide17. a b c ? 1 2 2 3 ? ?<br>
slide18. Question: Given there’s 5 red balls and 2 blue balls. What’s the probability that after two picks we have a red ball and a blue ball? R B R B R B 5
7 2
7 4
6 2
6 5
6 1
6 ? ? ? ? ? ? After first pick, there’s less balls to choose from, so probabilities change. Bro Tip: Note that probabilities generally go on the lines, and events at the end.<br>
slide19. Question: Give there’s 5 red balls and 2 blue balls. What’s the probability that after two picks we have a red ball and a blue ball? R B R B R B 5
7 2
7 4
6 2
6 5
6 1
6 5
21 5
21 ? ? P(red and blue) = 10
21 ? We multiply across the matching branches, then add these values.<br>
slide20. ...with replacement:
The item is returned before another is chosen. The probability of each event on each trial is fixed. ...without replacement:
The item is not returned.
Total balls decreases by 1 each time.
Number of items of this type decreases by 1. Note that if the question doesn’t specify which, e.g. “You pick two balls from a bag”, then PRESUME WITHOUT REPLACEMENT.<br>
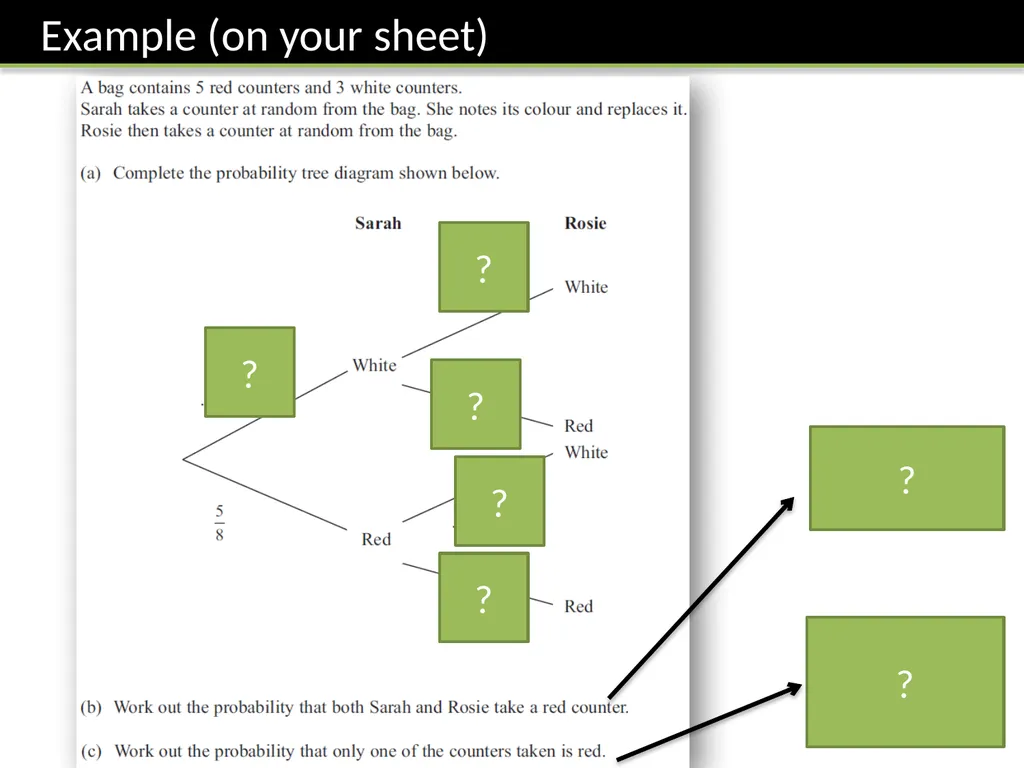
slide21. ? ? 3
8 3
8 5
8 5
8 3
8 ? ? ? ? ?<br>
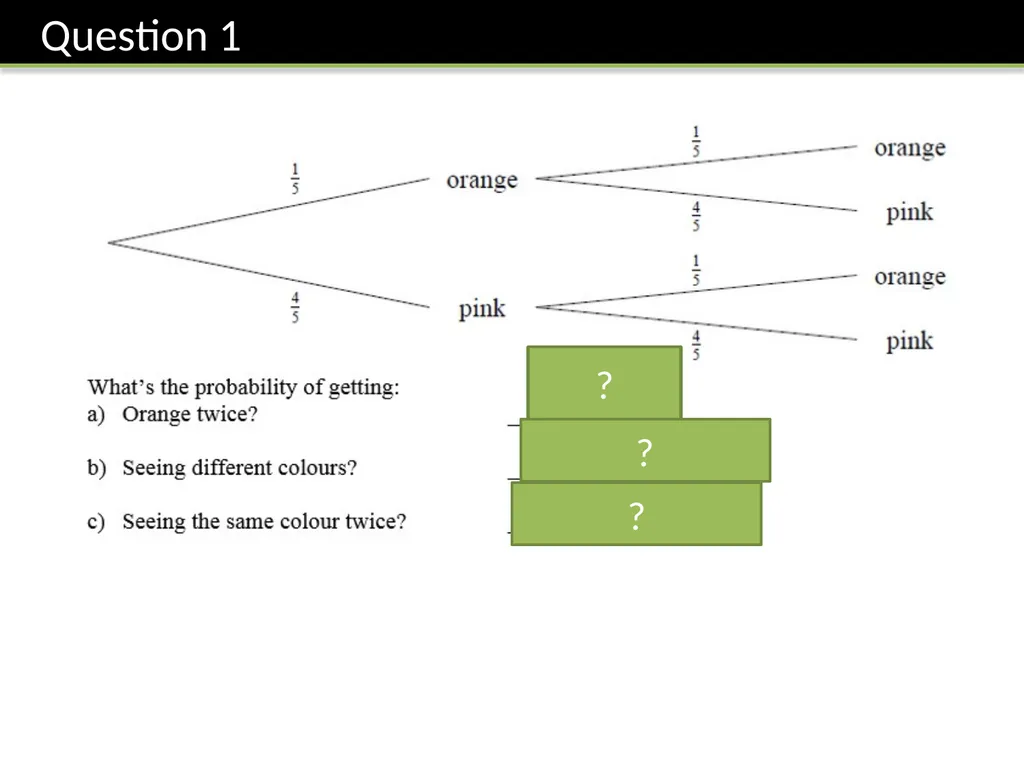
slide22. ? ? ?<br>
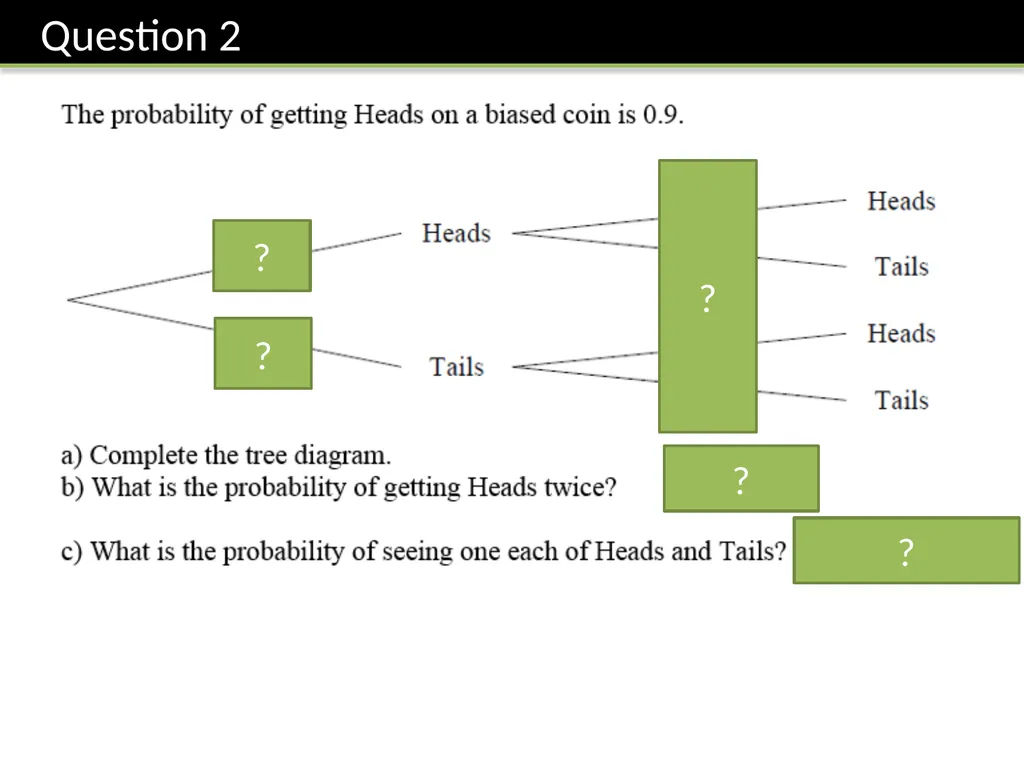
slide23. ? ? ? ? ?<br>
slide24. two consonants? ? ? ? ? ?<br>
slide25. ? ? ? ? ?<br>
slide26. ? ? ? ?<br>
slide27. 64
110 ? ?<br>
slide28. ?<br>
slide29. ?<br>
slide30. ?<br>
slide31. 1904
4495 ? Answer = BGG:
GBG:
GGB: It’s usually quicker to just list the outcomes rather than draw a tree. ? Working<br>
slide32. Q N ? ?<br>
slide33. Provided on sheet. Remember:
List the possible events that match.
Find the probability of each (by multiplying).
Add them together.<br>
slide34. ?<br>
slide35. ?<br>
slide36. ?<br>
slide37. 2
42 16
42 ? ?<br>
slide38. 222
380 ?<br>
slide39. 64
110 ? ?<br>
slide40. ?<br>
slide41. ?<br>