
INTEGRATED / STAKEHOLDER REPORTING: WHAT, WHY, HOW
CS
Published · 28 slides · 0 views
1 / 1
Description
INTEGRATED STAKEHOLDER REPORTING: WHAT, WHY, HOW and WHEN? 1 Business Forum: Panel Session 4 Reporting Communications 14th October, 2014 Pavan Sukhdev Study Leader, TEEB CEO, GIST Advisory Statutory Reporting Financial Reporting
Related Topics
Download this presentation From Below
"INTEGRATED / STAKEHOLDER REPORTING: WHAT, WHY, HOW" is the property of its rightful owner. Permission is granted to download and print the materials on this website for personal, non-commercial use only, and to display it on your personal computer provided you do not modify the materials and that you retain all copyright notices contained in the materials. By downloading content from our website, you accept the terms of this agreement.
Share
Embed code
Presentation Transcript
01
INTEGRATED / STAKEHOLDER REPORTING: WHAT, WHY, HOW and WHEN? 1 Business Forum: Panel Session #4 Reporting & Communications
14th October, 2014 Pavan Sukhdev
Study Leader, TEEB
CEO, GIST Advisory<br>
14th October, 2014 Pavan Sukhdev
Study Leader, TEEB
CEO, GIST Advisory<br>
02
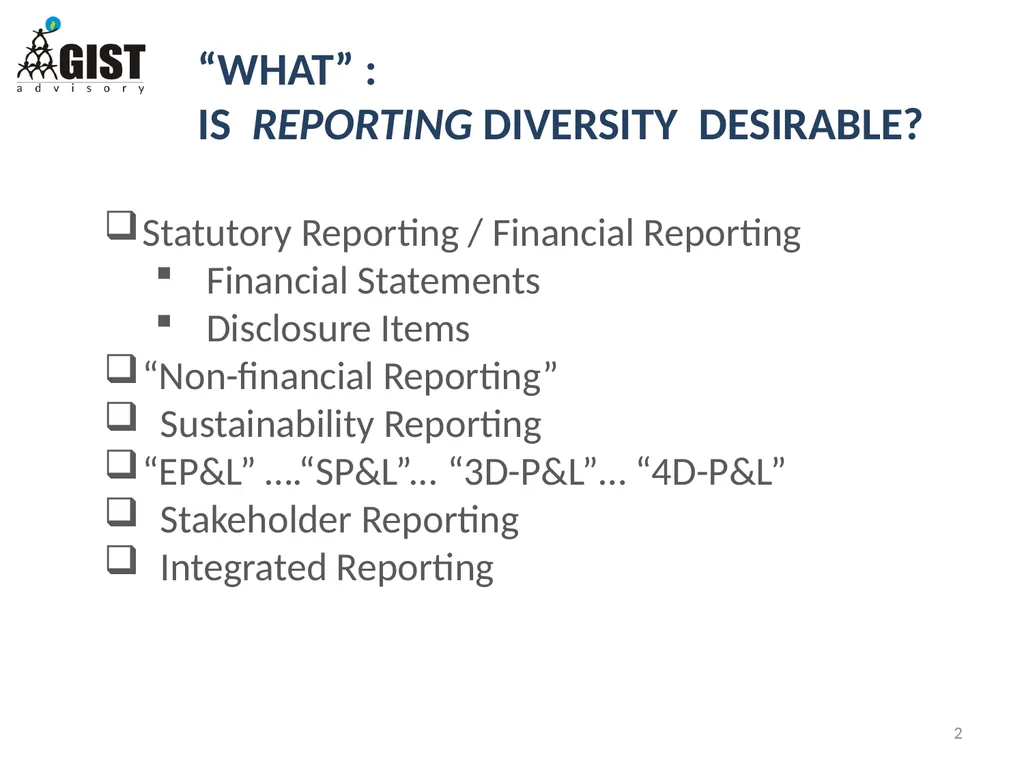
Statutory Reporting / Financial Reporting
Financial Statements
Disclosure Items
“Non-financial Reporting”
Sustainability Reporting
“EP&L” ….“SP&L”... “3D-P&L”… “4D-P&L”
Stakeholder Reporting
Integrated Reporting 2 “WHAT” :
IS REPORTING DIVERSITY DESIRABLE?<br>
Financial Statements
Disclosure Items
“Non-financial Reporting”
Sustainability Reporting
“EP&L” ….“SP&L”... “3D-P&L”… “4D-P&L”
Stakeholder Reporting
Integrated Reporting 2 “WHAT” :
IS REPORTING DIVERSITY DESIRABLE?<br>
03
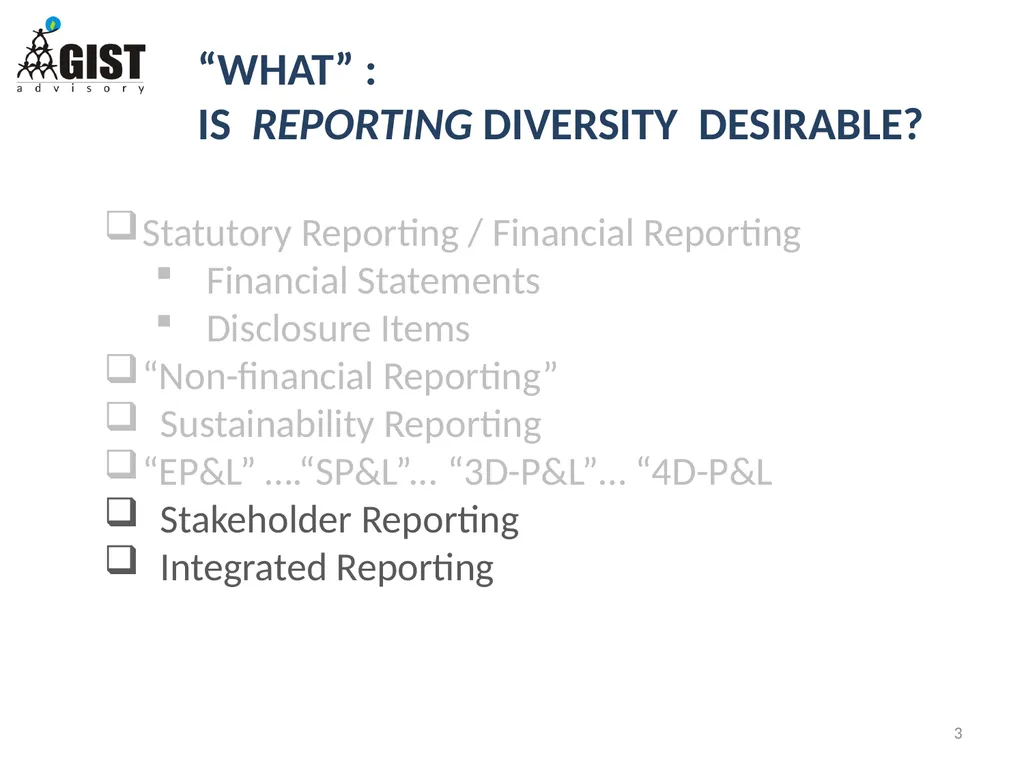
Statutory Reporting / Financial Reporting
Financial Statements
Disclosure Items
“Non-financial Reporting”
Sustainability Reporting
“EP&L” ….“SP&L”... “3D-P&L”… “4D-P&L
Stakeholder Reporting
Integrated Reporting 3 “WHAT” :
IS REPORTING DIVERSITY DESIRABLE?<br>
Financial Statements
Disclosure Items
“Non-financial Reporting”
Sustainability Reporting
“EP&L” ….“SP&L”... “3D-P&L”… “4D-P&L
Stakeholder Reporting
Integrated Reporting 3 “WHAT” :
IS REPORTING DIVERSITY DESIRABLE?<br>
04
“WHY” : TRANSPARENCY 4 Transparency: “accessibility of information to stakeholders of institutions, regarding matters that affect their interests”
~ Don Tapscott & David Ticoll, 2003
“Business-as-usual” is increasingly difficult in an age of instant communication.
Whistle-blowers, inquisitive media, self-aware consumers and citizen activists routinely monitor and comment on every action of the firm far beyond its financial performance.
Transparency thus is essential for businesses with brand values & reputation to protect.
EXAMPLE: In the 1990’s, Nike faced a coordinated campaign by NGOs against its tolerance of labor practices in South East Asian production facilities that had a direct impact on the company’s brand value and reputation (Zadek 2004, Esbenshade 2004, pp. 119-120).<br>
~ Don Tapscott & David Ticoll, 2003
“Business-as-usual” is increasingly difficult in an age of instant communication.
Whistle-blowers, inquisitive media, self-aware consumers and citizen activists routinely monitor and comment on every action of the firm far beyond its financial performance.
Transparency thus is essential for businesses with brand values & reputation to protect.
EXAMPLE: In the 1990’s, Nike faced a coordinated campaign by NGOs against its tolerance of labor practices in South East Asian production facilities that had a direct impact on the company’s brand value and reputation (Zadek 2004, Esbenshade 2004, pp. 119-120).<br>
05
“WHY”
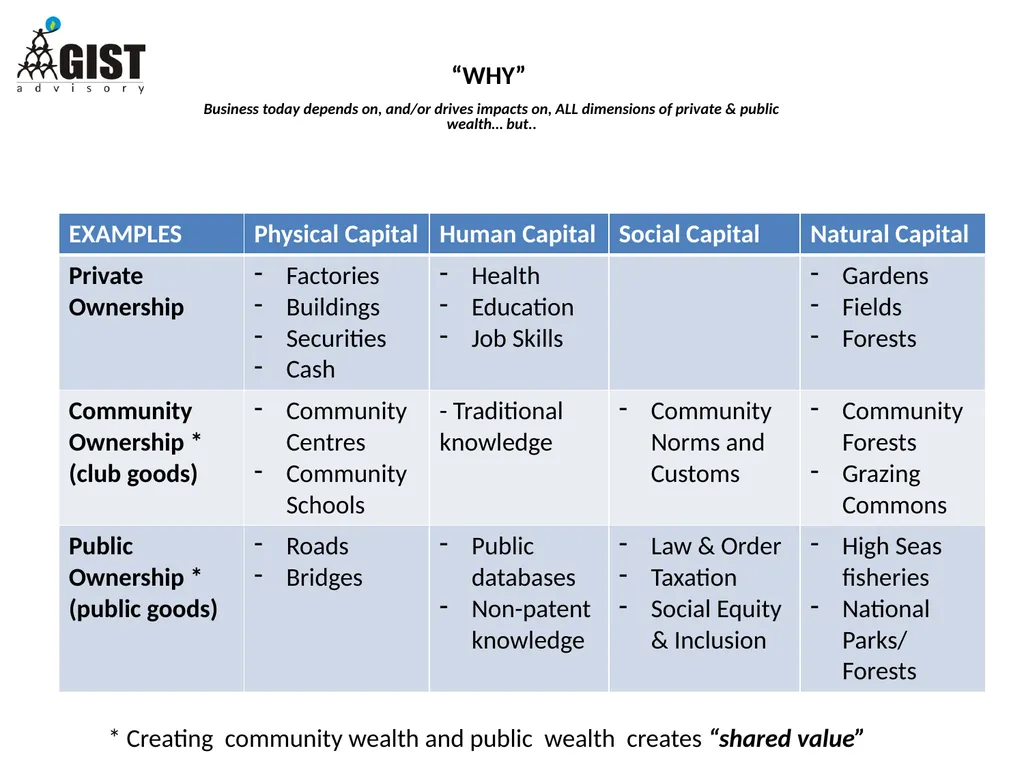
Business today depends on, and/or drives impacts on, ALL dimensions of private & public wealth… but.. * Creating community wealth and public wealth creates “shared value”<br>
06
“WHY”
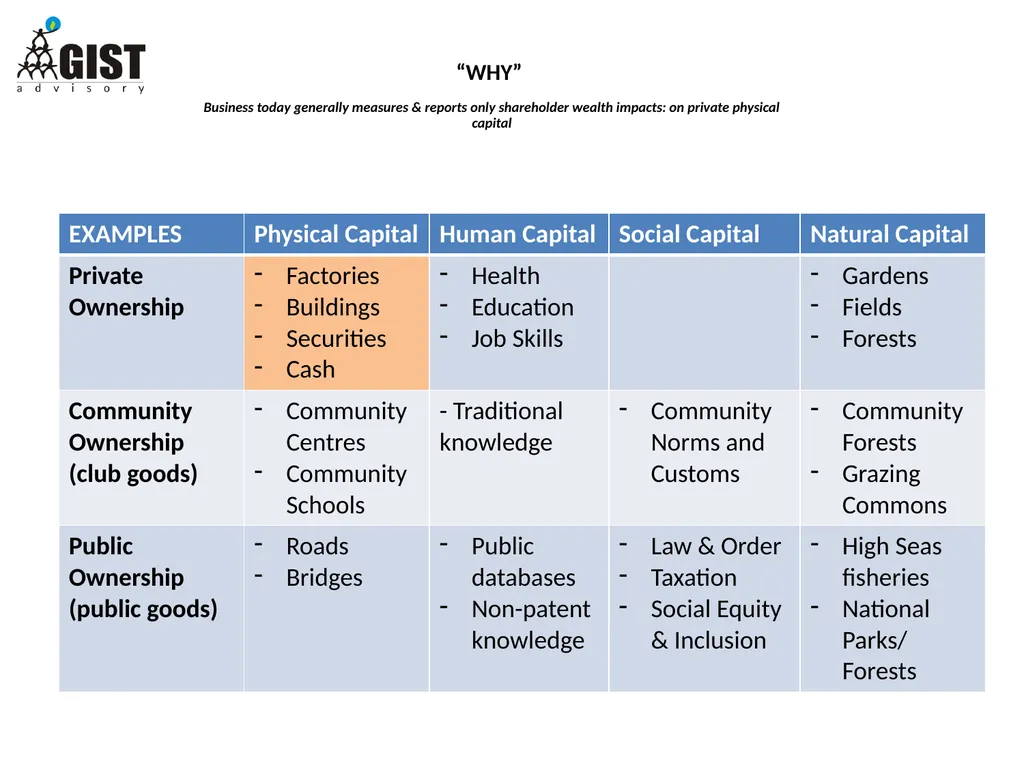
Business today generally measures & reports only shareholder wealth impacts: on private physical capital<br>
07
“WHY”
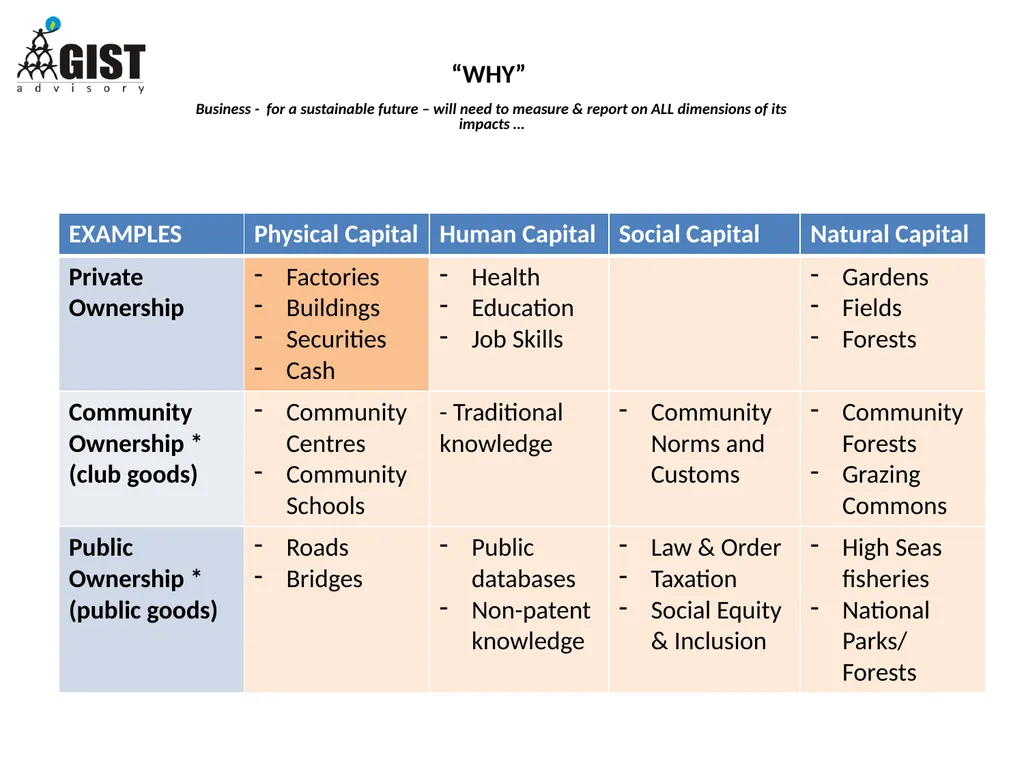
Business - for a sustainable future – will need to measure & report on ALL dimensions of its impacts …<br>
08
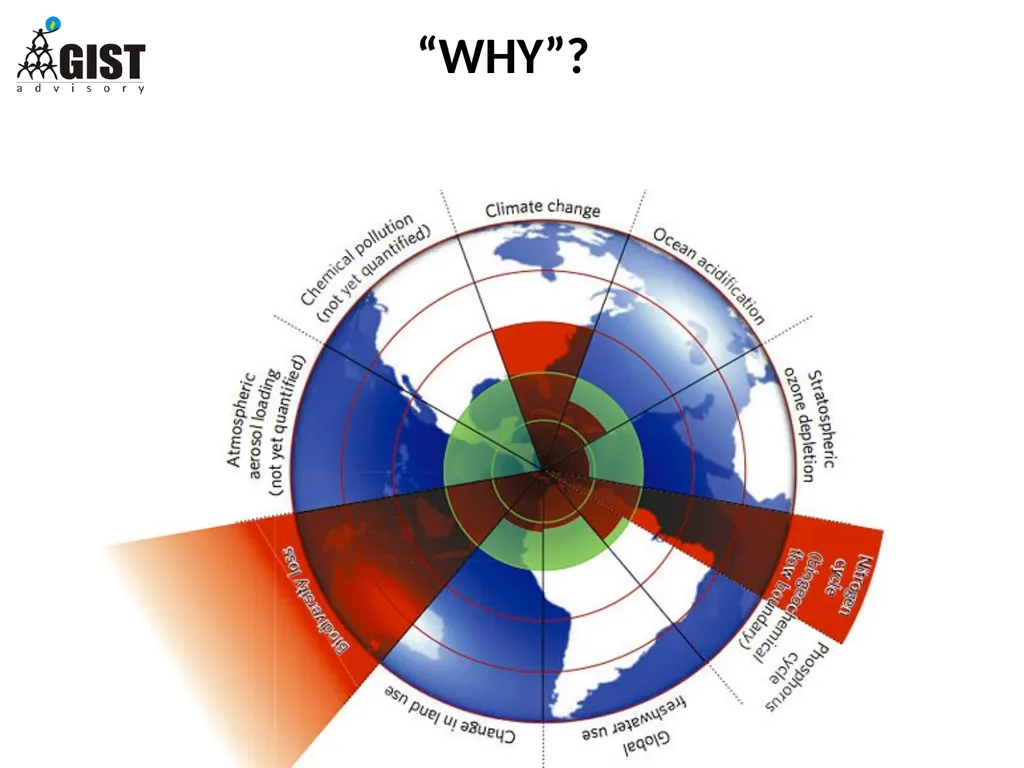
“WHY”?<br>
09
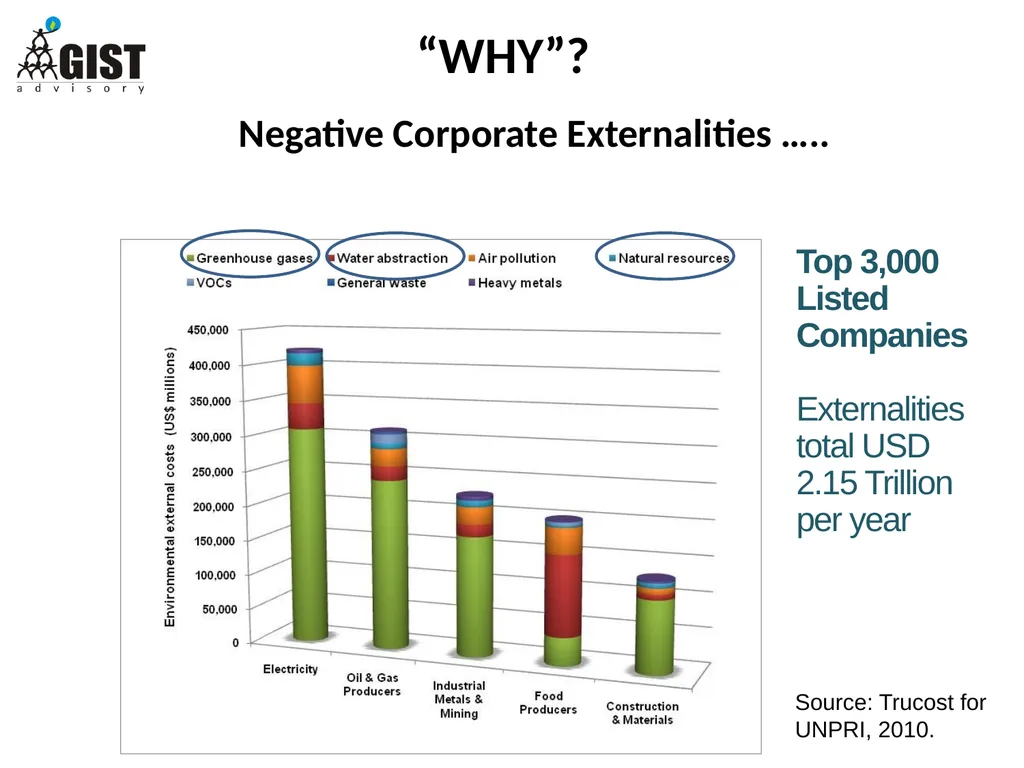
Source: Trucost for UNPRI, 2010. Top 3,000 Listed Companies
Externalities total USD 2.15 Trillion per year Negative Corporate Externalities ….. “WHY”?<br>
Externalities total USD 2.15 Trillion per year Negative Corporate Externalities ….. “WHY”?<br>
10
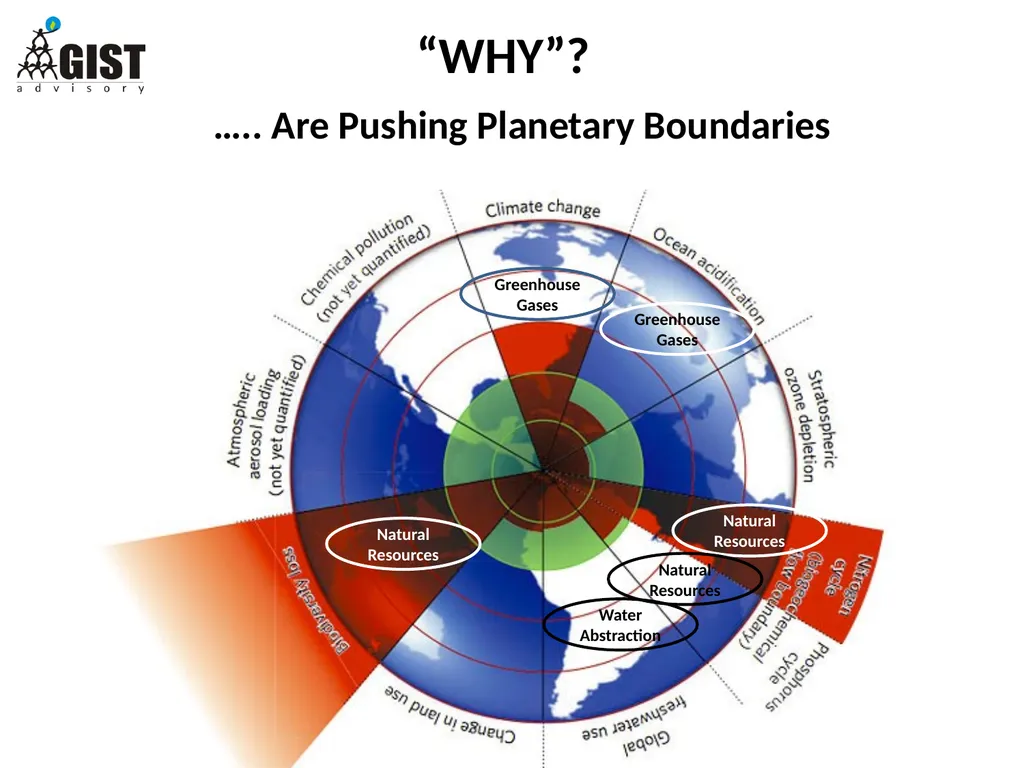
Water Abstraction Greenhouse Gases Greenhouse Gases Natural Resources Natural Resources Natural Resources ….. Are Pushing Planetary Boundaries “WHY”?<br>
11
“WHY”: 11 FOUR KEY BENEFITS OF INTEGRATED REPORTING
Lower Risk Profile: Companies which integrate sustainability into their core business lower their risk profiles, enhance brands, achieve better reputation (Mays Report. 2003).
Strategic management of brand and reputation: by far the most significant driver behind non-financial reporting (NFR).
Cost-efficiencies and new opportunities via better management of business’s natural, social and human capital externalities.
Traditional corporate reporting is unable to effectively communicate to investors and other stakeholders how a business creates value and manages the risks it faces.<br>
Lower Risk Profile: Companies which integrate sustainability into their core business lower their risk profiles, enhance brands, achieve better reputation (Mays Report. 2003).
Strategic management of brand and reputation: by far the most significant driver behind non-financial reporting (NFR).
Cost-efficiencies and new opportunities via better management of business’s natural, social and human capital externalities.
Traditional corporate reporting is unable to effectively communicate to investors and other stakeholders how a business creates value and manages the risks it faces.<br>
12
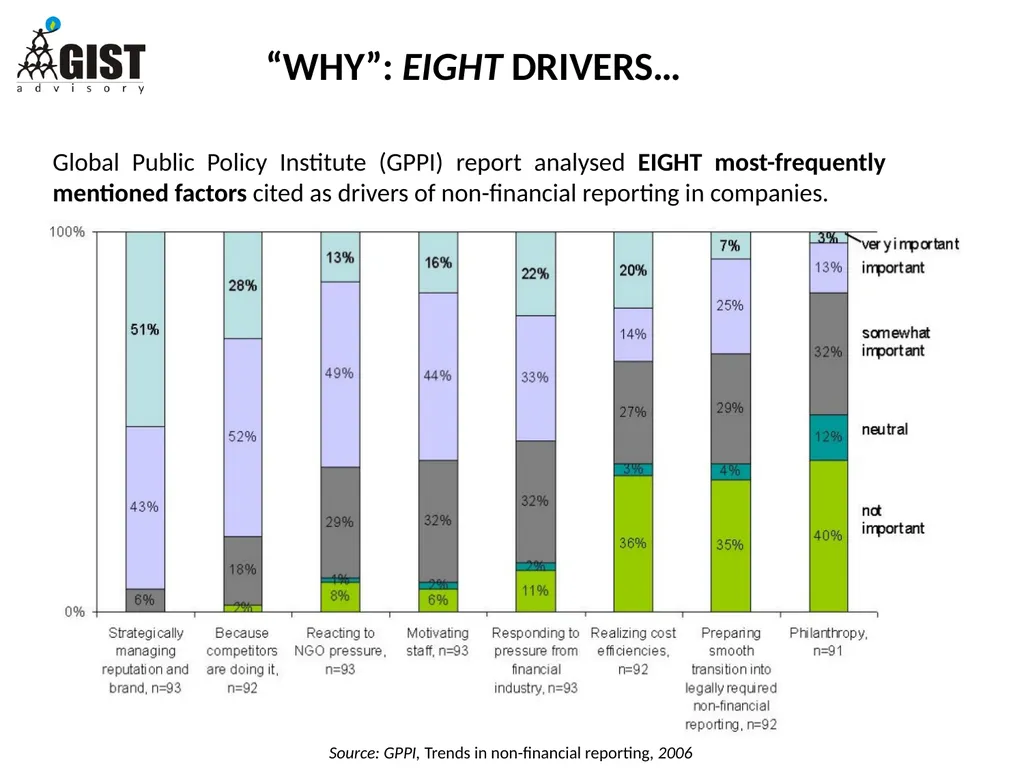
12 Global Public Policy Institute (GPPI) report analysed EIGHT most-frequently mentioned factors cited as drivers of non-financial reporting in companies. Source: GPPI, Trends in non-financial reporting, 2006 “WHY”: EIGHT DRIVERS…<br>
13
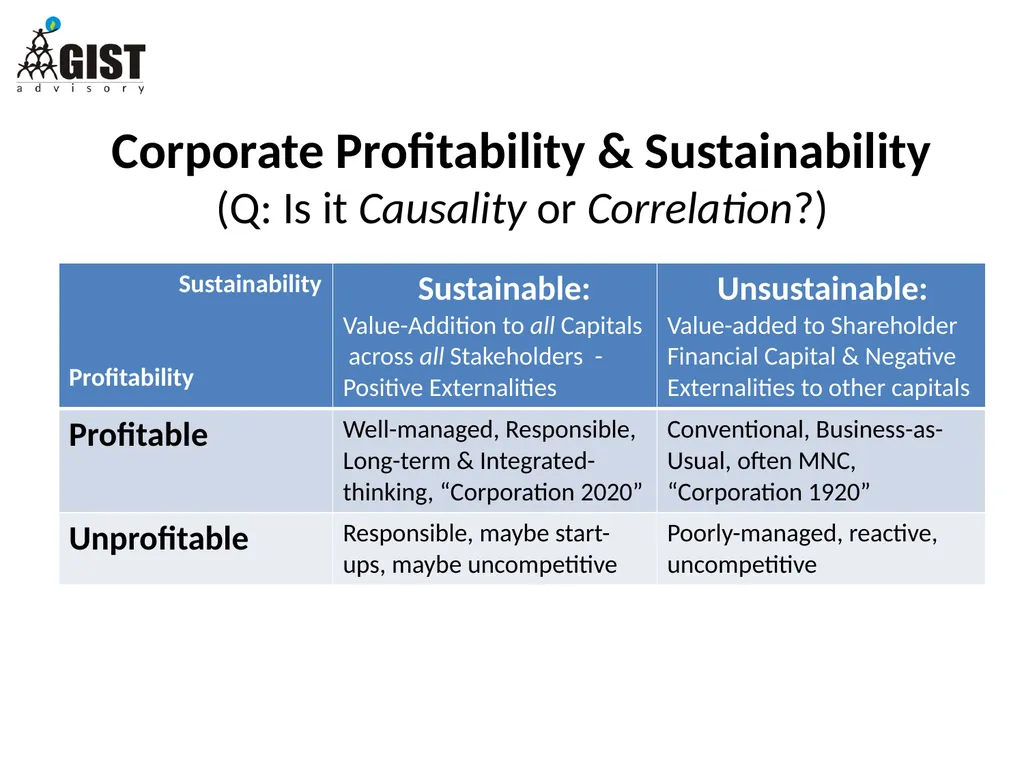
Corporate Profitability & Sustainability
(Q: Is it Causality or Correlation?)<br>
14
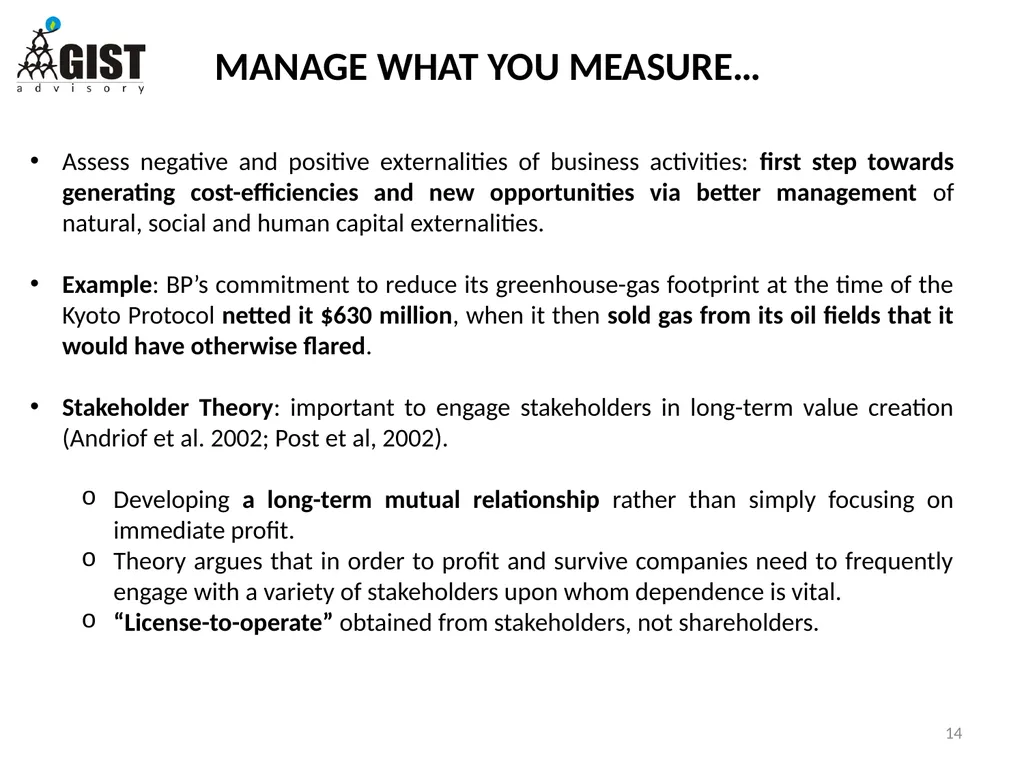
MANAGE WHAT YOU MEASURE… 14 Assess negative and positive externalities of business activities: first step towards generating cost-efficiencies and new opportunities via better management of natural, social and human capital externalities.
Example: BP’s commitment to reduce its greenhouse-gas footprint at the time of the Kyoto Protocol netted it $630 million, when it then sold gas from its oil fields that it would have otherwise flared.
Stakeholder Theory: important to engage stakeholders in long-term value creation (Andriof et al. 2002; Post et al, 2002).
Developing a long-term mutual relationship rather than simply focusing on immediate profit.
Theory argues that in order to profit and survive companies need to frequently engage with a variety of stakeholders upon whom dependence is vital.
“License-to-operate” obtained from stakeholders, not shareholders.<br>
Example: BP’s commitment to reduce its greenhouse-gas footprint at the time of the Kyoto Protocol netted it $630 million, when it then sold gas from its oil fields that it would have otherwise flared.
Stakeholder Theory: important to engage stakeholders in long-term value creation (Andriof et al. 2002; Post et al, 2002).
Developing a long-term mutual relationship rather than simply focusing on immediate profit.
Theory argues that in order to profit and survive companies need to frequently engage with a variety of stakeholders upon whom dependence is vital.
“License-to-operate” obtained from stakeholders, not shareholders.<br>
15
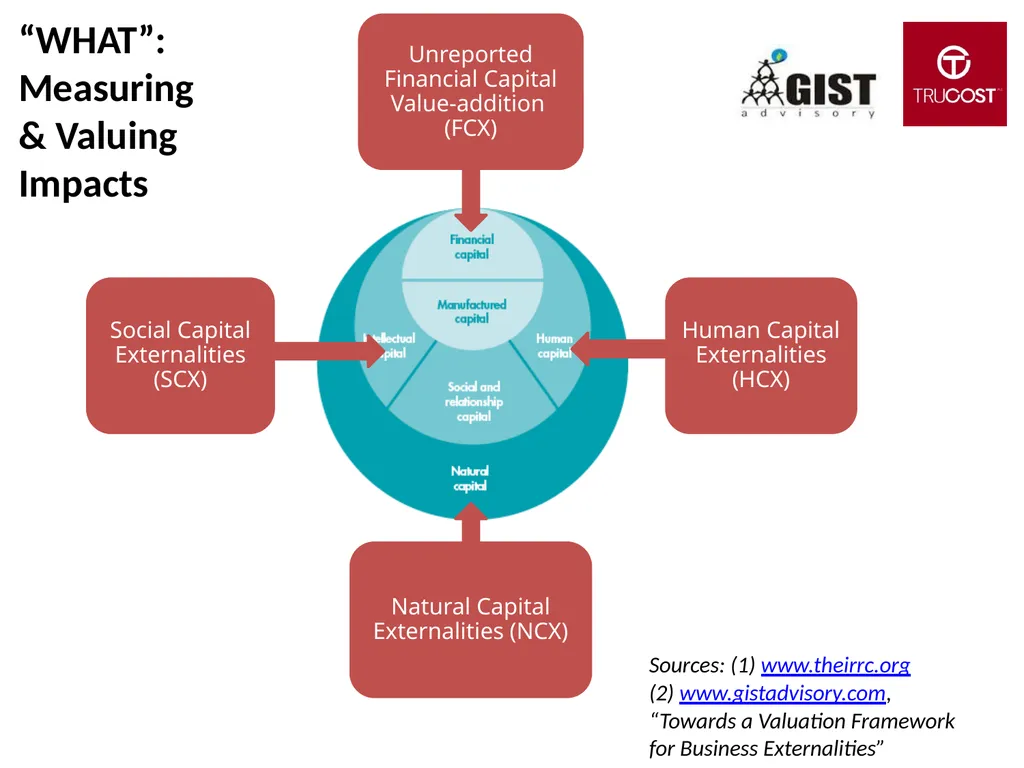
Sources: (1) www.theirrc.org
(2) www.gistadvisory.com, “Towards a Valuation Framework for Business Externalities” “WHAT”:
Measuring & Valuing
Impacts<br>
(2) www.gistadvisory.com, “Towards a Valuation Framework for Business Externalities” “WHAT”:
Measuring & Valuing
Impacts<br>
16
Thank You ! www.gistadvisory.com
www.corp2020.com Pavan Sukhdev,
Founder & CEO, GIST Advisory
pavan@gistadvisory.com<br>
www.corp2020.com Pavan Sukhdev,
Founder & CEO, GIST Advisory
pavan@gistadvisory.com<br>
17
PRINCIPLE: MATERIALITY 17 Valuation & Reporting must focus on material externalities.
GRI Materiality Principle1: “The information in a report should reflect the organization’s significant economic, environmental and social impacts, or information that would substantively influence the assessments and decisions of stakeholders”.
Major global initiatives for integrated reporting include
Global Reporting Initiative (GRI) Guidelines;
country-specific National Voluntary Guidelines (NVGs) and
Business Responsibility Reporting (BRR) regulations;
IIRC’s <IR> Framework;
Natural Capital Coalition’s “Protocol” (TBC/ end-2015) etc.<br>
GRI Materiality Principle1: “The information in a report should reflect the organization’s significant economic, environmental and social impacts, or information that would substantively influence the assessments and decisions of stakeholders”.
Major global initiatives for integrated reporting include
Global Reporting Initiative (GRI) Guidelines;
country-specific National Voluntary Guidelines (NVGs) and
Business Responsibility Reporting (BRR) regulations;
IIRC’s <IR> Framework;
Natural Capital Coalition’s “Protocol” (TBC/ end-2015) etc.<br>
18
TARGETS & DRIVERS OF INTEGRATED REPORTING
Business Drivers & Regulatory Interest 18<br>
Business Drivers & Regulatory Interest 18<br>
19
WHY INTEGRATED REPORTING? 19 Global Financial Crisis
Demonstrated the interconnectedness of global markets
Need to offer their stakeholders more than just financial information and that this information needs to be presented in a concise, clear and ‘digestible’ way.
Short-Termism
Average time that US institutional investors hold stock in a particular company has fallen from seven years to seven months.
Created a distorting effect on business decision-making
Technological Advances on Information Flows, Volume and Demand
New challenges for businesses as they deal with faster and vaster flows of information, inside the company and externally with stakeholders
Age of radical transparency: managing reputation and communications is increasingly paramount<br>
Demonstrated the interconnectedness of global markets
Need to offer their stakeholders more than just financial information and that this information needs to be presented in a concise, clear and ‘digestible’ way.
Short-Termism
Average time that US institutional investors hold stock in a particular company has fallen from seven years to seven months.
Created a distorting effect on business decision-making
Technological Advances on Information Flows, Volume and Demand
New challenges for businesses as they deal with faster and vaster flows of information, inside the company and externally with stakeholders
Age of radical transparency: managing reputation and communications is increasingly paramount<br>
20
DRIVERS OF INTEGRATED REPORTING 20 Business Risks
Corporations sit at the junction of finance, society and the environment.
Four out of top ten risks identified by the World Economic Forum (WEF) relate to the natural environment (Global Risks Report, 2014):
Water crises
Failure of climate change mitigation and adaptation
Greater incidence of extreme weather events
Food crises
These risks now pose an interconnected threat to the global economy and, by extension, the way we do business.
International Consensus
“Risks and opportunities cannot be isolated, but need to be managed in a holistic way to foster the conditions for financial stability and growth, allied to developments in human talent and intellectual property, all within the limits of planetary boundaries and matched by a commitment to the long term stewardship of financial resources and physical assets”.
~ Christine Lagarde, IMF, 2014<br>
Corporations sit at the junction of finance, society and the environment.
Four out of top ten risks identified by the World Economic Forum (WEF) relate to the natural environment (Global Risks Report, 2014):
Water crises
Failure of climate change mitigation and adaptation
Greater incidence of extreme weather events
Food crises
These risks now pose an interconnected threat to the global economy and, by extension, the way we do business.
International Consensus
“Risks and opportunities cannot be isolated, but need to be managed in a holistic way to foster the conditions for financial stability and growth, allied to developments in human talent and intellectual property, all within the limits of planetary boundaries and matched by a commitment to the long term stewardship of financial resources and physical assets”.
~ Christine Lagarde, IMF, 2014<br>
21
REGULATORY INTEREST IN INTEGRATED REPORTING 21 South Africa
“King III” Corporate Governance Code
Support for International <IR> Framework and its intention to converge practice with the principles set out in the Framework
Brazil (BM&F BOVESPA)
Encouraging businesses listed on its platform to produce an integrated report (or sustainability report) on a ‘report-or-explain’ basis
Singapore
<IR> as an integral part of, “transforming Singapore into a leading global accounting hub for the Asia Pacific region by 2020”.
<IR> Steering Committee: identified five work-streams to drive forward <IR> adoption in Singapore.<br>
“King III” Corporate Governance Code
Support for International <IR> Framework and its intention to converge practice with the principles set out in the Framework
Brazil (BM&F BOVESPA)
Encouraging businesses listed on its platform to produce an integrated report (or sustainability report) on a ‘report-or-explain’ basis
Singapore
<IR> as an integral part of, “transforming Singapore into a leading global accounting hub for the Asia Pacific region by 2020”.
<IR> Steering Committee: identified five work-streams to drive forward <IR> adoption in Singapore.<br>
22
22 USA
Section 313 of EPCRA established the Toxics Release Inventory (TRI)
Mandatory for US facilities across identified industry sectors to report annually how much of each chemical is released and/or managed through recycling, energy recovery and treatment.
TRI creates a strong incentive for companies to improve environmental performance.
India
Section 135 of the Companies Act 2013, sets a global precedence for regulatory policy, by making it mandatory for public and private companies to invest in CSR
Businesses falling under the ambit of the Act must invest 2% of its average net profits (of three preceding years) in CSR activities listed in Schedule VII of the Act
Also, businesses must report on amount spent and the impact of such spending via annual business responsibility reports (BRR)
Act seeks to bring CSR to the forefront of business decision making via “spend-disclose-or explain” mandate REGULATORY INTEREST IN INTEGRATED REPORTING<br>
Section 313 of EPCRA established the Toxics Release Inventory (TRI)
Mandatory for US facilities across identified industry sectors to report annually how much of each chemical is released and/or managed through recycling, energy recovery and treatment.
TRI creates a strong incentive for companies to improve environmental performance.
India
Section 135 of the Companies Act 2013, sets a global precedence for regulatory policy, by making it mandatory for public and private companies to invest in CSR
Businesses falling under the ambit of the Act must invest 2% of its average net profits (of three preceding years) in CSR activities listed in Schedule VII of the Act
Also, businesses must report on amount spent and the impact of such spending via annual business responsibility reports (BRR)
Act seeks to bring CSR to the forefront of business decision making via “spend-disclose-or explain” mandate REGULATORY INTEREST IN INTEGRATED REPORTING<br>
23
IMPACT OF REGULATION ON INTEGRATED REPORTING & BUSINESS CREDIBILITY 23 STUDY: Ioannis Ioannou and George Serafeim, (2012) ‘The consequence of mandatory corporate sustainability reporting’, by, London and Harvard Business Schools Examined the effect of mandatory corporate sustainability reporting (MCSR) on several measures of social responsibility using both country and firm-level data for 58 countries.
After the adoption of appropriate laws & regulations, the social responsibility of business leaders increases and both sustainable development and employee training become a higher priority for companies.
Corporate governance improves and on average, companies implement more ethical practices, bribery and corruption decrease, and managerial credibility increases.
These effects are larger for countries with stronger law enforcement and more widespread assurance of sustainability reports
For sample group; energy as well as waste and water consumption significantly declined & investments in employee training significantly increased Source: http://www.hbs.edu/faculty/Publication%20Files/11-100_35684ae7-fcdc-4aae-9626-de4b2acb1748.pdf<br>
After the adoption of appropriate laws & regulations, the social responsibility of business leaders increases and both sustainable development and employee training become a higher priority for companies.
Corporate governance improves and on average, companies implement more ethical practices, bribery and corruption decrease, and managerial credibility increases.
These effects are larger for countries with stronger law enforcement and more widespread assurance of sustainability reports
For sample group; energy as well as waste and water consumption significantly declined & investments in employee training significantly increased Source: http://www.hbs.edu/faculty/Publication%20Files/11-100_35684ae7-fcdc-4aae-9626-de4b2acb1748.pdf<br>
24
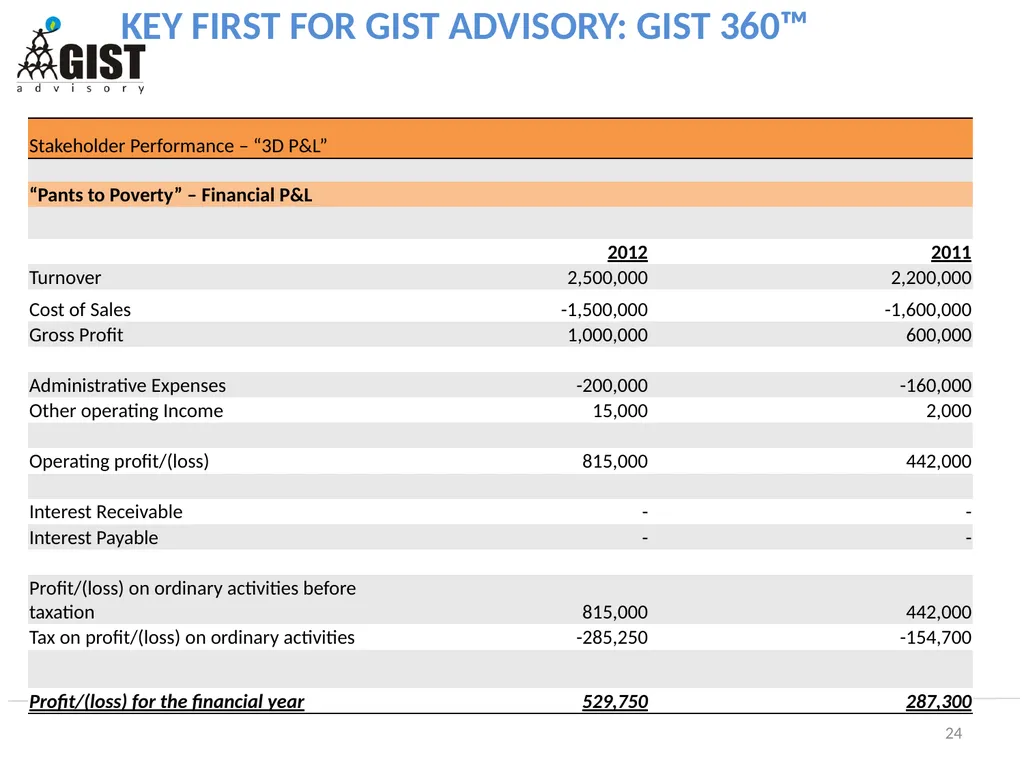
24 KEY FIRST FOR GIST ADVISORY: GIST 360™<br>
25
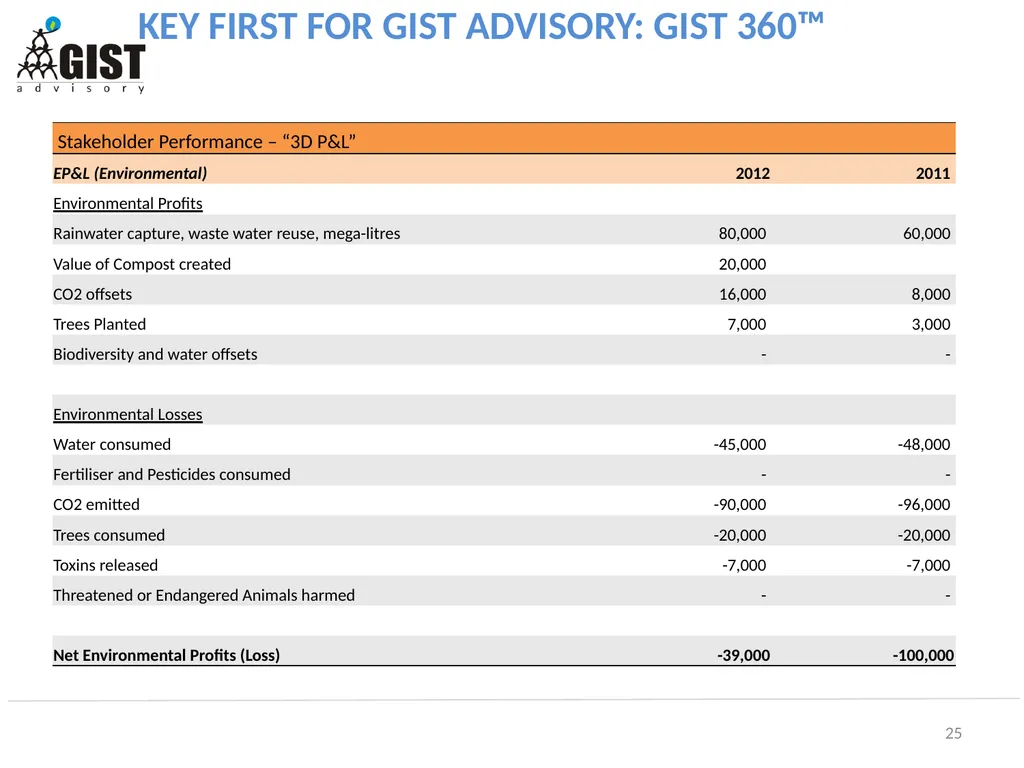
25 KEY FIRST FOR GIST ADVISORY: GIST 360™<br>
26
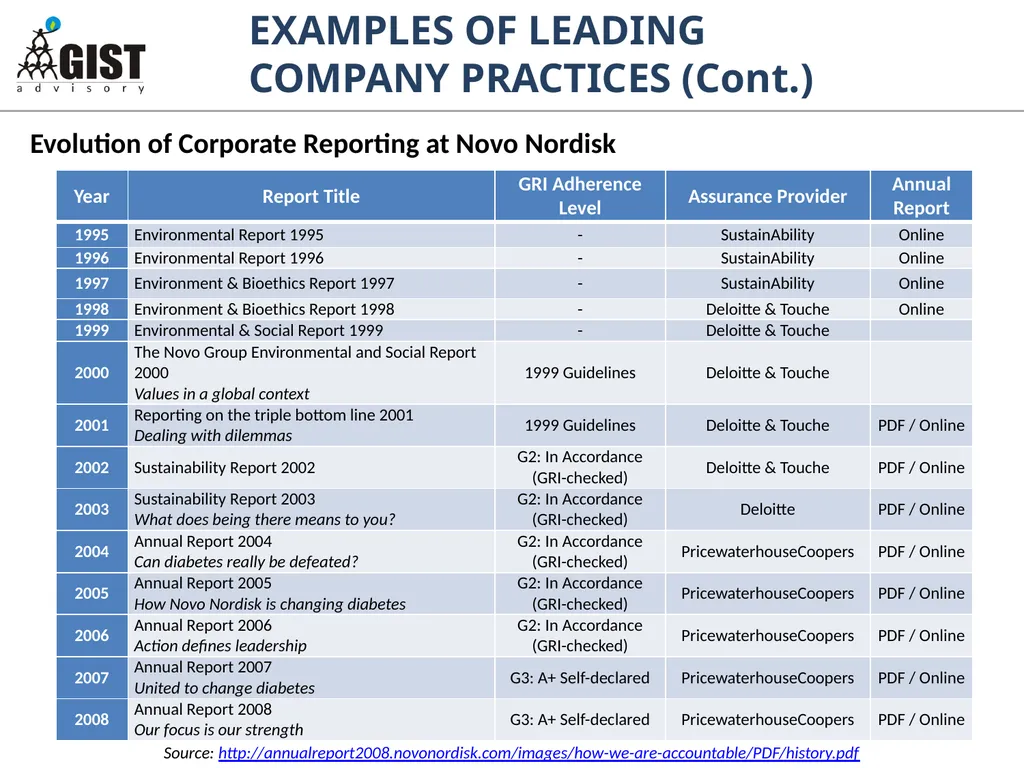
EXAMPLES OF LEADING COMPANY PRACTICES (Cont.) 26 Evolution of Corporate Reporting at Novo Nordisk Source: http://annualreport2008.novonordisk.com/images/how-we-are-accountable/PDF/history.pdf<br>
27
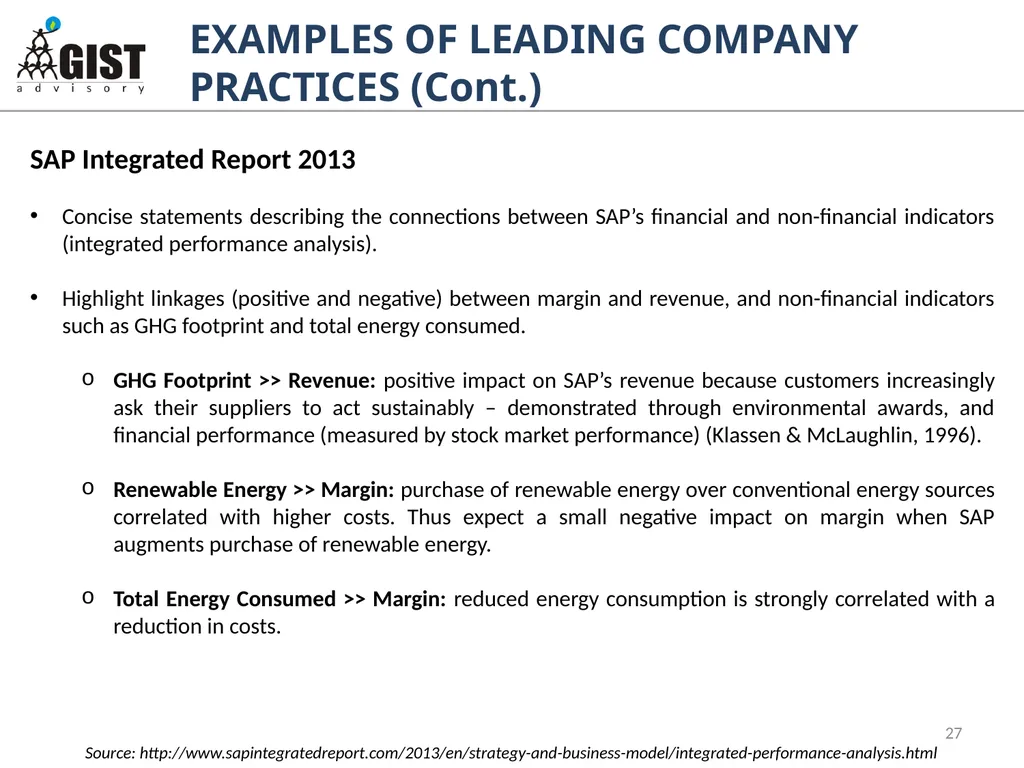
EXAMPLES OF LEADING COMPANY PRACTICES (Cont.) 27 SAP Integrated Report 2013
Concise statements describing the connections between SAP’s financial and non-financial indicators (integrated performance analysis).
Highlight linkages (positive and negative) between margin and revenue, and non-financial indicators such as GHG footprint and total energy consumed.
GHG Footprint >> Revenue: positive impact on SAP’s revenue because customers increasingly ask their suppliers to act sustainably – demonstrated through environmental awards, and financial performance (measured by stock market performance) (Klassen & McLaughlin, 1996).
Renewable Energy >> Margin: purchase of renewable energy over conventional energy sources correlated with higher costs. Thus expect a small negative impact on margin when SAP augments purchase of renewable energy.
Total Energy Consumed >> Margin: reduced energy consumption is strongly correlated with a reduction in costs. Source: http://www.sapintegratedreport.com/2013/en/strategy-and-business-model/integrated-performance-analysis.html<br>
Concise statements describing the connections between SAP’s financial and non-financial indicators (integrated performance analysis).
Highlight linkages (positive and negative) between margin and revenue, and non-financial indicators such as GHG footprint and total energy consumed.
GHG Footprint >> Revenue: positive impact on SAP’s revenue because customers increasingly ask their suppliers to act sustainably – demonstrated through environmental awards, and financial performance (measured by stock market performance) (Klassen & McLaughlin, 1996).
Renewable Energy >> Margin: purchase of renewable energy over conventional energy sources correlated with higher costs. Thus expect a small negative impact on margin when SAP augments purchase of renewable energy.
Total Energy Consumed >> Margin: reduced energy consumption is strongly correlated with a reduction in costs. Source: http://www.sapintegratedreport.com/2013/en/strategy-and-business-model/integrated-performance-analysis.html<br>
28
Thank You ! www.gistadvisory.com
www.corp2020.com Pavan Sukhdev,
Founder & CEO, GIST Advisory
pavan@gistadvisory.com<br>
www.corp2020.com Pavan Sukhdev,
Founder & CEO, GIST Advisory
pavan@gistadvisory.com<br>