Interpreting box plots Mathematics Standard Stage 6 (Year 11) Unit 1 getting healthy Learning intentions and success criteria Learning intentions To understand how to compare the use of range and interquartile range (IQR) as measures of
"Interpreting box plots Mathematics Standard –" is the property of its rightful owner. Permission is granted to
download and print the materials on this website for personal, non-commercial use only, and to display it
on your personal computer provided you do not modify the materials and that you retain all copyright
notices contained in the materials. By downloading content from our website, you accept the terms of this
agreement.
Presentation Transcript
01
Interpreting box plots Mathematics Standard – Stage 6 (Year 11) Unit 1 – getting healthy<br>
02
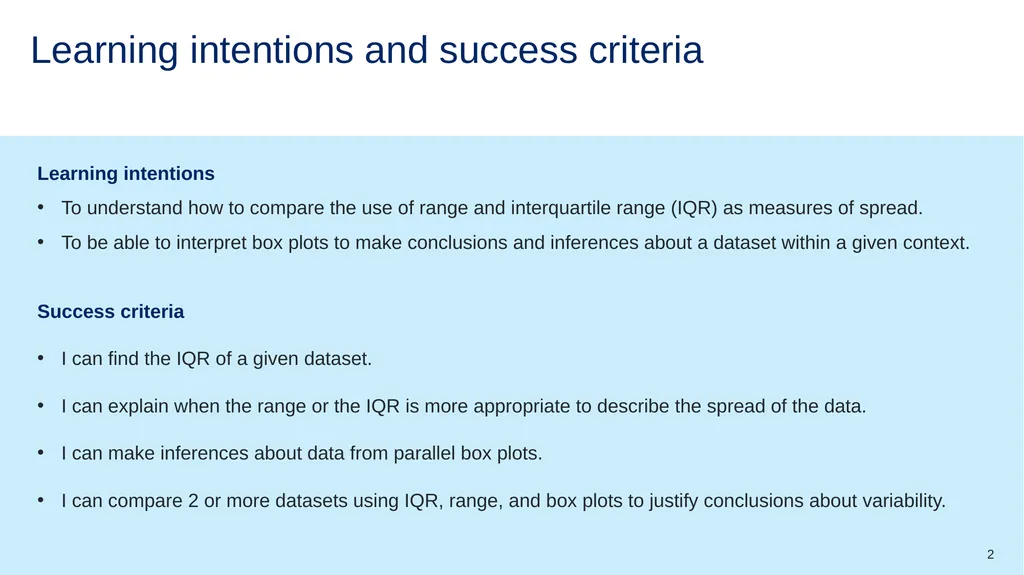
Learning intentions and success criteria Learning intentions
To understand how to compare the use of range and interquartile range (IQR) as measures of spread.
To be able to interpret box plots to make conclusions and inferences about a dataset within a given context.
Success criteria
I can find the IQR of a given dataset.
I can explain when the range or the IQR is more appropriate to describe the spread of the data.
I can make inferences about data from parallel box plots.
I can compare 2 or more datasets using IQR, range, and box plots to justify conclusions about variability. 2<br>
03
Activating prior knowledge<br>
04
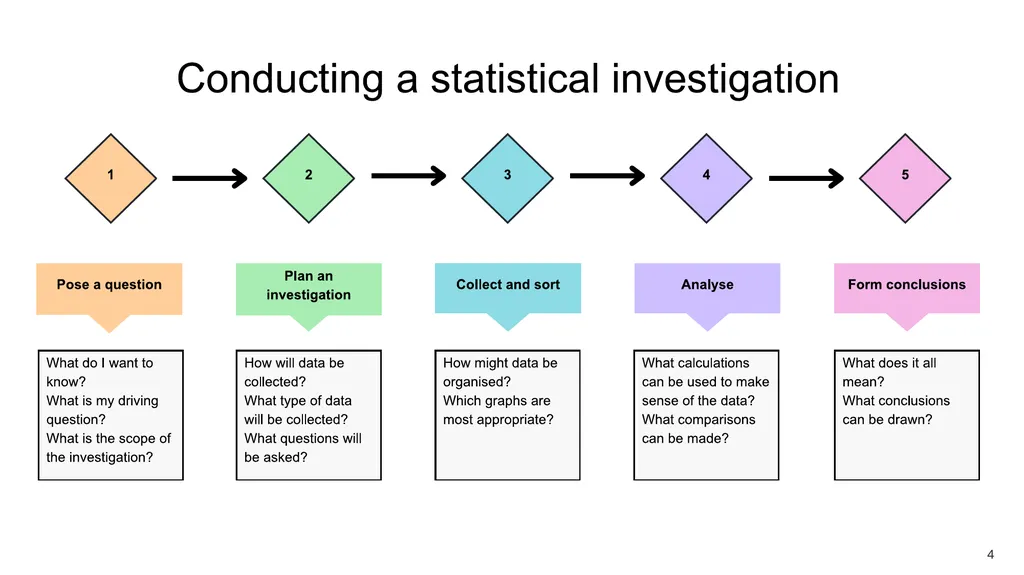
Statistical investigation process 4<br>
05
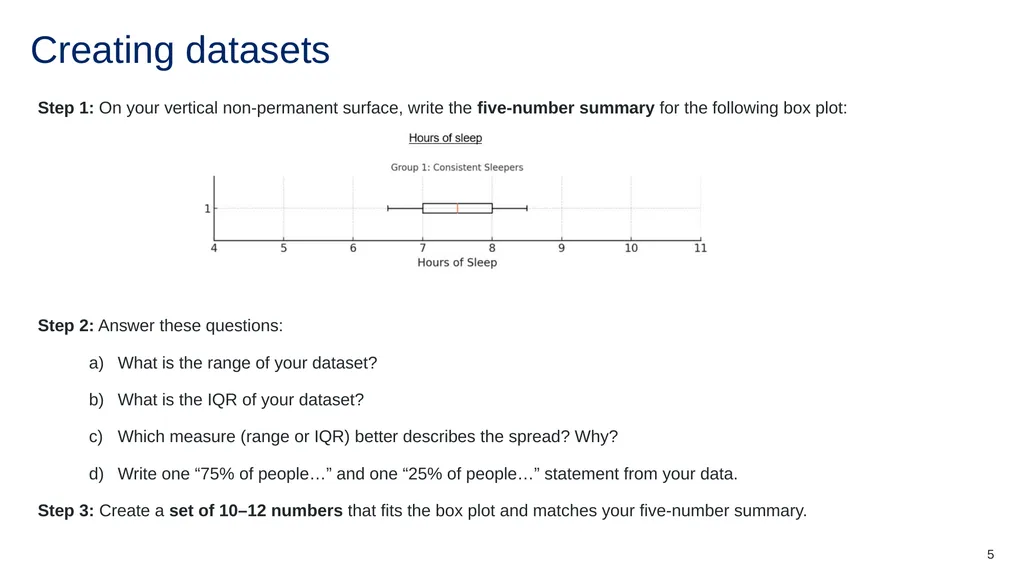
Creating datasets Step 1: On your vertical non-permanent surface, write the five-number summary for the following box plot: Step 2: Answer these questions:
What is the range of your dataset?
What is the IQR of your dataset?
Which measure (range or IQR) better describes the spread? Why?
Write one “75% of people…” and one “25% of people…” statement from your data.
Step 3: Create a set of 10–12 numbers that fits the box plot and matches your five-number summary. 5<br>
06
Connecting learning<br>
07
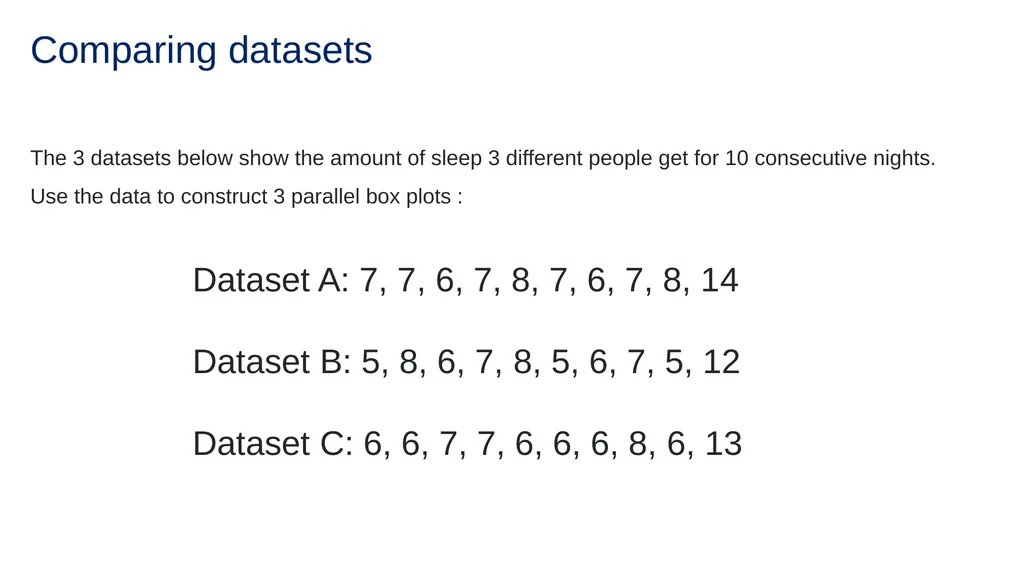
Comparing datasets The 3 datasets below show the amount of sleep 3 different people get for 10 consecutive nights. Use the data to construct 3 parallel box plots : Dataset A: 7, 7, 6, 7, 8, 7, 6, 7, 8, 14
Dataset B: 5, 8, 6, 7, 8, 5, 6, 7, 5, 12
Dataset C: 6, 6, 7, 7, 6, 6, 6, 8, 6, 13<br>