
JAR TESTING MADE EASY STATE WATER RESOURCES
MJ
Published · 61 slides · 0 views
1 / 1

Description
JAR TESTING MADE EASY STATE WATER RESOURCES CONTROL BOARD, DIVISION OF DRINKING WATER by Guy Schott, P.E. October 14, 2021 Presentation Overview Jar Testing Application, Research Assistance Jar TesterLab EquipmentMaterials Coagulants
Related Topics
Share
Embed code
Download this presentation From Below
"JAR TESTING MADE EASY STATE WATER RESOURCES" is the property of its rightful owner. Permission is granted to download and print the materials on this website for personal, non-commercial use only, and to display it on your personal computer provided you do not modify the materials and that you retain all copyright notices contained in the materials. By downloading content from our website, you accept the terms of this agreement.
Presentation Transcript
01
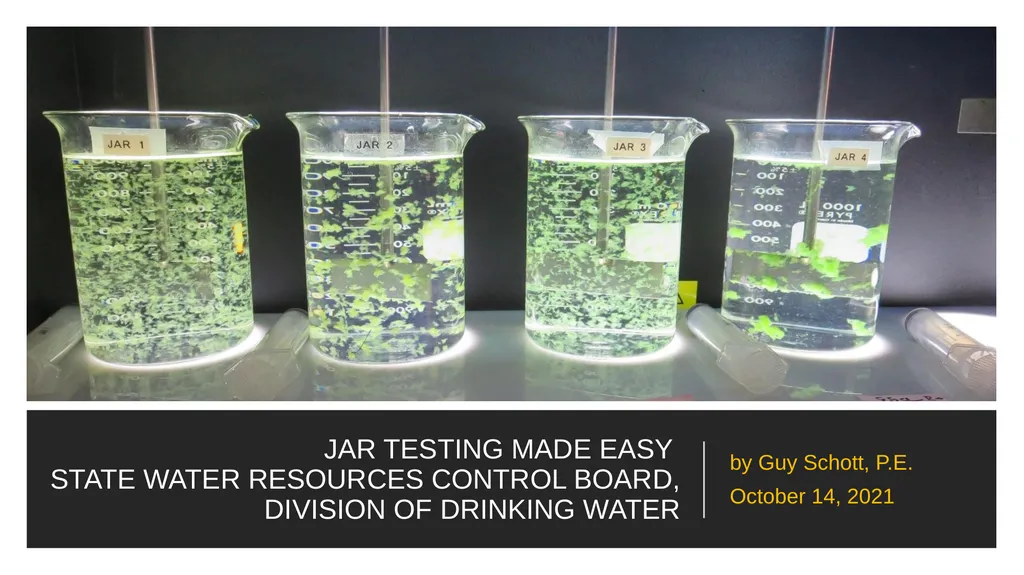
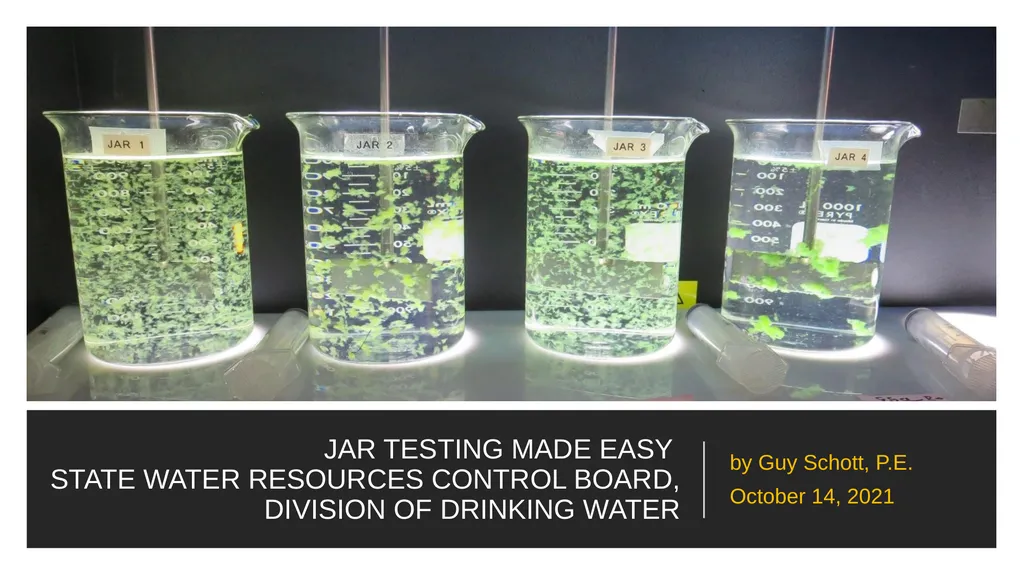
JAR TESTING MADE EASY
STATE WATER RESOURCES CONTROL BOARD, DIVISION OF DRINKING WATER by Guy Schott, P.E.
October 14, 2021<br>
October 14, 2021<br>
02
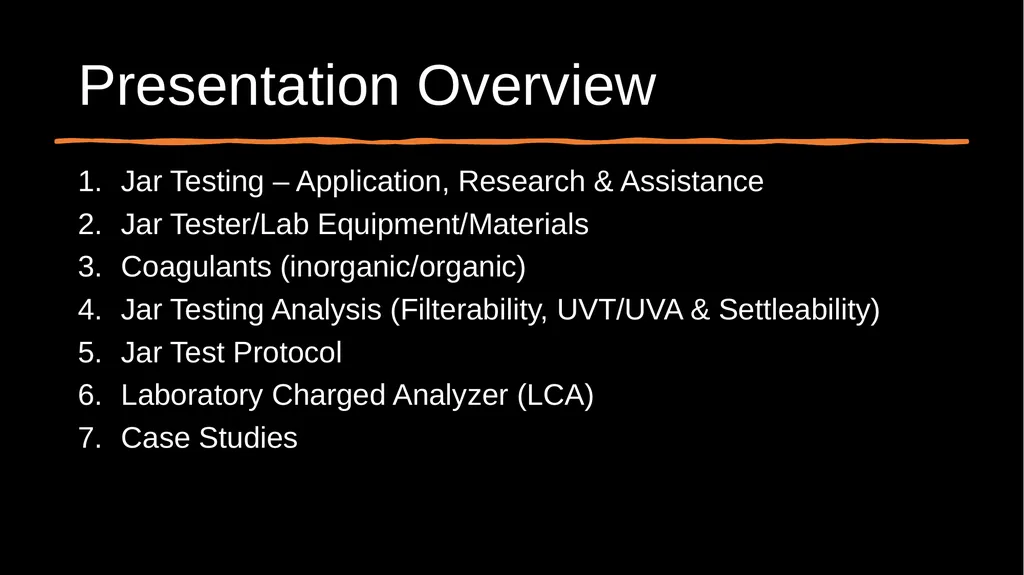
Presentation Overview Jar Testing – Application, Research & Assistance
Jar Tester/Lab Equipment/Materials
Coagulants (inorganic/organic)
Jar Testing Analysis (Filterability, UVT/UVA & Settleability)
Jar Test Protocol
Laboratory Charged Analyzer (LCA)
Case Studies<br>
Jar Tester/Lab Equipment/Materials
Coagulants (inorganic/organic)
Jar Testing Analysis (Filterability, UVT/UVA & Settleability)
Jar Test Protocol
Laboratory Charged Analyzer (LCA)
Case Studies<br>
03
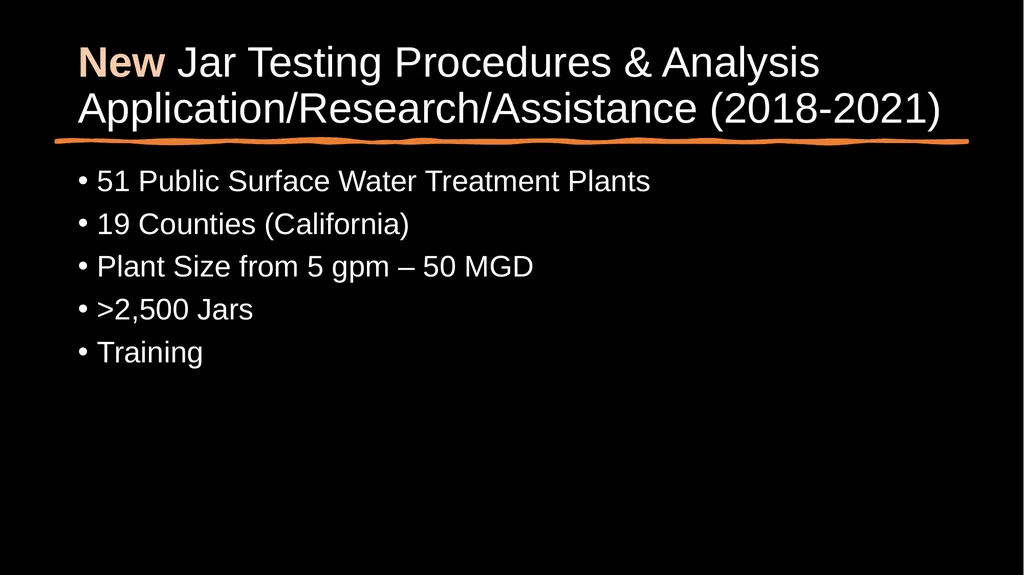
New Jar Testing Procedures & Analysis Application/Research/Assistance (2018-2021) 51 Public Surface Water Treatment Plants
19 Counties (California)
Plant Size from 5 gpm – 50 MGD
>2,500 Jars
Training<br>
19 Counties (California)
Plant Size from 5 gpm – 50 MGD
>2,500 Jars
Training<br>
04
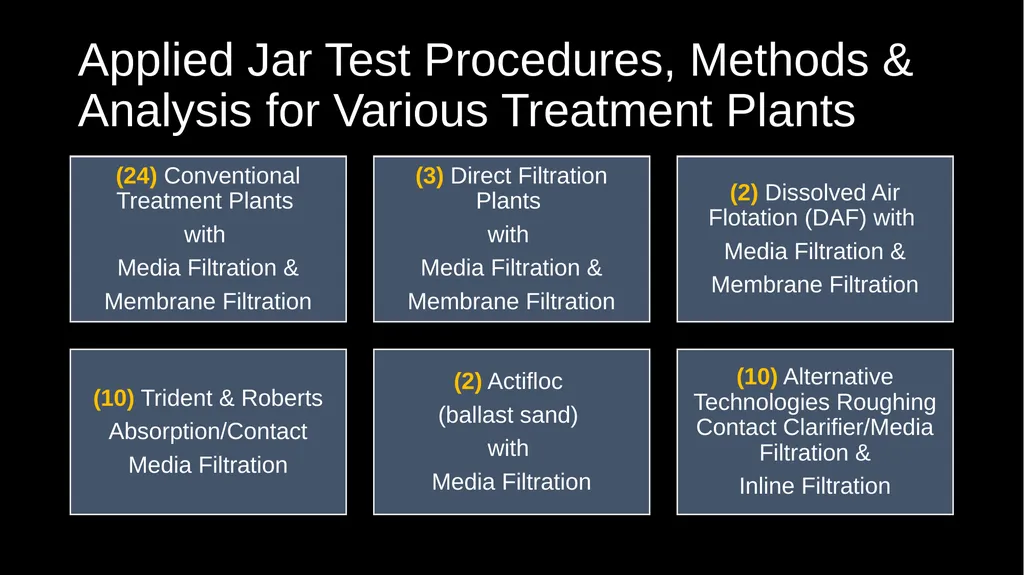
Applied Jar Test Procedures, Methods & Analysis for Various Treatment Plants<br>
05
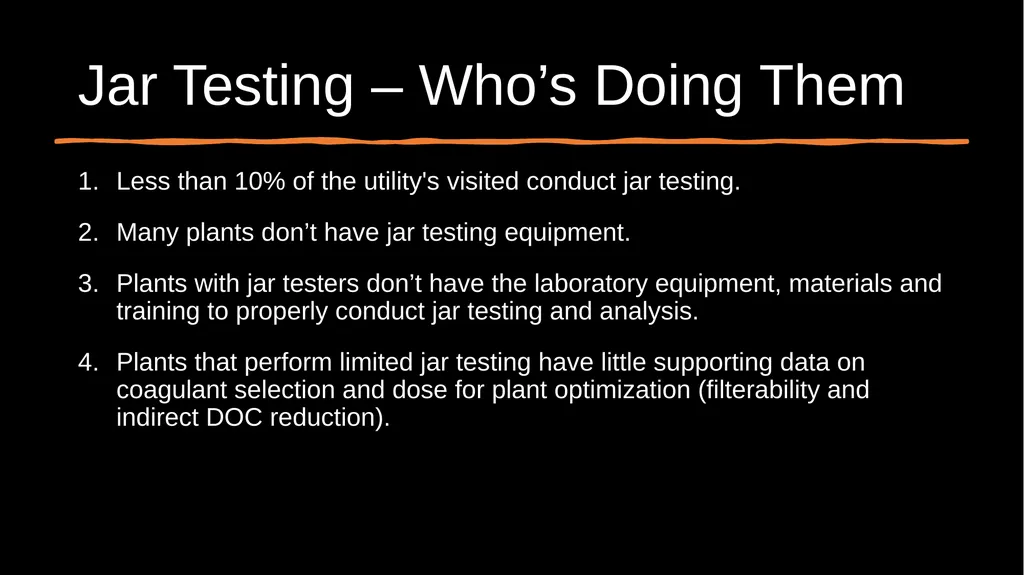
Jar Testing – Who’s Doing Them Less than 10% of the utility's visited conduct jar testing.
Many plants don’t have jar testing equipment.
Plants with jar testers don’t have the laboratory equipment, materials and training to properly conduct jar testing and analysis.
Plants that perform limited jar testing have little supporting data on coagulant selection and dose for plant optimization (filterability and indirect DOC reduction).<br>
Many plants don’t have jar testing equipment.
Plants with jar testers don’t have the laboratory equipment, materials and training to properly conduct jar testing and analysis.
Plants that perform limited jar testing have little supporting data on coagulant selection and dose for plant optimization (filterability and indirect DOC reduction).<br>
06
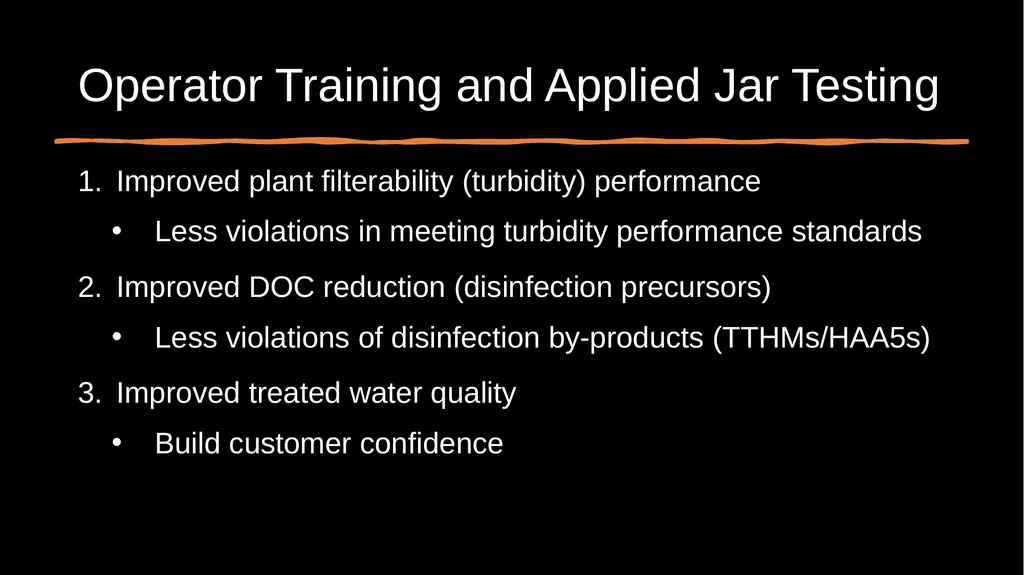
Operator Training and Applied Jar Testing Improved plant filterability (turbidity) performance
Less violations in meeting turbidity performance standards
Improved DOC reduction (disinfection precursors)
Less violations of disinfection by-products (TTHMs/HAA5s)
Improved treated water quality
Build customer confidence<br>
Less violations in meeting turbidity performance standards
Improved DOC reduction (disinfection precursors)
Less violations of disinfection by-products (TTHMs/HAA5s)
Improved treated water quality
Build customer confidence<br>
07
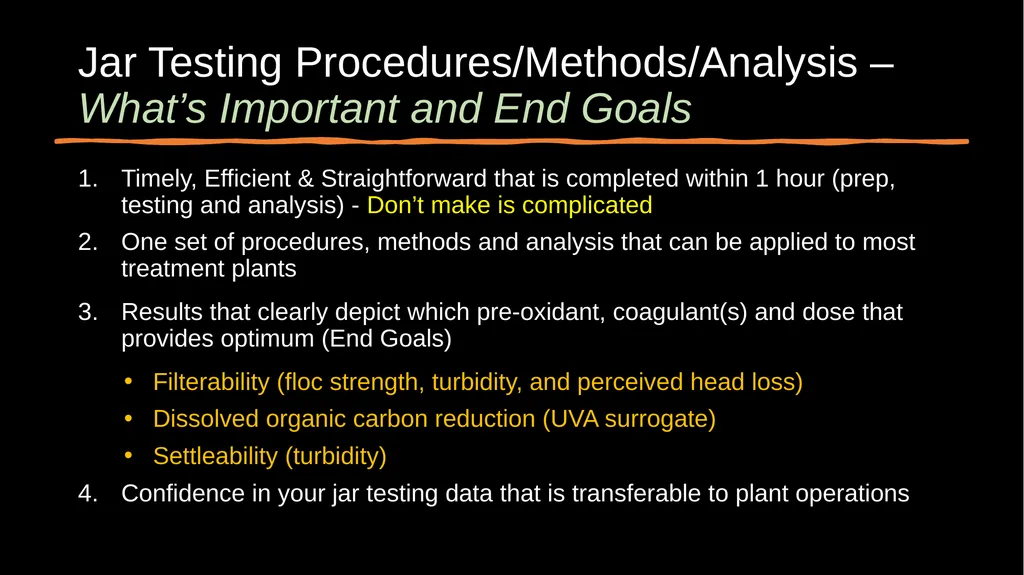
Jar Testing Procedures/Methods/Analysis – What’s Important and End Goals Timely, Efficient & Straightforward that is completed within 1 hour (prep, testing and analysis) - Don’t make is complicated
One set of procedures, methods and analysis that can be applied to most treatment plants
Results that clearly depict which pre-oxidant, coagulant(s) and dose that provides optimum (End Goals)
Filterability (floc strength, turbidity, and perceived head loss)
Dissolved organic carbon reduction (UVA surrogate)
Settleability (turbidity)
Confidence in your jar testing data that is transferable to plant operations<br>
One set of procedures, methods and analysis that can be applied to most treatment plants
Results that clearly depict which pre-oxidant, coagulant(s) and dose that provides optimum (End Goals)
Filterability (floc strength, turbidity, and perceived head loss)
Dissolved organic carbon reduction (UVA surrogate)
Settleability (turbidity)
Confidence in your jar testing data that is transferable to plant operations<br>
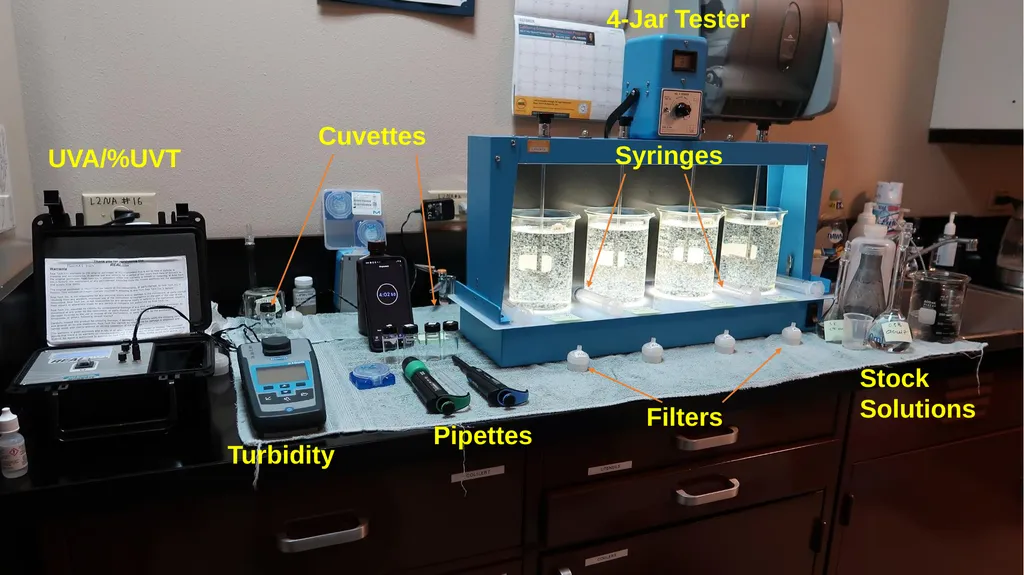
08
Lab UVA/%UVT Turbidity Cuvettes Stock
Solutions Pipettes Filters Syringes 4-Jar Tester<br>
Solutions Pipettes Filters Syringes 4-Jar Tester<br>
09
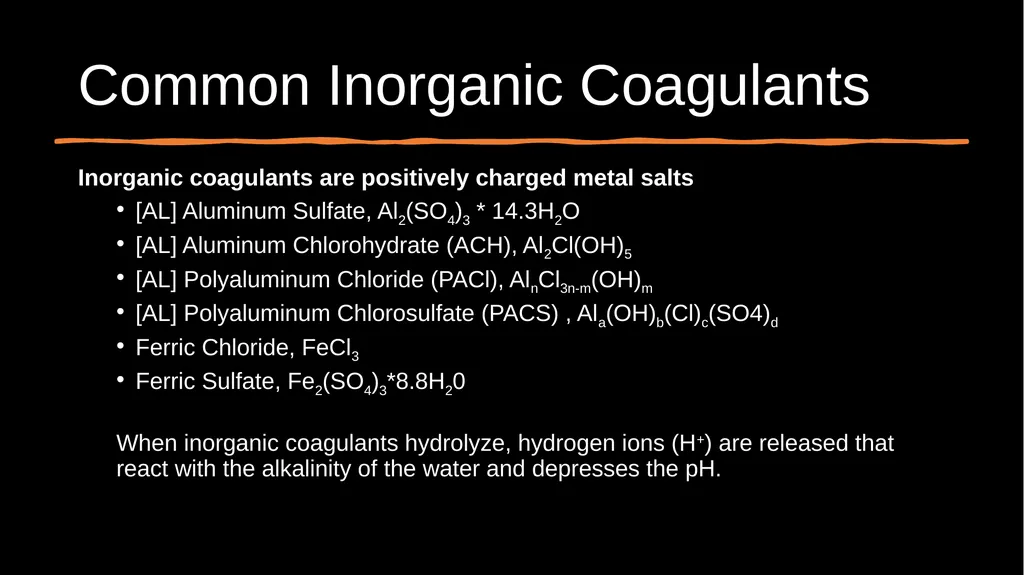
Common Inorganic Coagulants Inorganic coagulants are positively charged metal salts
[AL] Aluminum Sulfate, Al2(SO4)3 * 14.3H2O
[AL] Aluminum Chlorohydrate (ACH), Al2Cl(OH)5
[AL] Polyaluminum Chloride (PACl), AlnCl3n-m(OH)m
[AL] Polyaluminum Chlorosulfate (PACS) , Ala(OH)b(Cl)c(SO4)d
Ferric Chloride, FeCl3
Ferric Sulfate, Fe2(SO4)3*8.8H20
When inorganic coagulants hydrolyze, hydrogen ions (H+) are released that react with the alkalinity of the water and depresses the pH.<br>
[AL] Aluminum Sulfate, Al2(SO4)3 * 14.3H2O
[AL] Aluminum Chlorohydrate (ACH), Al2Cl(OH)5
[AL] Polyaluminum Chloride (PACl), AlnCl3n-m(OH)m
[AL] Polyaluminum Chlorosulfate (PACS) , Ala(OH)b(Cl)c(SO4)d
Ferric Chloride, FeCl3
Ferric Sulfate, Fe2(SO4)3*8.8H20
When inorganic coagulants hydrolyze, hydrogen ions (H+) are released that react with the alkalinity of the water and depresses the pH.<br>
10
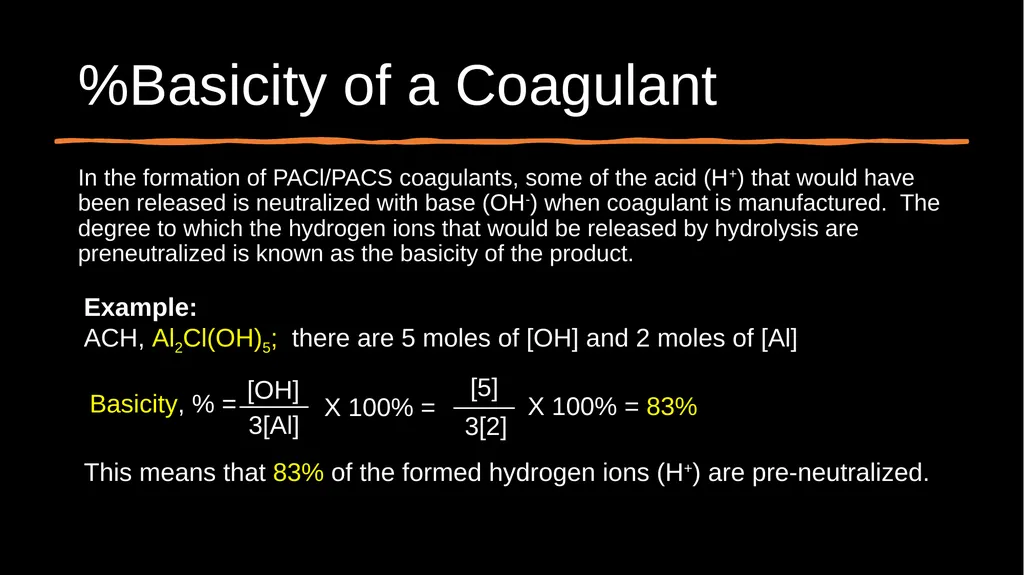
%Basicity of a Coagulant In the formation of PACl/PACS coagulants, some of the acid (H+) that would have been released is neutralized with base (OH-) when coagulant is manufactured. The degree to which the hydrogen ions that would be released by hydrolysis are preneutralized is known as the basicity of the product. This means that 83% of the formed hydrogen ions (H+) are pre-neutralized.<br>
11
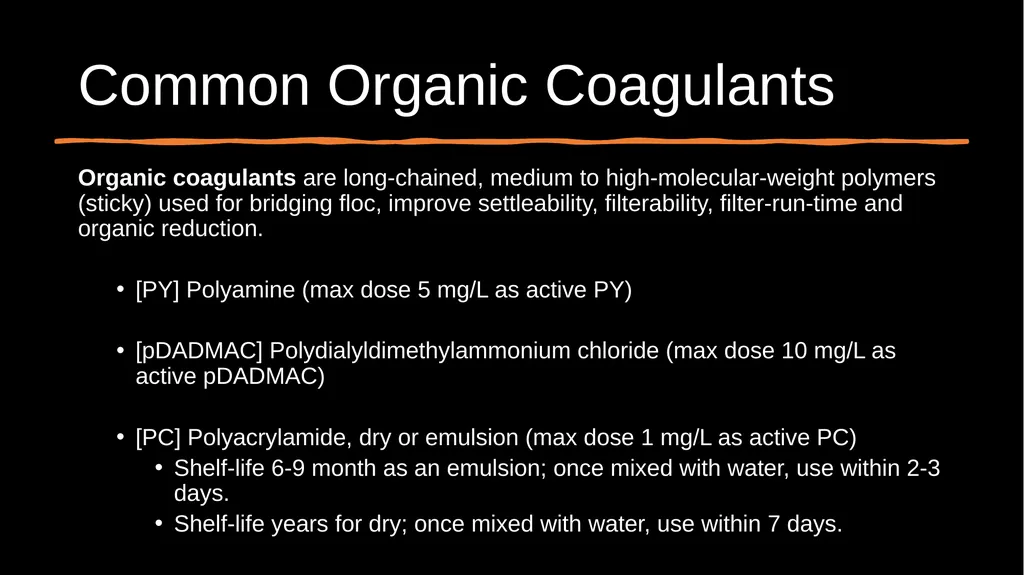
Common Organic Coagulants Organic coagulants are long-chained, medium to high-molecular-weight polymers (sticky) used for bridging floc, improve settleability, filterability, filter-run-time and organic reduction.
[PY] Polyamine (max dose 5 mg/L as active PY)
[pDADMAC] Polydialyldimethylammonium chloride (max dose 10 mg/L as active pDADMAC)
[PC] Polyacrylamide, dry or emulsion (max dose 1 mg/L as active PC)
Shelf-life 6-9 month as an emulsion; once mixed with water, use within 2-3 days.
Shelf-life years for dry; once mixed with water, use within 7 days.<br>
[PY] Polyamine (max dose 5 mg/L as active PY)
[pDADMAC] Polydialyldimethylammonium chloride (max dose 10 mg/L as active pDADMAC)
[PC] Polyacrylamide, dry or emulsion (max dose 1 mg/L as active PC)
Shelf-life 6-9 month as an emulsion; once mixed with water, use within 2-3 days.
Shelf-life years for dry; once mixed with water, use within 7 days.<br>
12
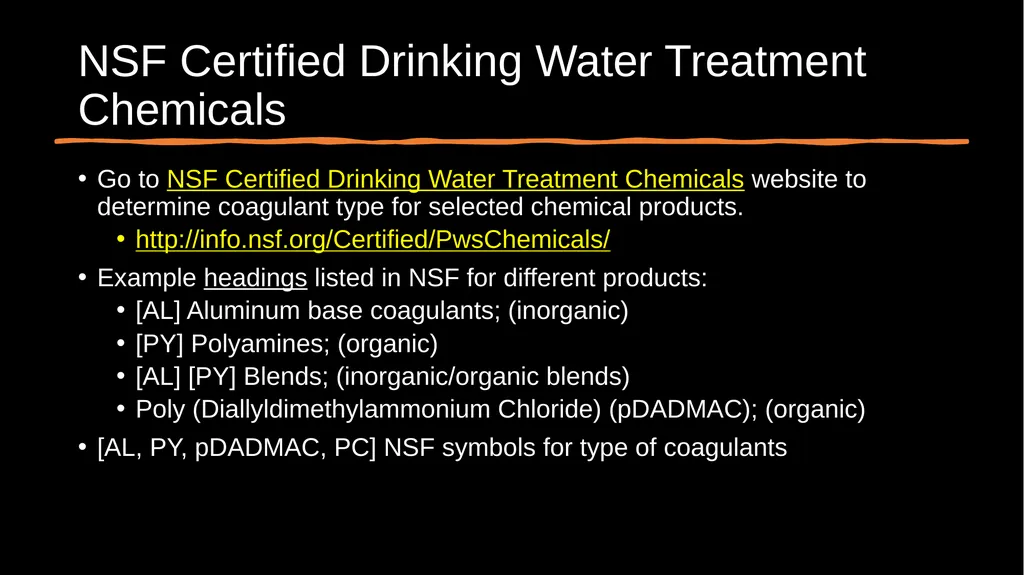
NSF Certified Drinking Water Treatment Chemicals Go to NSF Certified Drinking Water Treatment Chemicals website to determine coagulant type for selected chemical products.
http://info.nsf.org/Certified/PwsChemicals/
Example headings listed in NSF for different products:
[AL] Aluminum base coagulants; (inorganic)
[PY] Polyamines; (organic)
[AL] [PY] Blends; (inorganic/organic blends)
Poly (Diallyldimethylammonium Chloride) (pDADMAC); (organic)
[AL, PY, pDADMAC, PC] NSF symbols for type of coagulants<br>
http://info.nsf.org/Certified/PwsChemicals/
Example headings listed in NSF for different products:
[AL] Aluminum base coagulants; (inorganic)
[PY] Polyamines; (organic)
[AL] [PY] Blends; (inorganic/organic blends)
Poly (Diallyldimethylammonium Chloride) (pDADMAC); (organic)
[AL, PY, pDADMAC, PC] NSF symbols for type of coagulants<br>
13
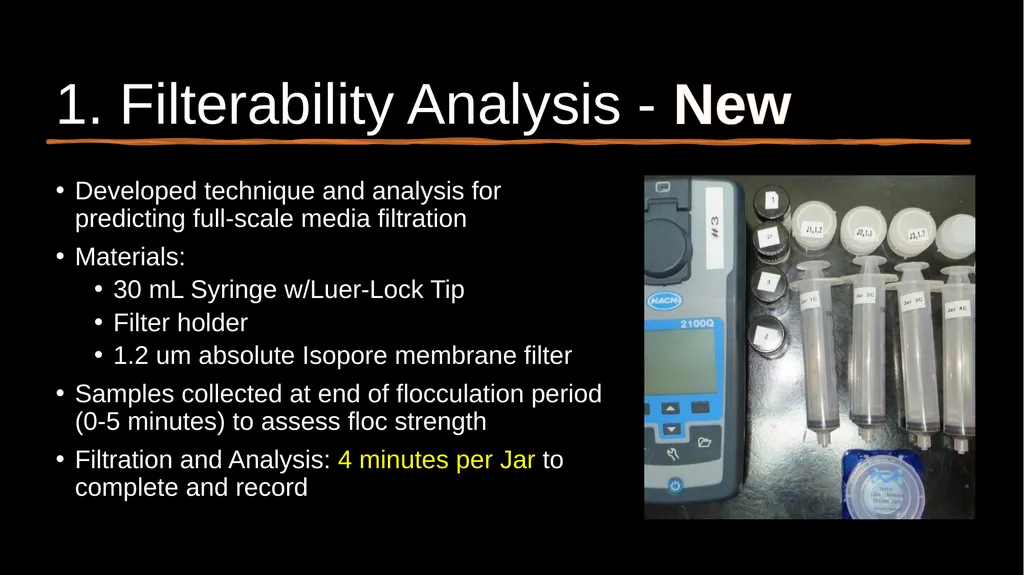
1. Filterability Analysis - New Developed technique and analysis for predicting full-scale media filtration
Materials:
30 mL Syringe w/Luer-Lock Tip
Filter holder
1.2 um absolute Isopore membrane filter
Samples collected at end of flocculation period (0-5 minutes) to assess floc strength
Filtration and Analysis: 4 minutes per Jar to complete and record<br>
Materials:
30 mL Syringe w/Luer-Lock Tip
Filter holder
1.2 um absolute Isopore membrane filter
Samples collected at end of flocculation period (0-5 minutes) to assess floc strength
Filtration and Analysis: 4 minutes per Jar to complete and record<br>
14
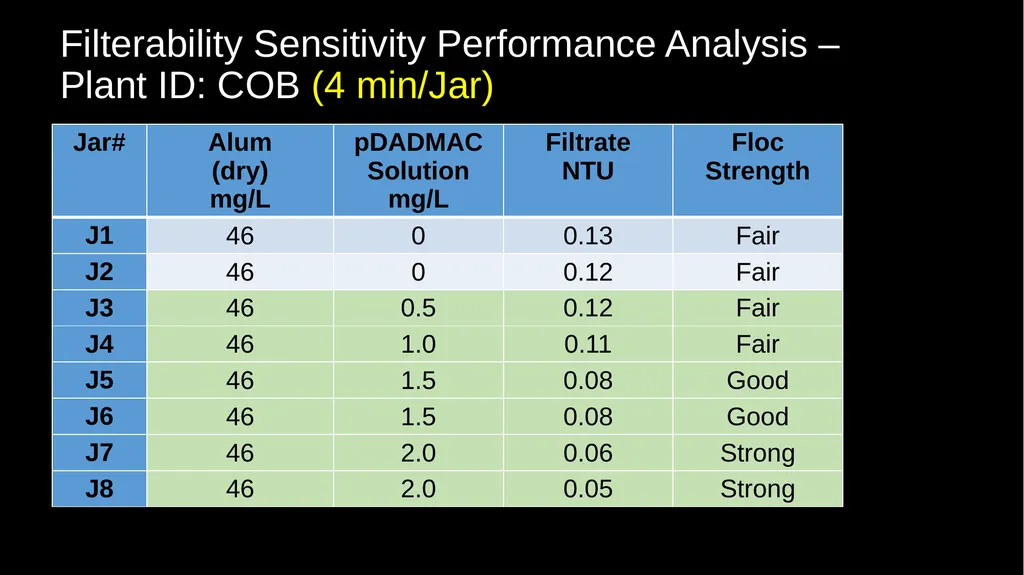
Filterability Sensitivity Performance Analysis –
Plant ID: COB (4 min/Jar)<br>
15
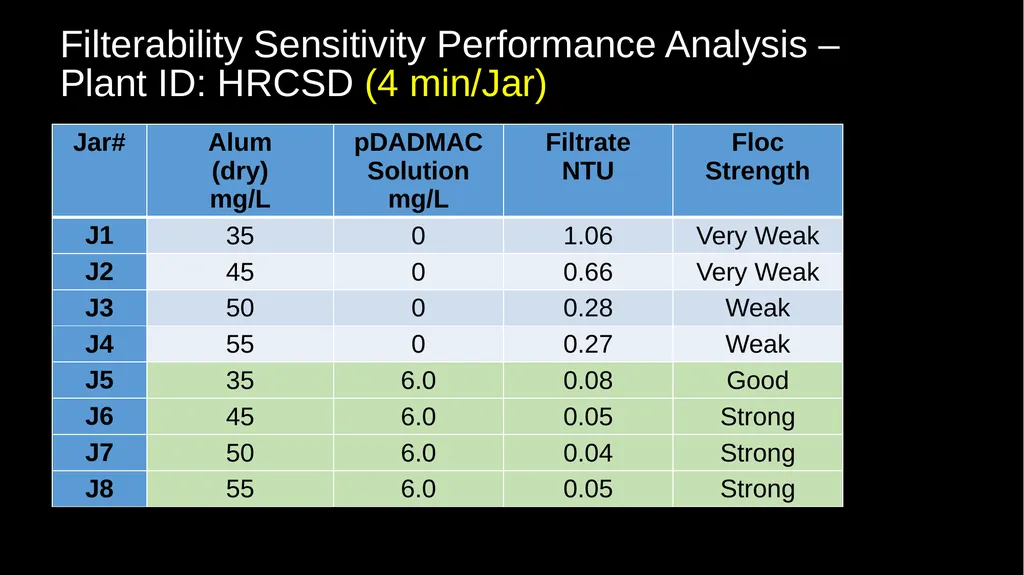
Filterability Sensitivity Performance Analysis –
Plant ID: HRCSD (4 min/Jar)<br>
16
2. UV-Absorption Analysis Surrogate for predicting indirect DOC reduction
Compares different jar testing coagulants and doses for best indirect DOC (UVA) reduction
Systems with DPB issues, UVA measurements are critical for determining optimum coagulant and dose
UVA measurements:
Source (0.4 um Isopore filter)
Filtrate water from each tested jar (1.2 um Isopore filter)
UVA Analysis: 1 minute per Jar to complete and record<br>
Compares different jar testing coagulants and doses for best indirect DOC (UVA) reduction
Systems with DPB issues, UVA measurements are critical for determining optimum coagulant and dose
UVA measurements:
Source (0.4 um Isopore filter)
Filtrate water from each tested jar (1.2 um Isopore filter)
UVA Analysis: 1 minute per Jar to complete and record<br>
17
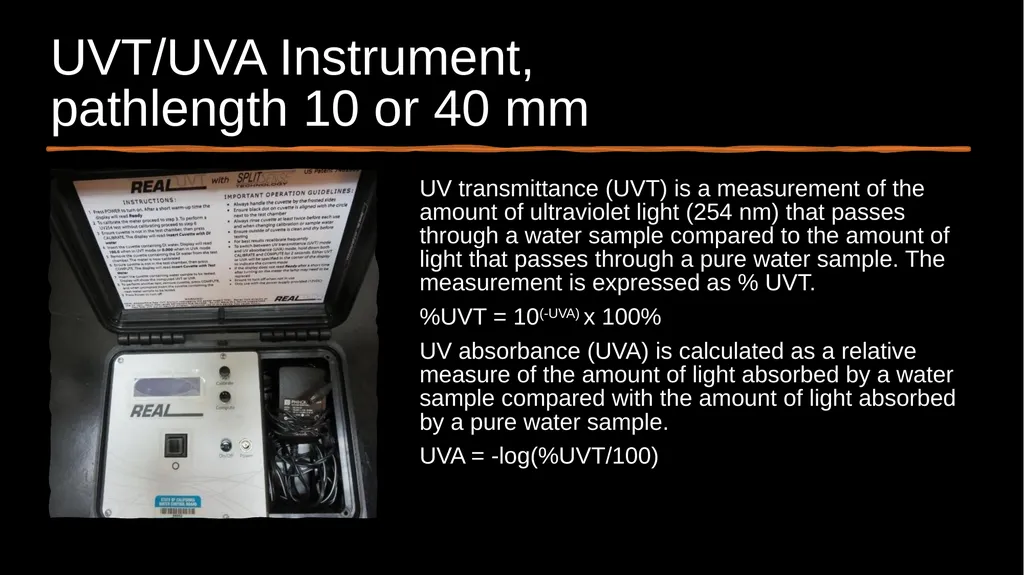
UVT/UVA Instrument,
pathlength 10 or 40 mm UV transmittance (UVT) is a measurement of the amount of ultraviolet light (254 nm) that passes through a water sample compared to the amount of light that passes through a pure water sample. The measurement is expressed as % UVT.
%UVT = 10(-UVA) x 100%
UV absorbance (UVA) is calculated as a relative measure of the amount of light absorbed by a water sample compared with the amount of light absorbed by a pure water sample.
UVA = -log(%UVT/100)<br>
%UVT = 10(-UVA) x 100%
UV absorbance (UVA) is calculated as a relative measure of the amount of light absorbed by a water sample compared with the amount of light absorbed by a pure water sample.
UVA = -log(%UVT/100)<br>
18
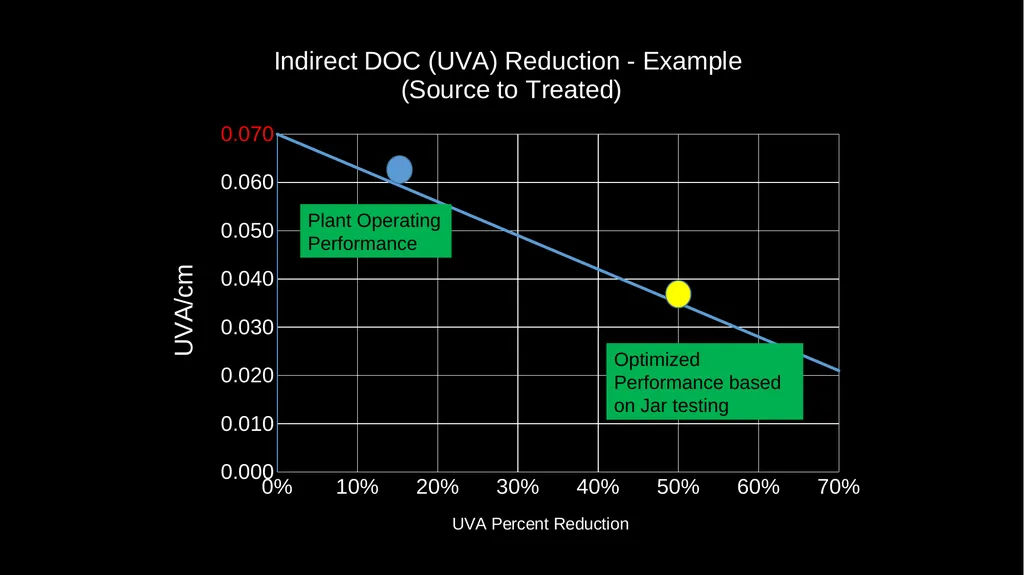
Chart – Indirect DOC Reduction Plant Operating Performance Optimized
Performance based on Jar testing<br>
Performance based on Jar testing<br>
19
3. Settleability Analysis Analysis conducted for plants with settling
Relative performance measurement between jars based on coagulant type, dose and flocculation duration
Samples collected 25 minutes from the end of the flocculation period
Settleability Analysis: 1 minutes per Jar to sample, complete and record<br>
Relative performance measurement between jars based on coagulant type, dose and flocculation duration
Samples collected 25 minutes from the end of the flocculation period
Settleability Analysis: 1 minutes per Jar to sample, complete and record<br>
20
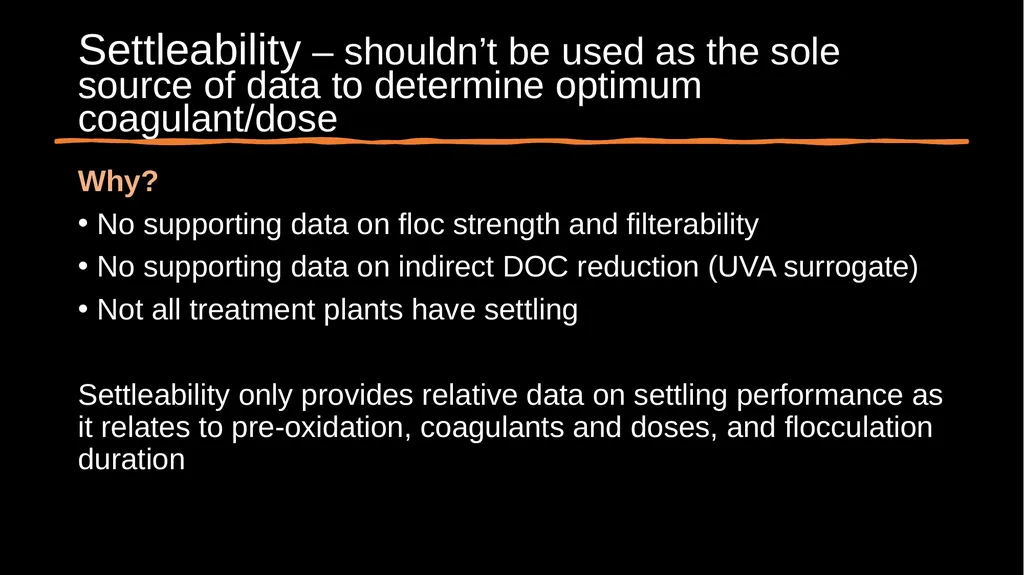
Settleability – shouldn’t be used as the sole source of data to determine optimum coagulant/dose Why?
No supporting data on floc strength and filterability
No supporting data on indirect DOC reduction (UVA surrogate)
Not all treatment plants have settling
Settleability only provides relative data on settling performance as it relates to pre-oxidation, coagulants and doses, and flocculation duration<br>
No supporting data on floc strength and filterability
No supporting data on indirect DOC reduction (UVA surrogate)
Not all treatment plants have settling
Settleability only provides relative data on settling performance as it relates to pre-oxidation, coagulants and doses, and flocculation duration<br>
21
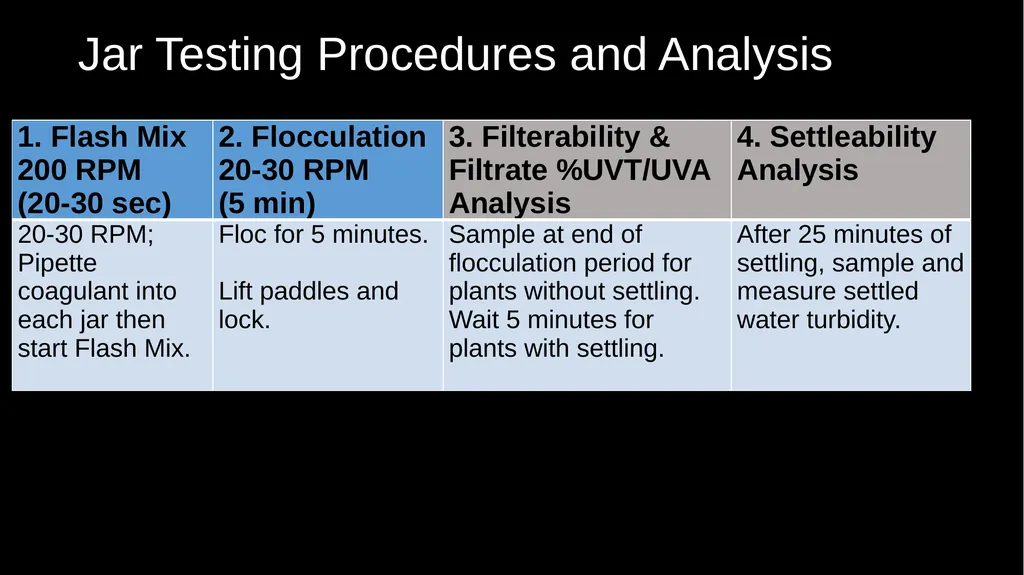
Jar Testing Procedures and Analysis<br>
22
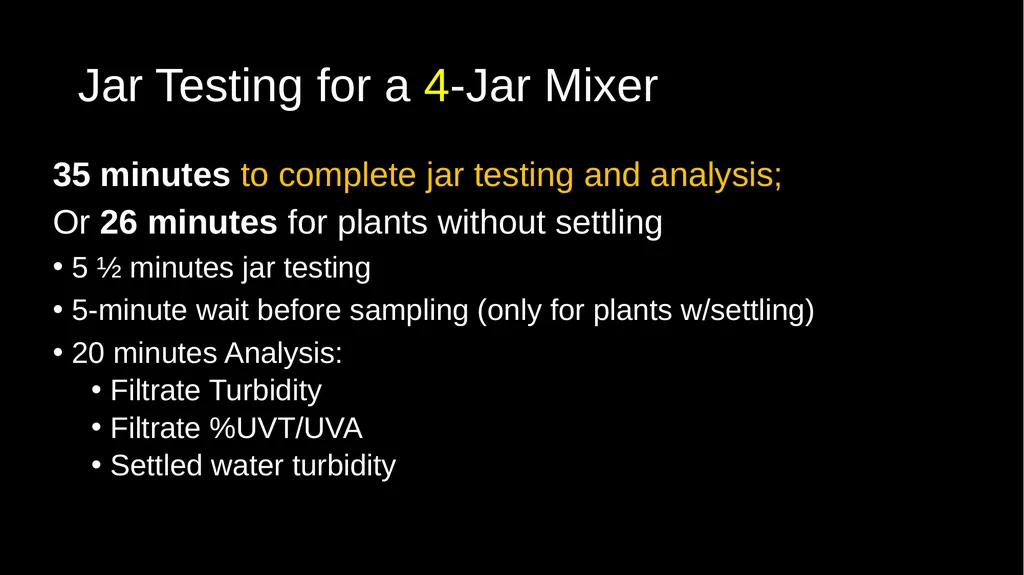
Jar Testing for a 4-Jar Mixer 35 minutes to complete jar testing and analysis;
Or 26 minutes for plants without settling
5 ½ minutes jar testing
5-minute wait before sampling (only for plants w/settling)
20 minutes Analysis:
Filtrate Turbidity
Filtrate %UVT/UVA
Settled water turbidity<br>
Or 26 minutes for plants without settling
5 ½ minutes jar testing
5-minute wait before sampling (only for plants w/settling)
20 minutes Analysis:
Filtrate Turbidity
Filtrate %UVT/UVA
Settled water turbidity<br>
23
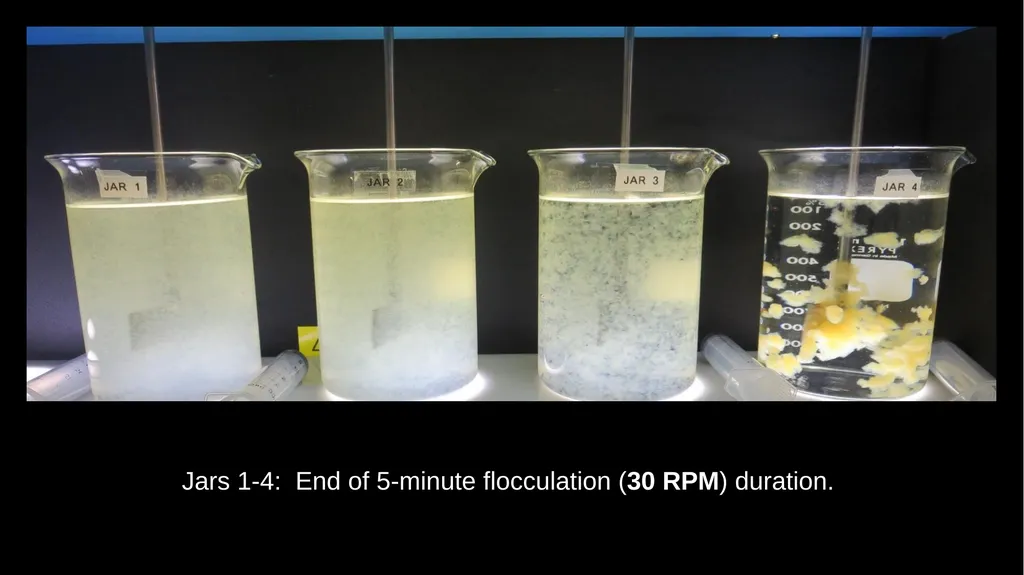
Jars 1-4: End of 5-minute flocculation (30 RPM) duration.<br>
24
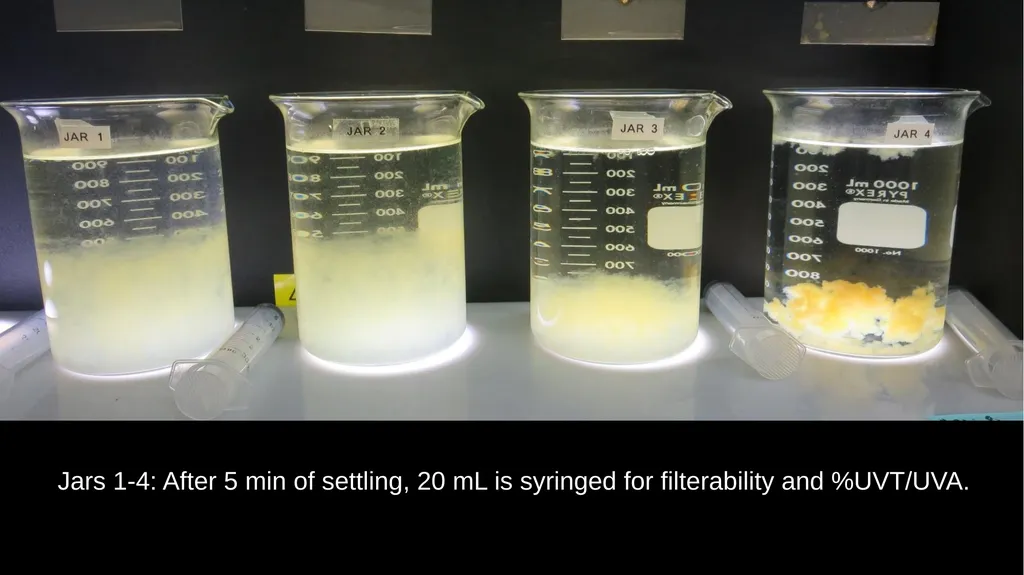
Jars 1-4: After 5 min of settling, 20 mL is syringed for filterability and %UVT/UVA.<br>
25
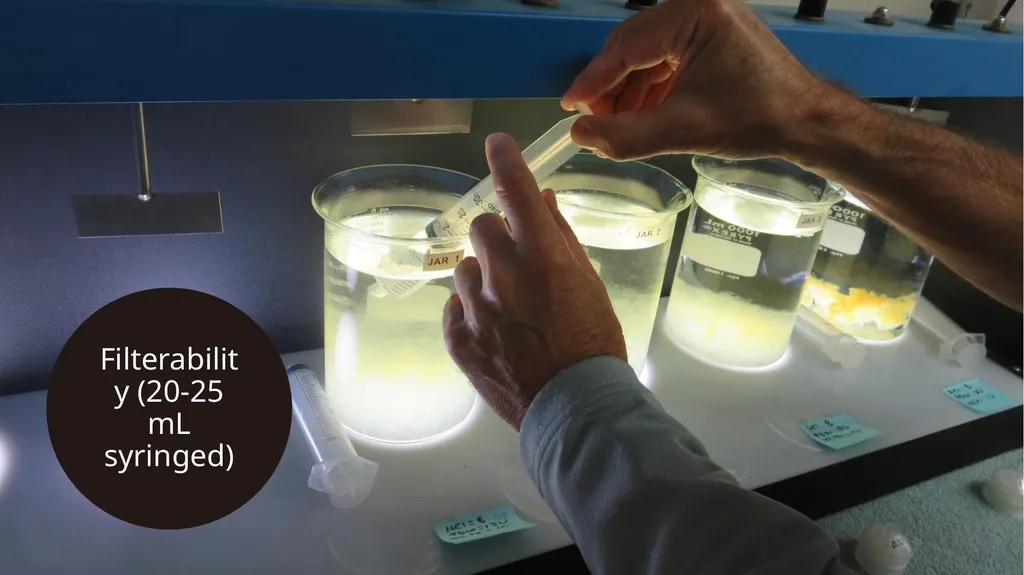
Filterability (20-25 mL syringed) Syringing<br>
26
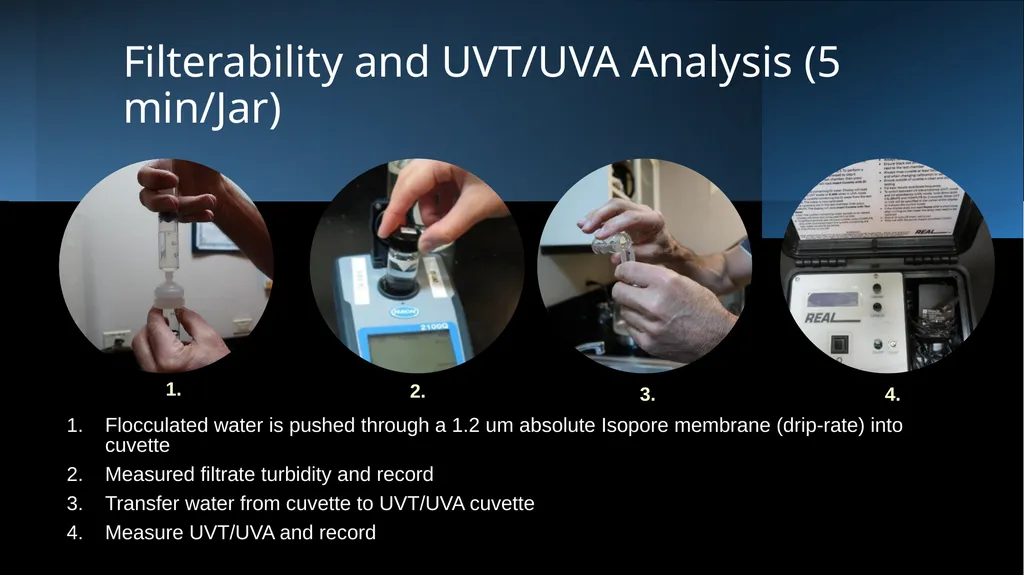
Filterability and UVT/UVA Analysis (5 min/Jar) Flocculated water is pushed through a 1.2 um absolute Isopore membrane (drip-rate) into cuvette
Measured filtrate turbidity and record
Transfer water from cuvette to UVT/UVA cuvette
Measure UVT/UVA and record 1. 2. 3. 4.<br>
Measured filtrate turbidity and record
Transfer water from cuvette to UVT/UVA cuvette
Measure UVT/UVA and record 1. 2. 3. 4.<br>
27
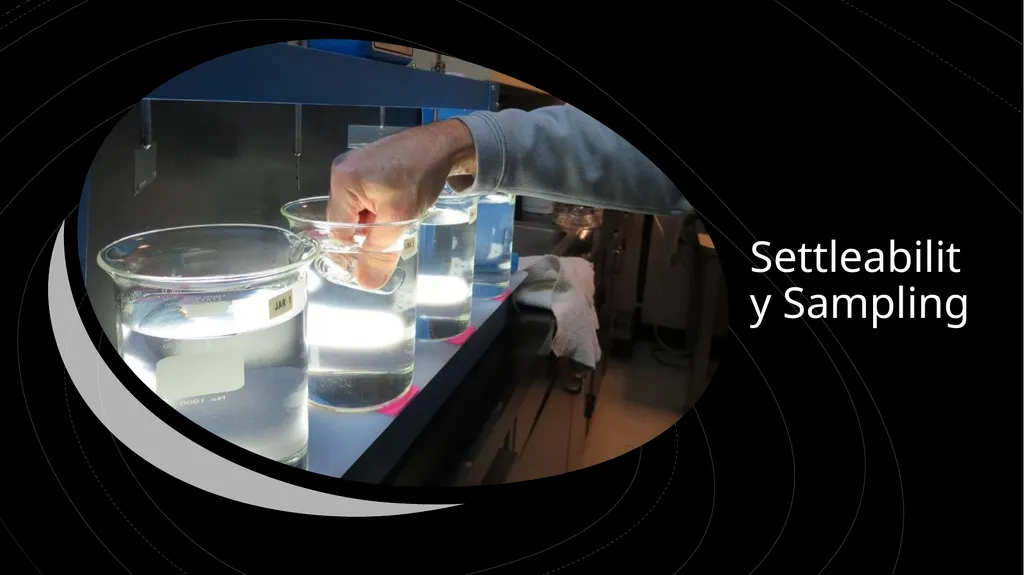
Settleability Sampling<br>
28
Jars 5-8: After 25-minutes of settling, settled water turbidity is taken. 8 mg/L HCl
120 mg/L ACH Product
15 mg/L ACH/PY
Filtrate 0.29 NTU
UVT: 85.8%
UVA: 0.066/cm
UVA Reduction: 57.0%
Settled: 1.3 NTU 8 mg/L HCl
130 mg/L ACH Product
15 mg/L ACH/PY
Filtrate 0.19 NTU
UVT: 86.0%
UVA: 0.065/cm
UVA Reduction: 57.6%
Settled: 1.3 NTU 8 mg/L HCl
140 mg/L ACH Product
15 mg/L ACH/PY
Filtrate 0.08 NTU
UVT: 86.8%
UVA: 0.062/cm
UVA Reduction: 60.0%
Settled: 1.1 NTU 8 mg/L HCl
120 mg/L ACH Product
10 mg/L pDADMAC
Filtrate 0.06 NTU
UVT: 86.0%
UVA: 0.066/cm
UVA Reduction: 57.5%
Settled: 0.47NTU<br>
120 mg/L ACH Product
15 mg/L ACH/PY
Filtrate 0.29 NTU
UVT: 85.8%
UVA: 0.066/cm
UVA Reduction: 57.0%
Settled: 1.3 NTU 8 mg/L HCl
130 mg/L ACH Product
15 mg/L ACH/PY
Filtrate 0.19 NTU
UVT: 86.0%
UVA: 0.065/cm
UVA Reduction: 57.6%
Settled: 1.3 NTU 8 mg/L HCl
140 mg/L ACH Product
15 mg/L ACH/PY
Filtrate 0.08 NTU
UVT: 86.8%
UVA: 0.062/cm
UVA Reduction: 60.0%
Settled: 1.1 NTU 8 mg/L HCl
120 mg/L ACH Product
10 mg/L pDADMAC
Filtrate 0.06 NTU
UVT: 86.0%
UVA: 0.066/cm
UVA Reduction: 57.5%
Settled: 0.47NTU<br>
29
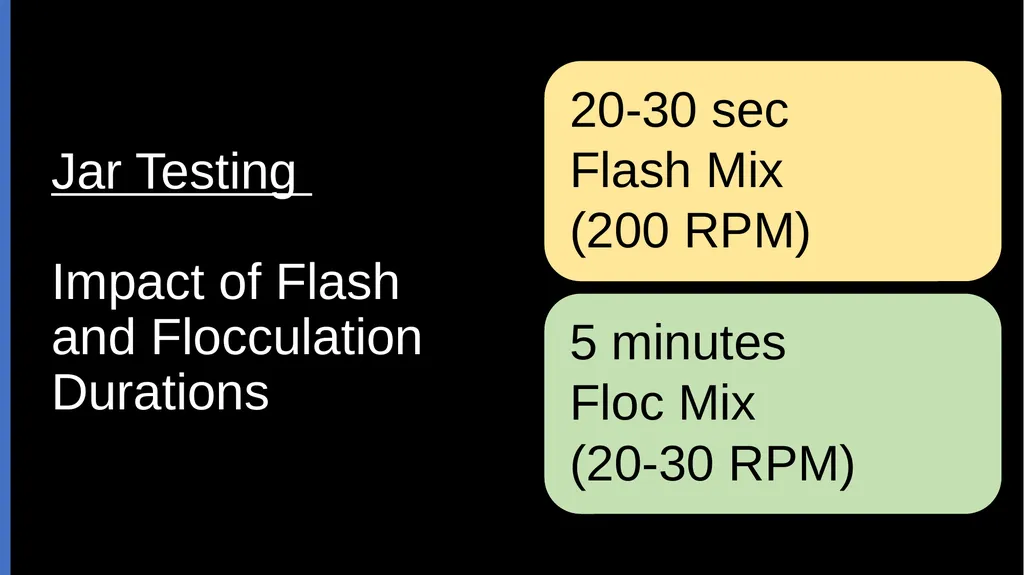
Jar Testing
Impact of Flash
and Flocculation Durations<br>
30
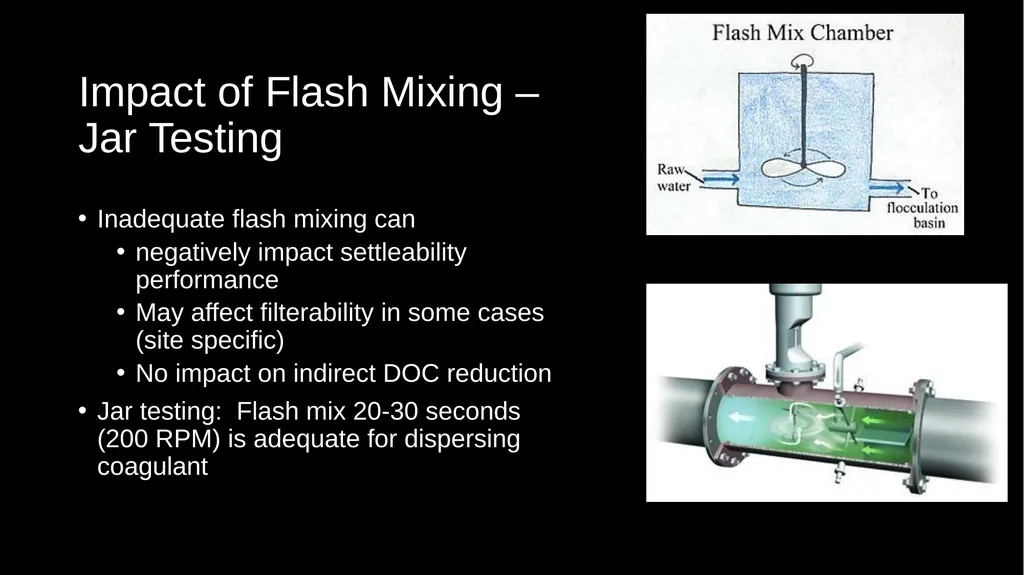
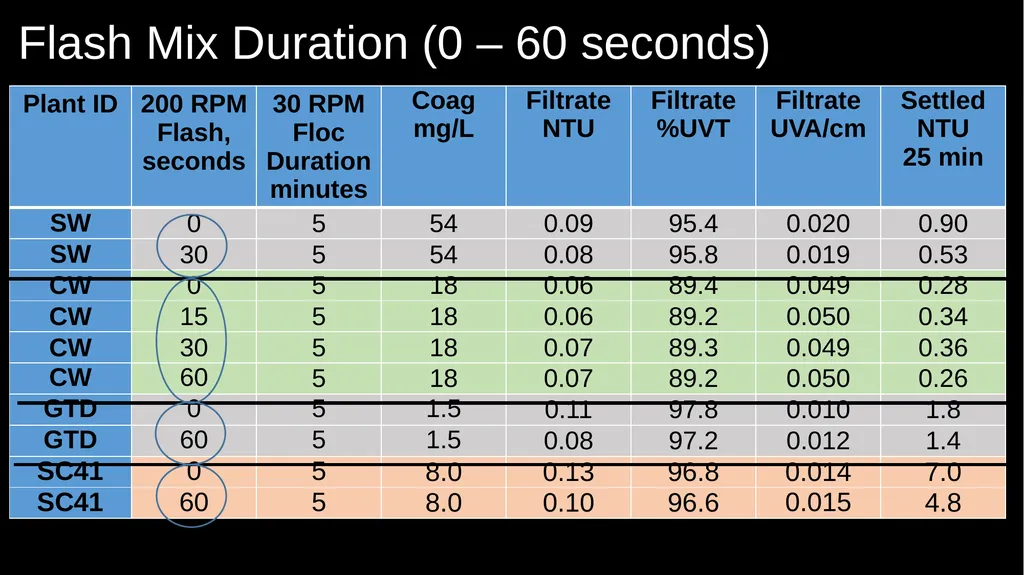
Impact of Flash Mixing – Jar Testing Inadequate flash mixing can
negatively impact settleability performance
May affect filterability in some cases (site specific)
No impact on indirect DOC reduction
Jar testing: Flash mix 20-30 seconds (200 RPM) is adequate for dispersing coagulant<br>
negatively impact settleability performance
May affect filterability in some cases (site specific)
No impact on indirect DOC reduction
Jar testing: Flash mix 20-30 seconds (200 RPM) is adequate for dispersing coagulant<br>
31
Flash Mix Duration (0 – 60 seconds)<br>
32
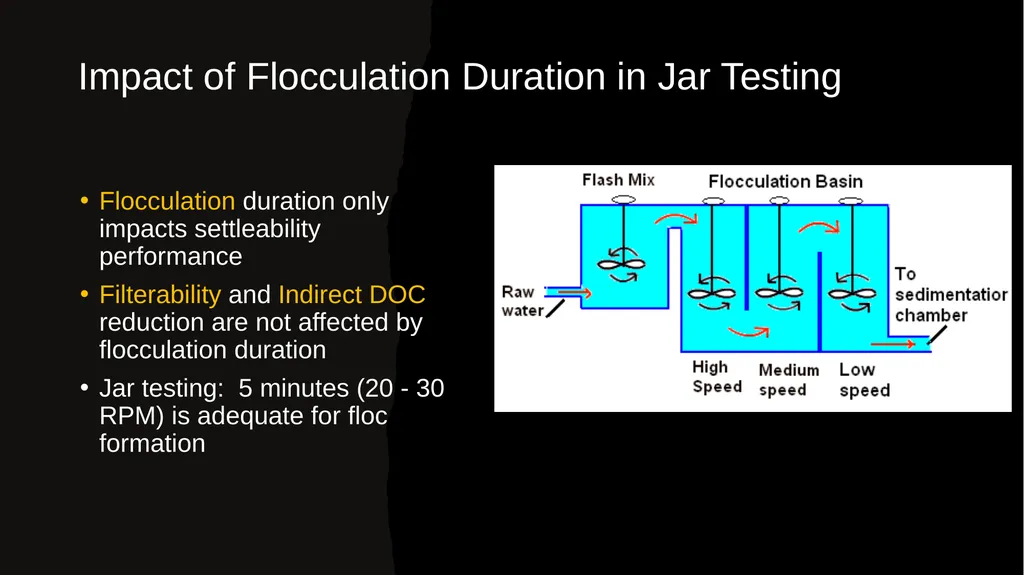
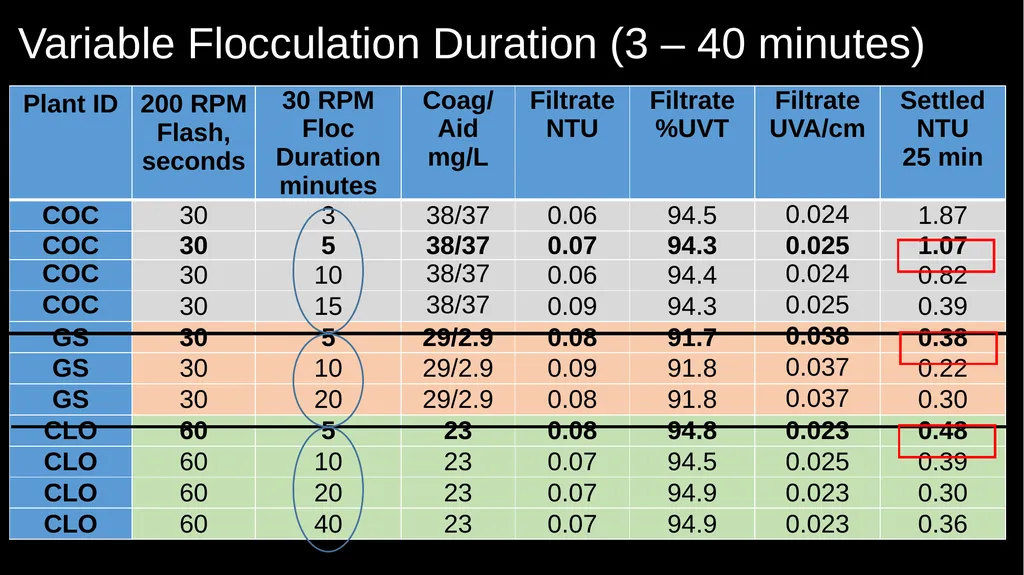
Impact of Flocculation Duration in Jar Testing Flocculation duration only impacts settleability performance
Filterability and Indirect DOC reduction are not affected by flocculation duration
Jar testing: 5 minutes (20 - 30 RPM) is adequate for floc formation<br>
Filterability and Indirect DOC reduction are not affected by flocculation duration
Jar testing: 5 minutes (20 - 30 RPM) is adequate for floc formation<br>
33
Variable Flocculation Duration (3 – 40 minutes)<br>
34
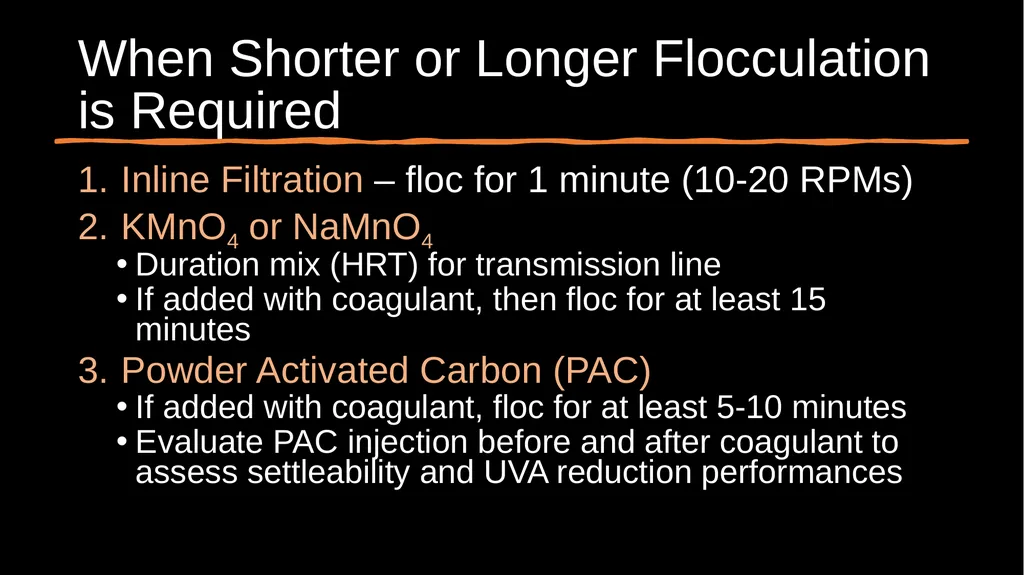
When Shorter or Longer Flocculation is Required Inline Filtration – floc for 1 minute (10-20 RPMs)
KMnO4 or NaMnO4
Duration mix (HRT) for transmission line
If added with coagulant, then floc for at least 15 minutes
Powder Activated Carbon (PAC)
If added with coagulant, floc for at least 5-10 minutes
Evaluate PAC injection before and after coagulant to assess settleability and UVA reduction performances<br>
KMnO4 or NaMnO4
Duration mix (HRT) for transmission line
If added with coagulant, then floc for at least 15 minutes
Powder Activated Carbon (PAC)
If added with coagulant, floc for at least 5-10 minutes
Evaluate PAC injection before and after coagulant to assess settleability and UVA reduction performances<br>
35
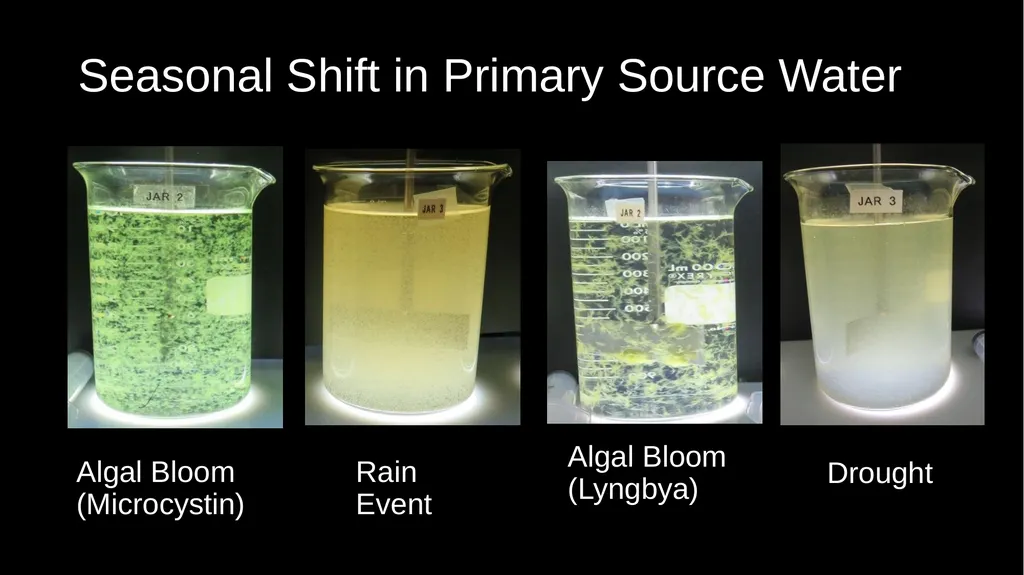
Seasonal Shift in Primary Source Water Drought Algal Bloom
(Microcystin) Rain
Event Algal Bloom (Lyngbya)<br>
(Microcystin) Rain
Event Algal Bloom (Lyngbya)<br>
36
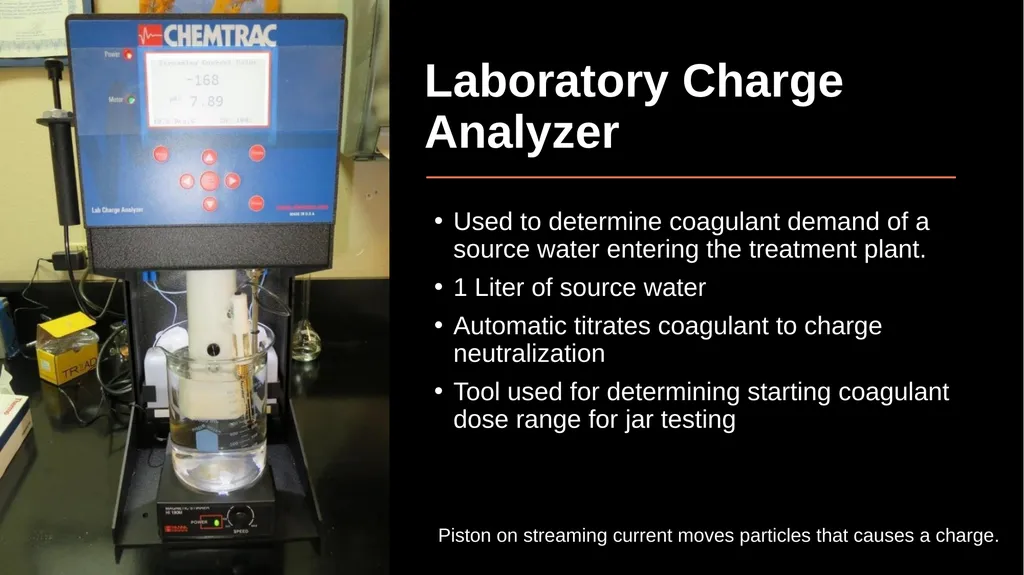
Laboratory Charge Analyzer Used to determine coagulant demand of a source water entering the treatment plant.
1 Liter of source water
Automatic titrates coagulant to charge neutralization
Tool used for determining starting coagulant dose range for jar testing Piston on streaming current moves particles that causes a charge.<br>
1 Liter of source water
Automatic titrates coagulant to charge neutralization
Tool used for determining starting coagulant dose range for jar testing Piston on streaming current moves particles that causes a charge.<br>
37
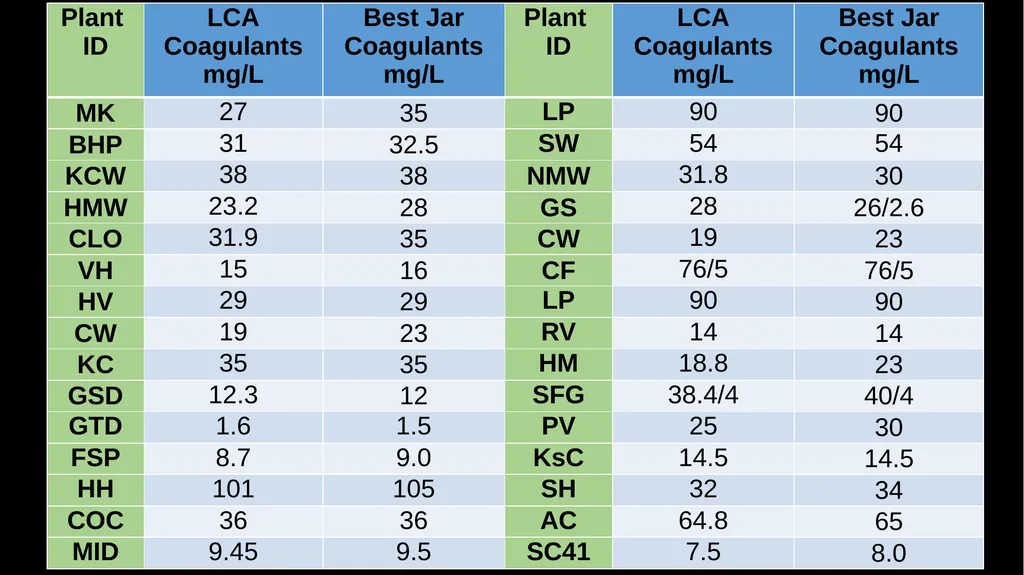
Table of LCA coagulant vs. Jar Test Coagulant<br>
38
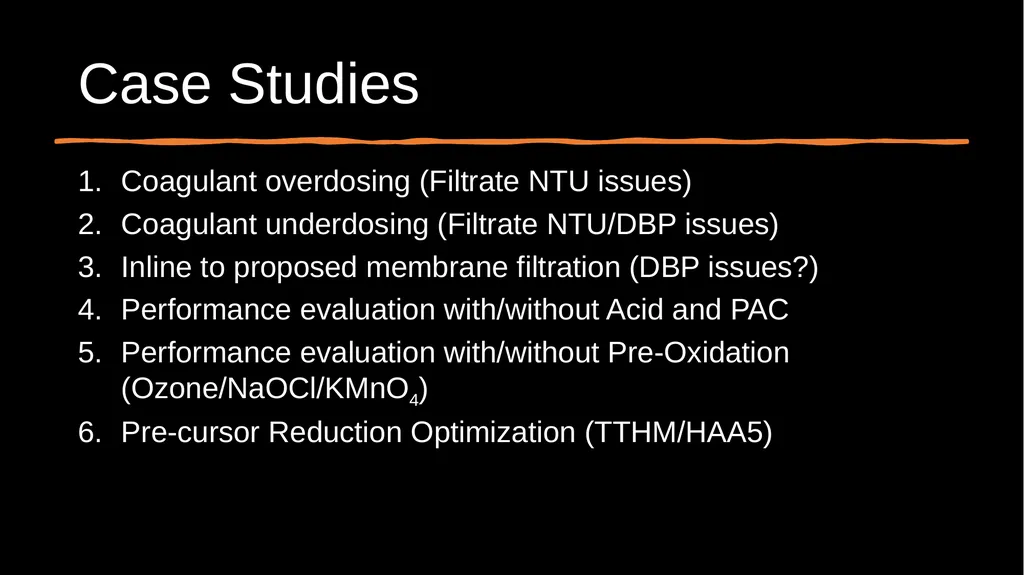
Case Studies Coagulant overdosing (Filtrate NTU issues)
Coagulant underdosing (Filtrate NTU/DBP issues)
Inline to proposed membrane filtration (DBP issues?)
Performance evaluation with/without Acid and PAC
Performance evaluation with/without Pre-Oxidation (Ozone/NaOCl/KMnO4)
Pre-cursor Reduction Optimization (TTHM/HAA5)<br>
Coagulant underdosing (Filtrate NTU/DBP issues)
Inline to proposed membrane filtration (DBP issues?)
Performance evaluation with/without Acid and PAC
Performance evaluation with/without Pre-Oxidation (Ozone/NaOCl/KMnO4)
Pre-cursor Reduction Optimization (TTHM/HAA5)<br>
39
Case 1.
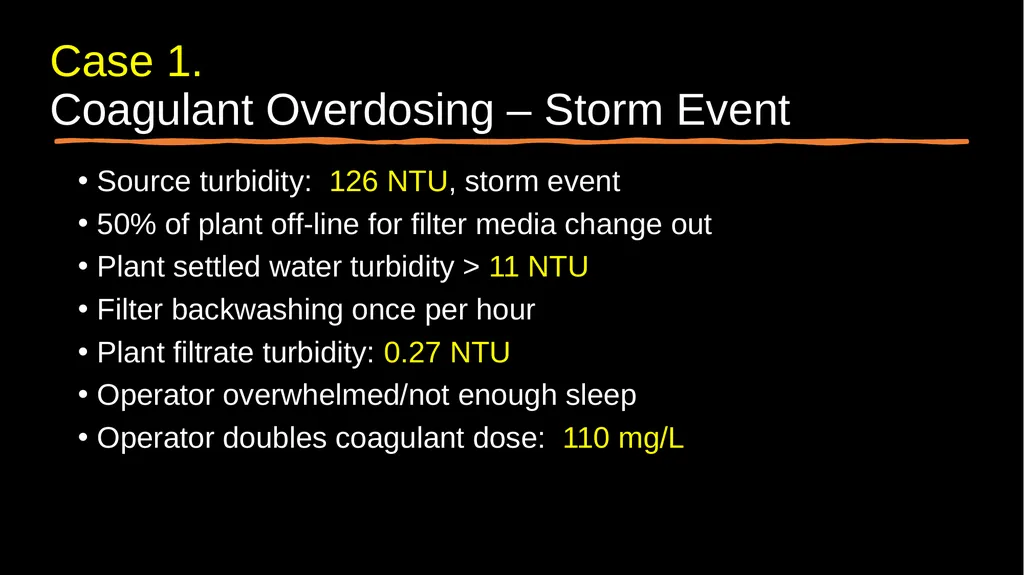
Coagulant Overdosing – Storm Event Source turbidity: 126 NTU, storm event
50% of plant off-line for filter media change out
Plant settled water turbidity > 11 NTU
Filter backwashing once per hour
Plant filtrate turbidity: 0.27 NTU
Operator overwhelmed/not enough sleep
Operator doubles coagulant dose: 110 mg/L<br>
50% of plant off-line for filter media change out
Plant settled water turbidity > 11 NTU
Filter backwashing once per hour
Plant filtrate turbidity: 0.27 NTU
Operator overwhelmed/not enough sleep
Operator doubles coagulant dose: 110 mg/L<br>
40
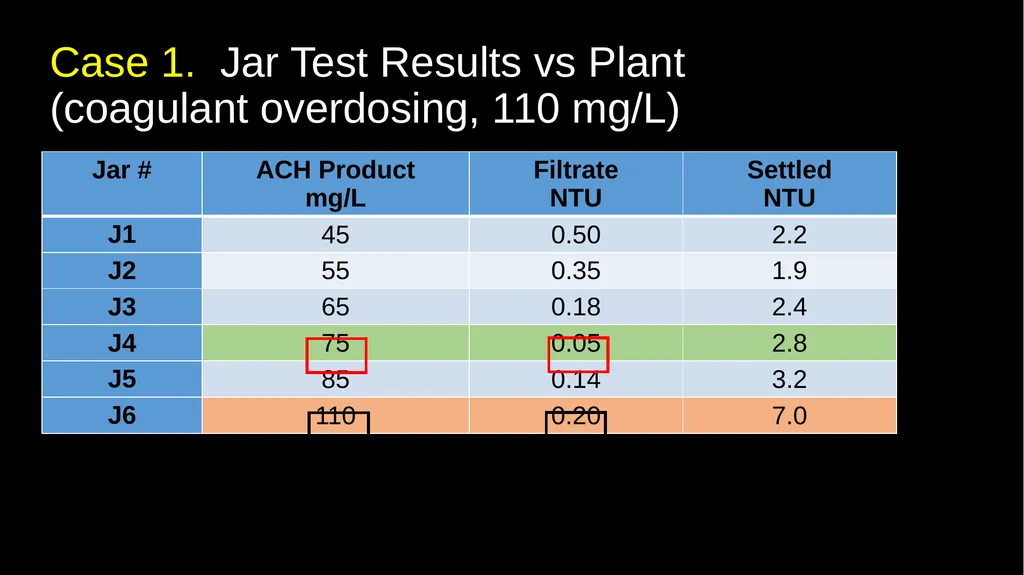
Case 1. Jar Test Results vs Plant
(coagulant overdosing, 110 mg/L)<br>
41
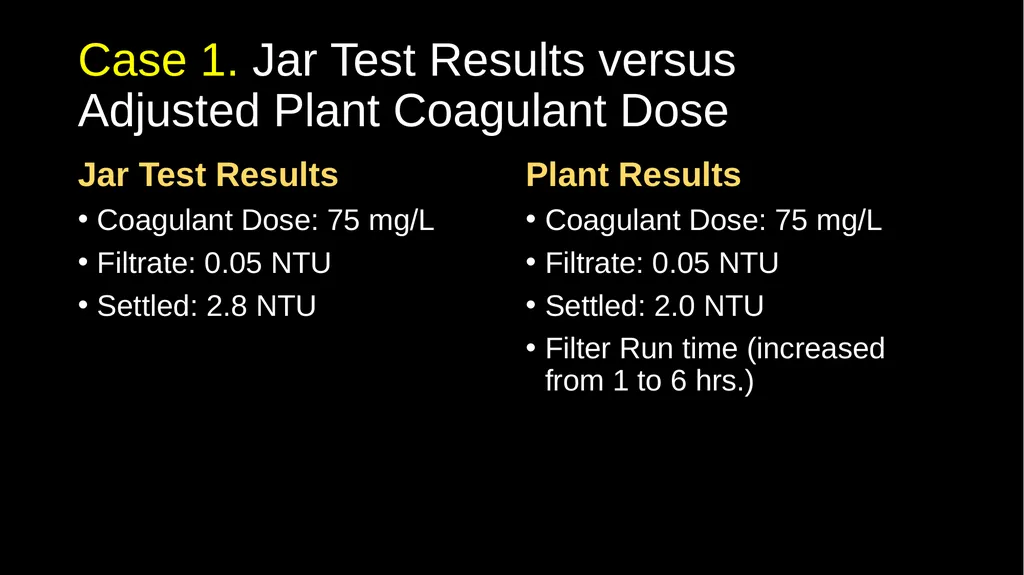
Case 1. Jar Test Results versus
Adjusted Plant Coagulant Dose Jar Test Results
Coagulant Dose: 75 mg/L
Filtrate: 0.05 NTU
Settled: 2.8 NTU Plant Results
Coagulant Dose: 75 mg/L
Filtrate: 0.05 NTU
Settled: 2.0 NTU
Filter Run time (increased from 1 to 6 hrs.)<br>
Coagulant Dose: 75 mg/L
Filtrate: 0.05 NTU
Settled: 2.8 NTU Plant Results
Coagulant Dose: 75 mg/L
Filtrate: 0.05 NTU
Settled: 2.0 NTU
Filter Run time (increased from 1 to 6 hrs.)<br>
42
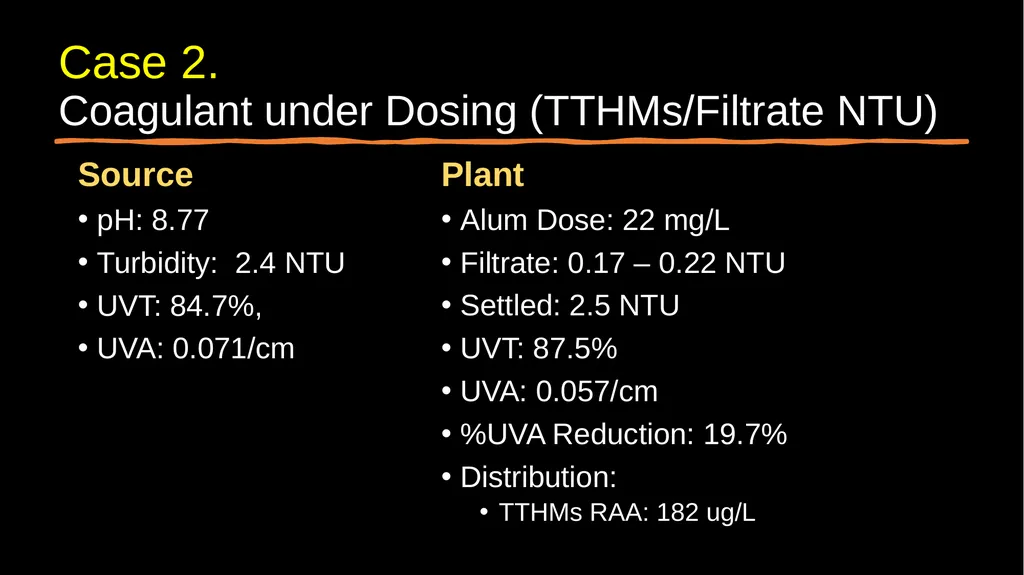
Case 2.
Coagulant under Dosing (TTHMs/Filtrate NTU) Source
pH: 8.77
Turbidity: 2.4 NTU
UVT: 84.7%,
UVA: 0.071/cm Plant
Alum Dose: 22 mg/L
Filtrate: 0.17 – 0.22 NTU
Settled: 2.5 NTU
UVT: 87.5%
UVA: 0.057/cm
%UVA Reduction: 19.7%
Distribution:
TTHMs RAA: 182 ug/L<br>
pH: 8.77
Turbidity: 2.4 NTU
UVT: 84.7%,
UVA: 0.071/cm Plant
Alum Dose: 22 mg/L
Filtrate: 0.17 – 0.22 NTU
Settled: 2.5 NTU
UVT: 87.5%
UVA: 0.057/cm
%UVA Reduction: 19.7%
Distribution:
TTHMs RAA: 182 ug/L<br>
43
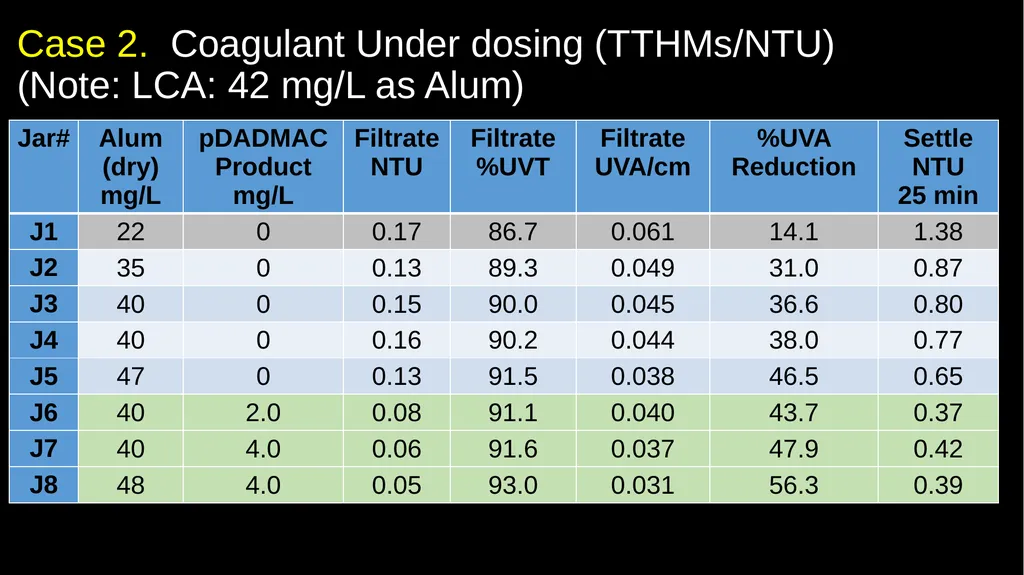
Case 2. Coagulant Under dosing (TTHMs/NTU)
(Note: LCA: 42 mg/L as Alum)<br>
44
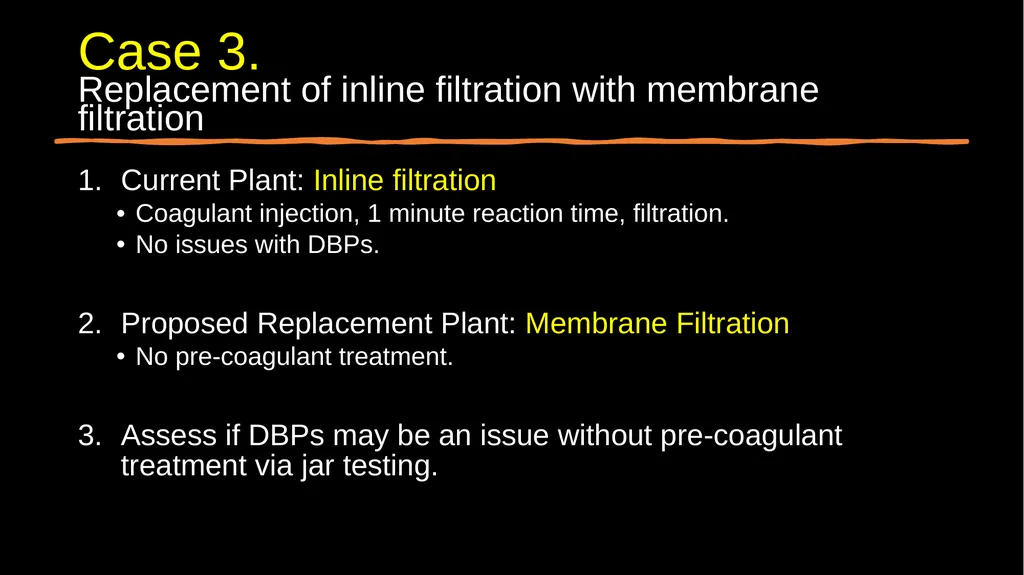
Case 3.
Replacement of inline filtration with membrane filtration Current Plant: Inline filtration
Coagulant injection, 1 minute reaction time, filtration.
No issues with DBPs.
Proposed Replacement Plant: Membrane Filtration
No pre-coagulant treatment.
Assess if DBPs may be an issue without pre-coagulant treatment via jar testing.<br>
Coagulant injection, 1 minute reaction time, filtration.
No issues with DBPs.
Proposed Replacement Plant: Membrane Filtration
No pre-coagulant treatment.
Assess if DBPs may be an issue without pre-coagulant treatment via jar testing.<br>
45
Case 3.
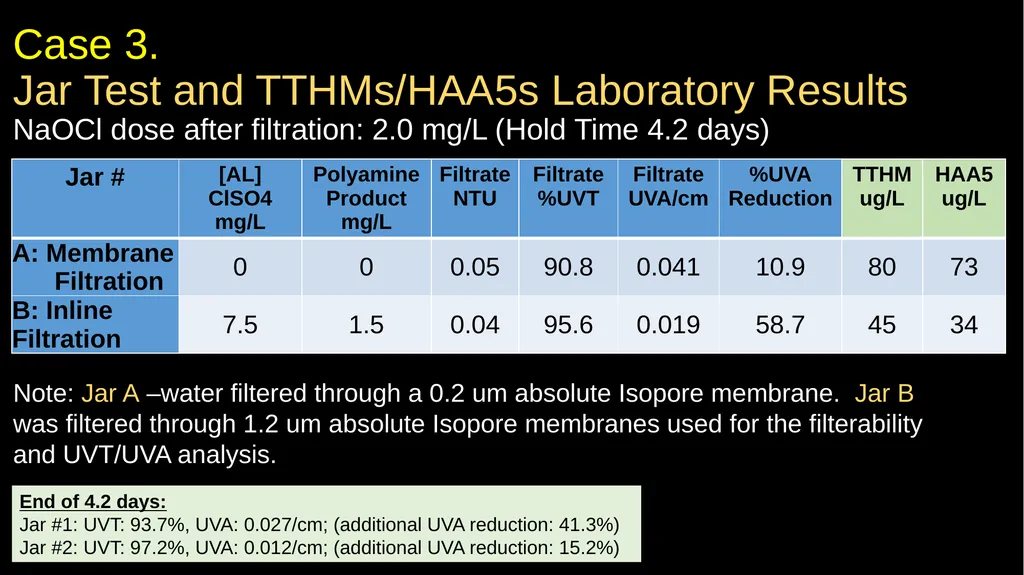
Jar Test and TTHMs/HAA5s Laboratory Results
NaOCl dose after filtration: 2.0 mg/L (Hold Time 4.2 days) End of 4.2 days:
Jar #1: UVT: 93.7%, UVA: 0.027/cm; (additional UVA reduction: 41.3%)
Jar #2: UVT: 97.2%, UVA: 0.012/cm; (additional UVA reduction: 15.2%) Note: Jar A –water filtered through a 0.2 um absolute Isopore membrane. Jar B was filtered through 1.2 um absolute Isopore membranes used for the filterability and UVT/UVA analysis.<br>
Jar #1: UVT: 93.7%, UVA: 0.027/cm; (additional UVA reduction: 41.3%)
Jar #2: UVT: 97.2%, UVA: 0.012/cm; (additional UVA reduction: 15.2%) Note: Jar A –water filtered through a 0.2 um absolute Isopore membrane. Jar B was filtered through 1.2 um absolute Isopore membranes used for the filterability and UVT/UVA analysis.<br>
46
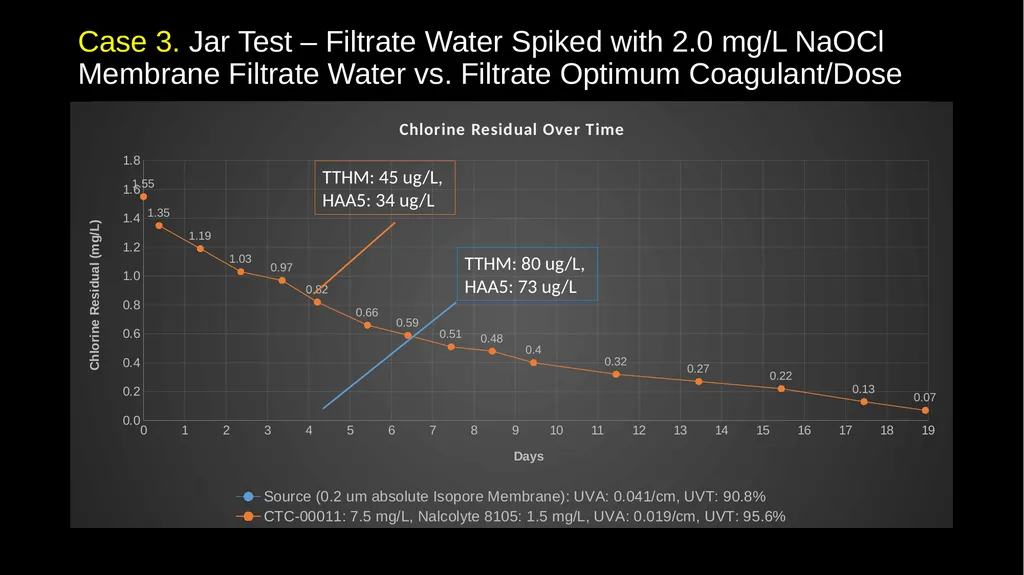
Case 3. Jar Test – Filtrate Water Spiked with 2.0 mg/L NaOCl
Membrane Filtrate Water vs. Filtrate Optimum Coagulant/Dose TTHM: 45 ug/L,
HAA5: 34 ug/L TTHM: 80 ug/L,
HAA5: 73 ug/L<br>
HAA5: 34 ug/L TTHM: 80 ug/L,
HAA5: 73 ug/L<br>
47
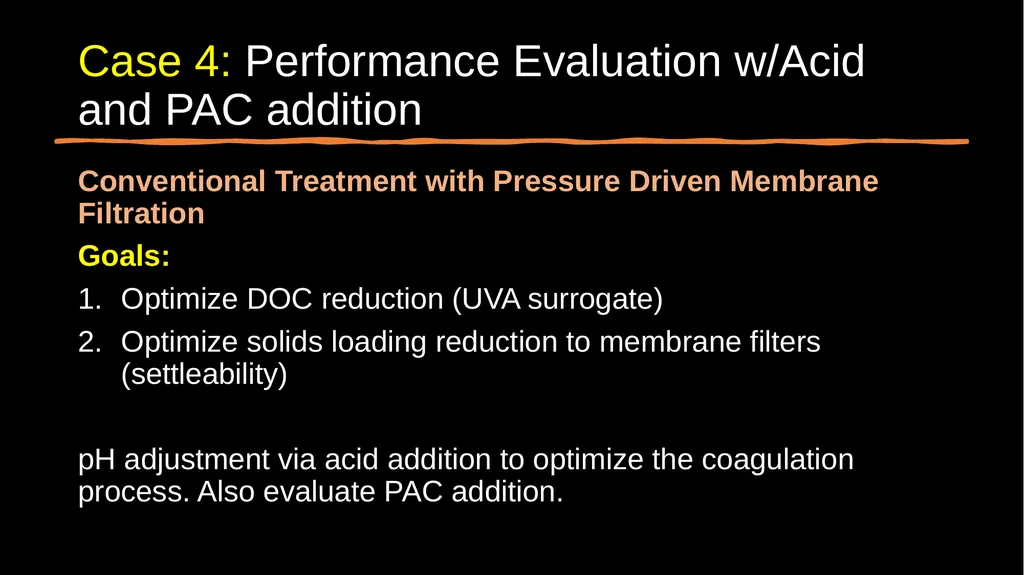
Case 4: Performance Evaluation w/Acid and PAC addition Conventional Treatment with Pressure Driven Membrane Filtration
Goals:
Optimize DOC reduction (UVA surrogate)
Optimize solids loading reduction to membrane filters (settleability)
pH adjustment via acid addition to optimize the coagulation process. Also evaluate PAC addition.<br>
Goals:
Optimize DOC reduction (UVA surrogate)
Optimize solids loading reduction to membrane filters (settleability)
pH adjustment via acid addition to optimize the coagulation process. Also evaluate PAC addition.<br>
48
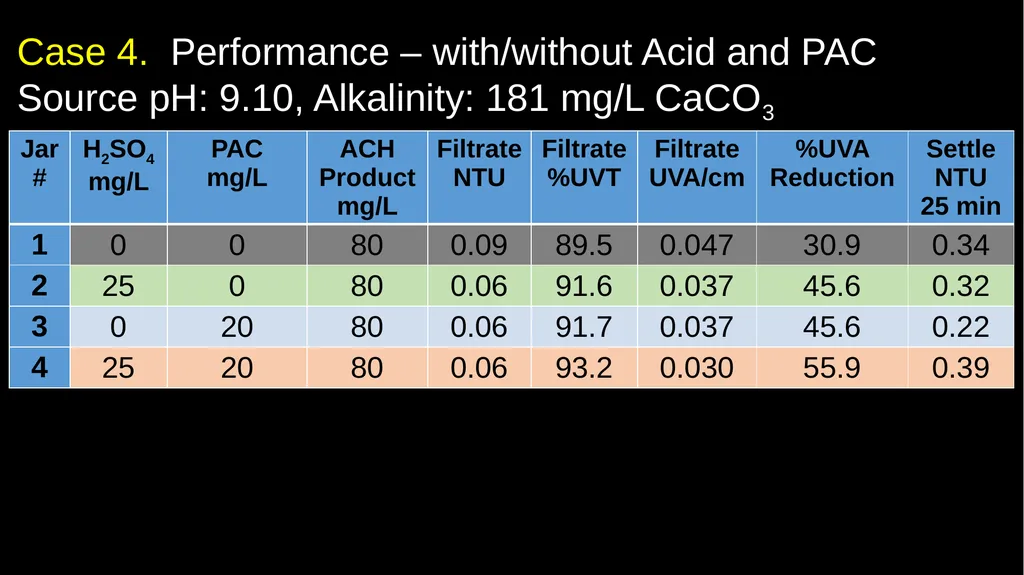
Case 4. Performance – with/without Acid and PAC
Source pH: 9.10, Alkalinity: 181 mg/L CaCO3<br>
49
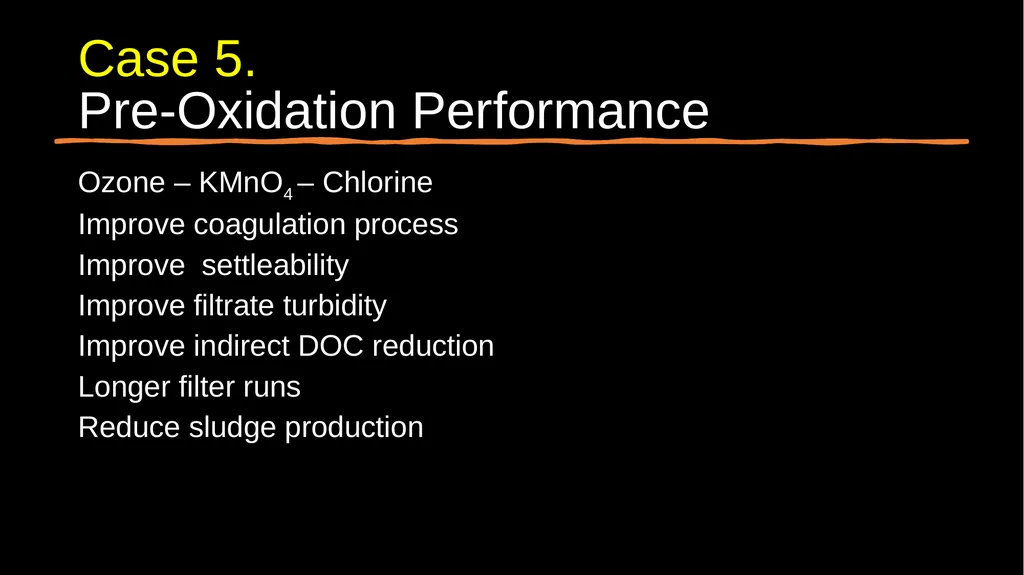
Case 5.
Pre-Oxidation Performance Ozone – KMnO4 – Chlorine
Improve coagulation process
Improve settleability
Improve filtrate turbidity
Improve indirect DOC reduction
Longer filter runs
Reduce sludge production<br>
Improve coagulation process
Improve settleability
Improve filtrate turbidity
Improve indirect DOC reduction
Longer filter runs
Reduce sludge production<br>
50
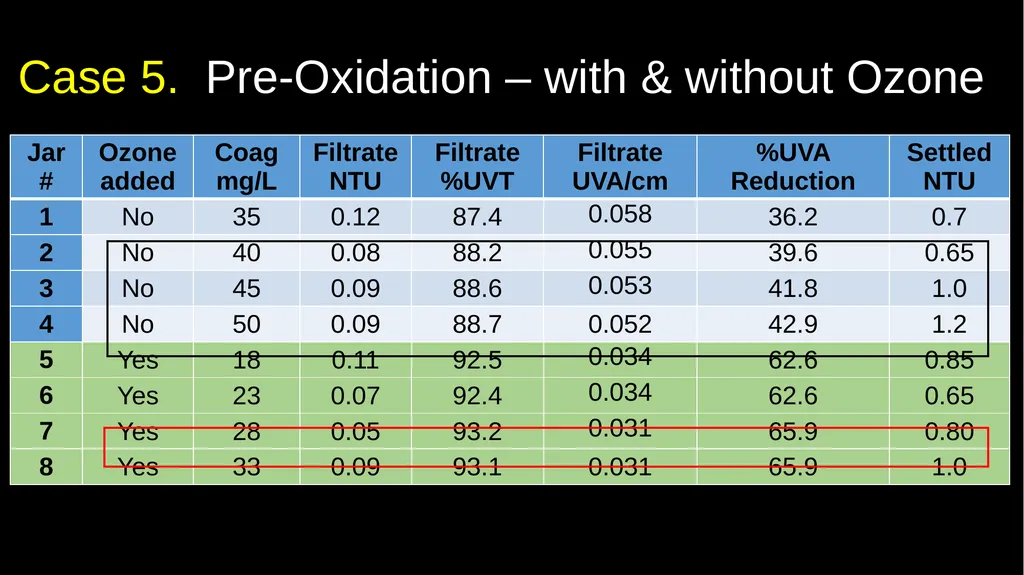
Case 5. Pre-Oxidation – with & without Ozone<br>
51
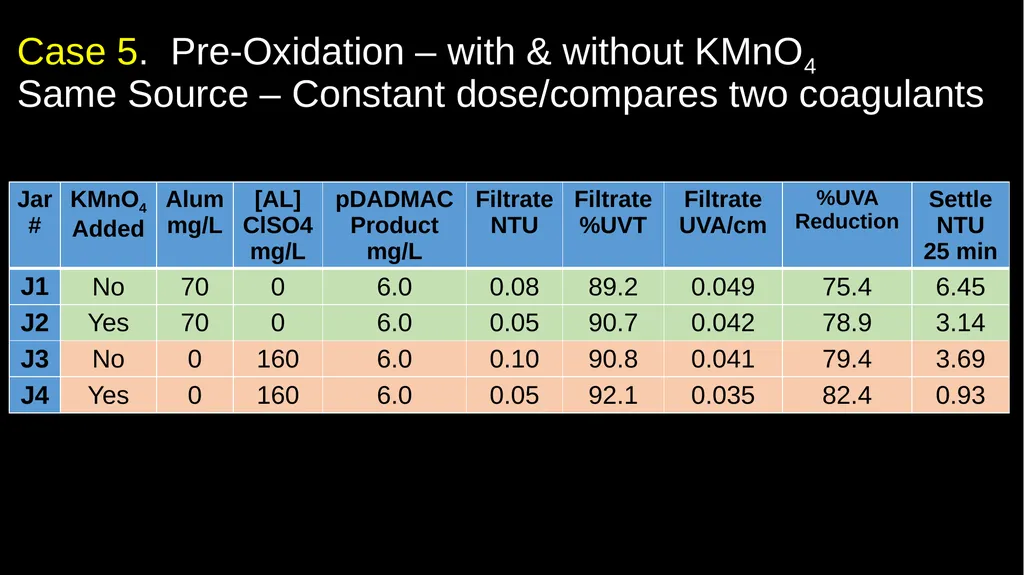
Case 5. Pre-Oxidation – with & without KMnO4
Same Source – Constant dose/compares two coagulants<br>
52
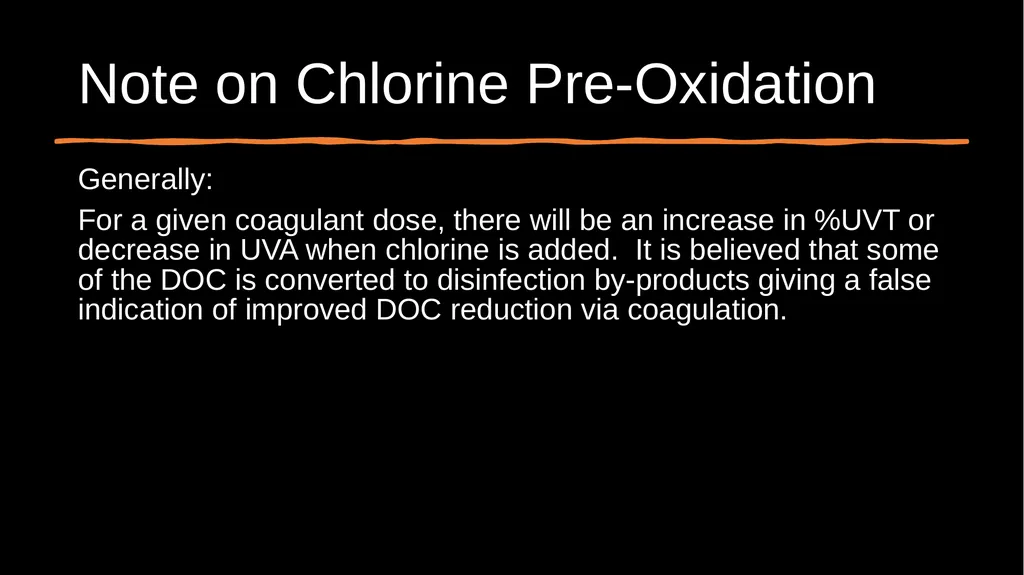
Note on Chlorine Pre-Oxidation Generally:
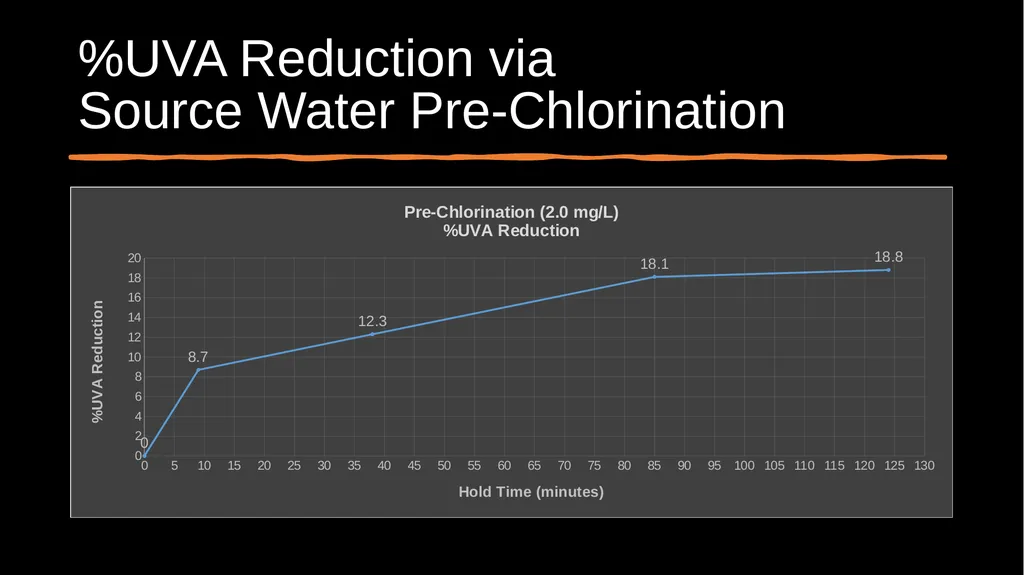
For a given coagulant dose, there will be an increase in %UVT or decrease in UVA when chlorine is added. It is believed that some of the DOC is converted to disinfection by-products giving a false indication of improved DOC reduction via coagulation.<br>
For a given coagulant dose, there will be an increase in %UVT or decrease in UVA when chlorine is added. It is believed that some of the DOC is converted to disinfection by-products giving a false indication of improved DOC reduction via coagulation.<br>
53
%UVA Reduction via
Source Water Pre-Chlorination<br>
54
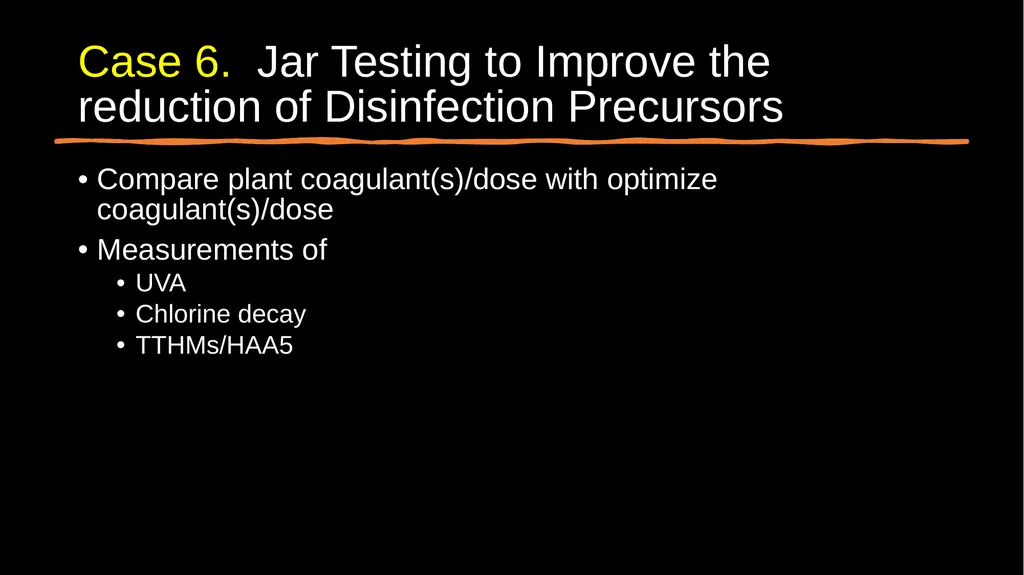
Case 6. Jar Testing to Improve the reduction of Disinfection Precursors Compare plant coagulant(s)/dose with optimize coagulant(s)/dose
Measurements of
UVA
Chlorine decay
TTHMs/HAA5<br>
Measurements of
UVA
Chlorine decay
TTHMs/HAA5<br>
55
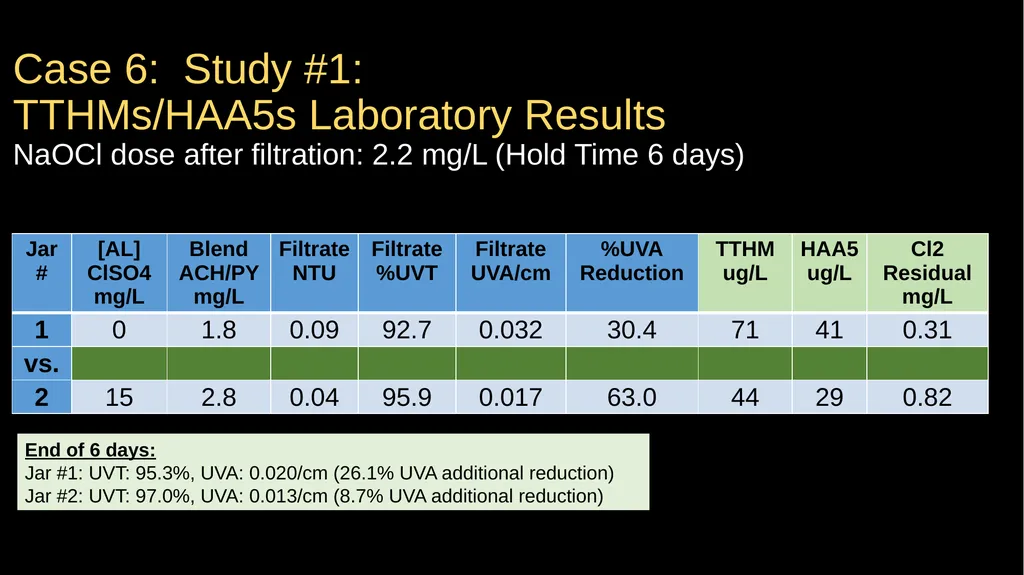
Case 6: Study #1:
TTHMs/HAA5s Laboratory Results
NaOCl dose after filtration: 2.2 mg/L (Hold Time 6 days) End of 6 days:
Jar #1: UVT: 95.3%, UVA: 0.020/cm (26.1% UVA additional reduction)
Jar #2: UVT: 97.0%, UVA: 0.013/cm (8.7% UVA additional reduction)<br>
Jar #1: UVT: 95.3%, UVA: 0.020/cm (26.1% UVA additional reduction)
Jar #2: UVT: 97.0%, UVA: 0.013/cm (8.7% UVA additional reduction)<br>
56
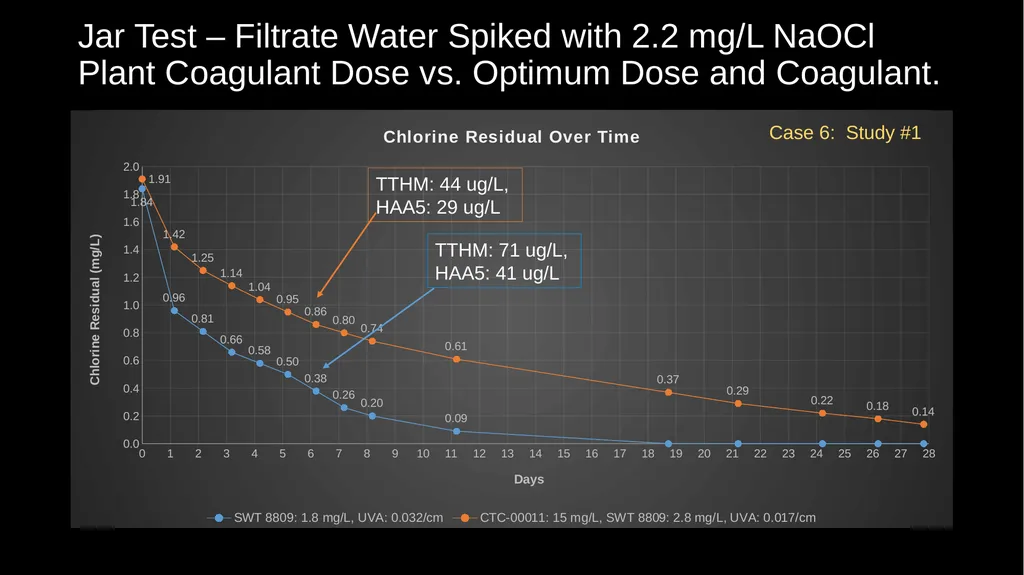
Jar Test – Filtrate Water Spiked with 2.2 mg/L NaOCl
Plant Coagulant Dose vs. Optimum Dose and Coagulant. TTHM: 44 ug/L,
HAA5: 29 ug/L TTHM: 71 ug/L,
HAA5: 41 ug/L Case 6: Study #1<br>
HAA5: 29 ug/L TTHM: 71 ug/L,
HAA5: 41 ug/L Case 6: Study #1<br>
57
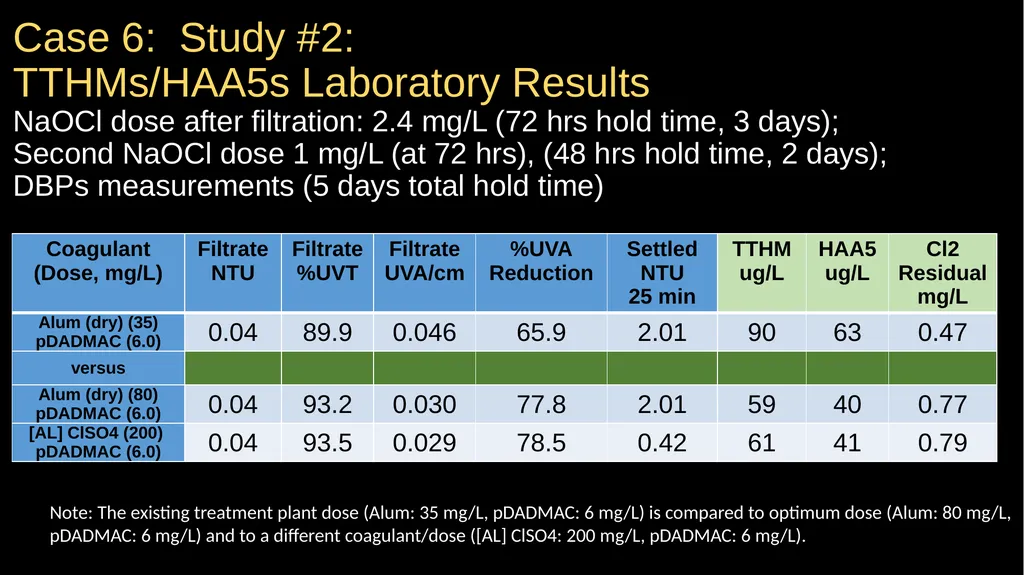
Case 6: Study #2:
TTHMs/HAA5s Laboratory Results
NaOCl dose after filtration: 2.4 mg/L (72 hrs hold time, 3 days);
Second NaOCl dose 1 mg/L (at 72 hrs), (48 hrs hold time, 2 days);
DBPs measurements (5 days total hold time) Note: The existing treatment plant dose (Alum: 35 mg/L, pDADMAC: 6 mg/L) is compared to optimum dose (Alum: 80 mg/L,
pDADMAC: 6 mg/L) and to a different coagulant/dose ([AL] ClSO4: 200 mg/L, pDADMAC: 6 mg/L).<br>
pDADMAC: 6 mg/L) and to a different coagulant/dose ([AL] ClSO4: 200 mg/L, pDADMAC: 6 mg/L).<br>
58
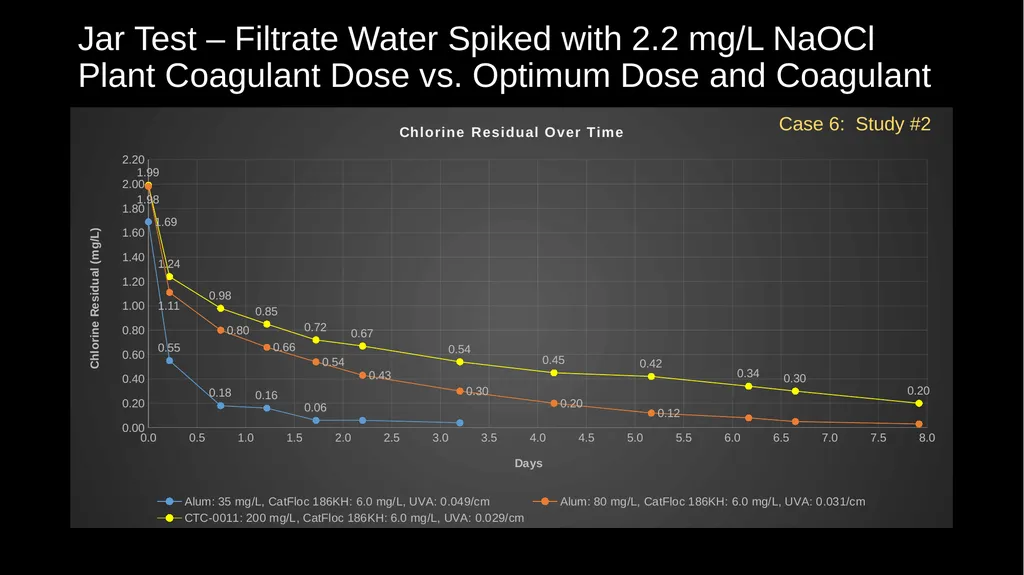
Jar Test – Filtrate Water Spiked with 2.2 mg/L NaOCl
Plant Coagulant Dose vs. Optimum Dose and Coagulant Case 6: Study #2<br>
59
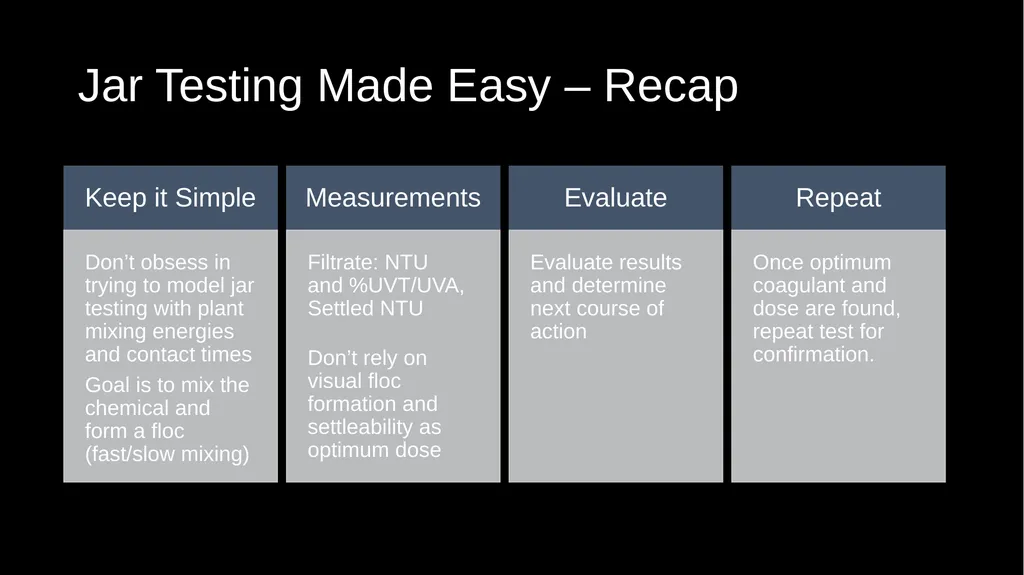
Jar Testing Made Easy – Recap<br>
60
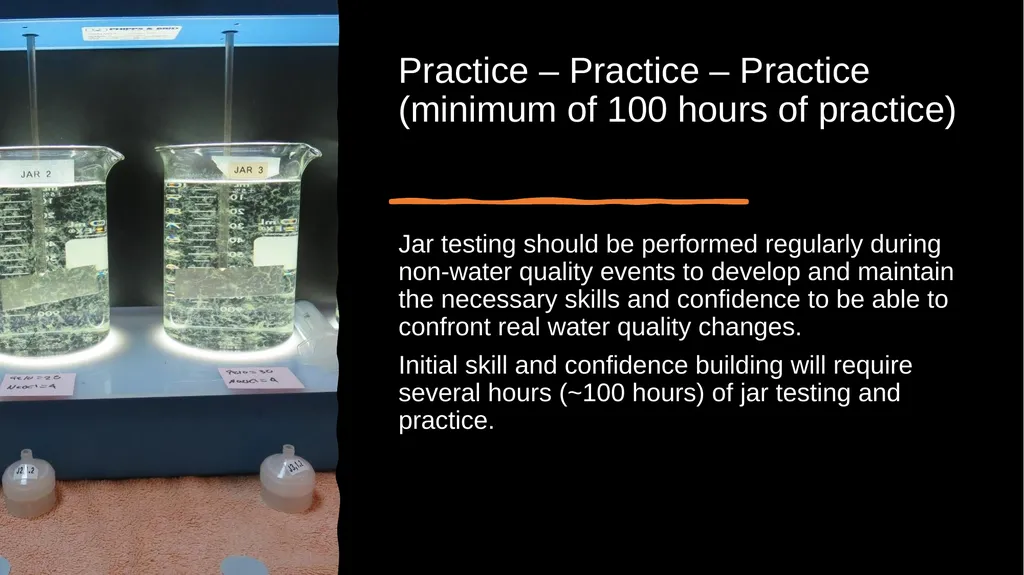
Practice – Practice – Practice
(minimum of 100 hours of practice) Jar testing should be performed regularly during non-water quality events to develop and maintain the necessary skills and confidence to be able to confront real water quality changes.
Initial skill and confidence building will require several hours (~100 hours) of jar testing and practice.<br>
Initial skill and confidence building will require several hours (~100 hours) of jar testing and practice.<br>
61
Thank you for attending!
Contact and Links Guy Schott, P.E.
State Water Resources Control Board
Division of Drinking Water
Santa Rosa, CA
Go to Jar Test Results/Procedures for tools to download
www.waterboards.ca.gov/drinking_water/programs/districts/mendocino_district.html
Email: Guy Schott - Guy.Schott@waterboards.ca.gov
Office Number: 707-576-2732<br>
State Water Resources Control Board
Division of Drinking Water
Santa Rosa, CA
Go to Jar Test Results/Procedures for tools to download
www.waterboards.ca.gov/drinking_water/programs/districts/mendocino_district.html
Email: Guy Schott - Guy.Schott@waterboards.ca.gov
Office Number: 707-576-2732<br>