
Lesson 1.5 Analyzing Findings Correlation
JO
Published · 32 slides · 0 views
1 / 1

Description
Lesson 1.5 Analyzing Findings Correlation Correlation: relation between two or more variables; when two variables are correlated, one variable change as the other does (Figure 1) Example: As ice cream sales increase, so do drowning deaths
Related Topics
Share
Embed code
Download this presentation From Below
"Lesson 1.5 Analyzing Findings Correlation" is the property of its rightful owner. Permission is granted to download and print the materials on this website for personal, non-commercial use only, and to display it on your personal computer provided you do not modify the materials and that you retain all copyright notices contained in the materials. By downloading content from our website, you accept the terms of this agreement.
Presentation Transcript
01
Lesson 1.5 Analyzing Findings<br>
02
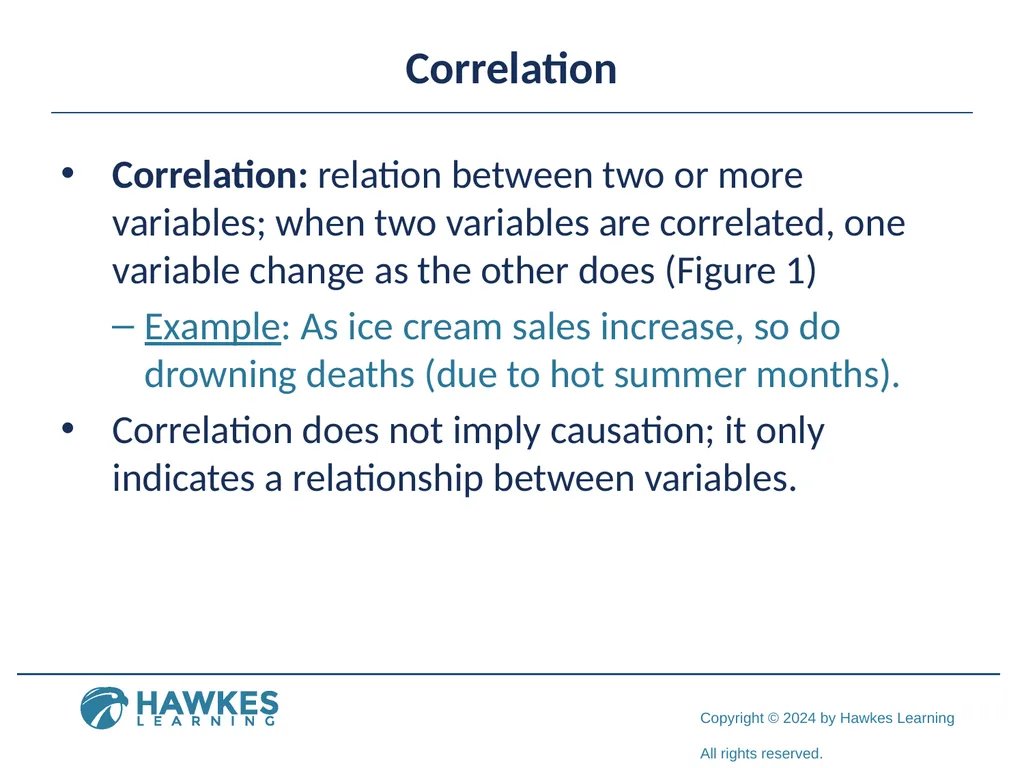
Correlation Correlation: relation between two or more variables; when two variables are correlated, one variable change as the other does (Figure 1)
Example: As ice cream sales increase, so do drowning deaths (due to hot summer months).
Correlation does not imply causation; it only indicates a relationship between variables.<br>
Example: As ice cream sales increase, so do drowning deaths (due to hot summer months).
Correlation does not imply causation; it only indicates a relationship between variables.<br>
03
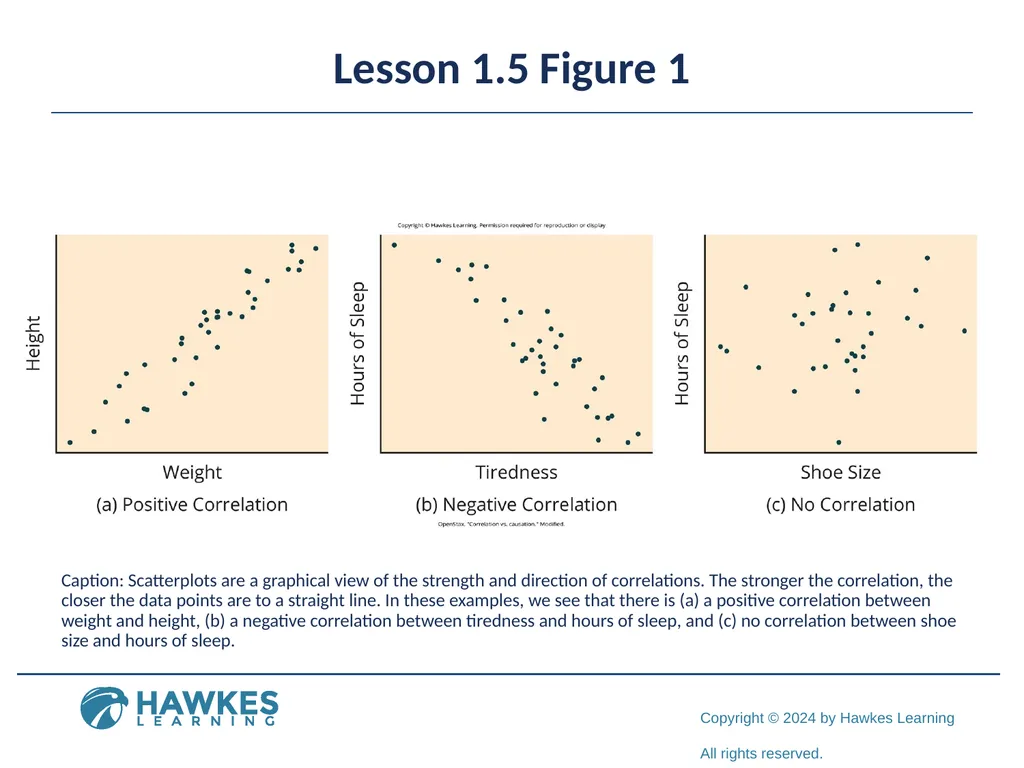
Lesson 1.5 Figure 1 Caption: Scatterplots are a graphical view of the strength and direction of correlations. The stronger the correlation, the closer the data points are to a straight line. In these examples, we see that there is (a) a positive correlation between weight and height, (b) a negative correlation between tiredness and hours of sleep, and (c) no correlation between shoe size and hours of sleep.<br>
04
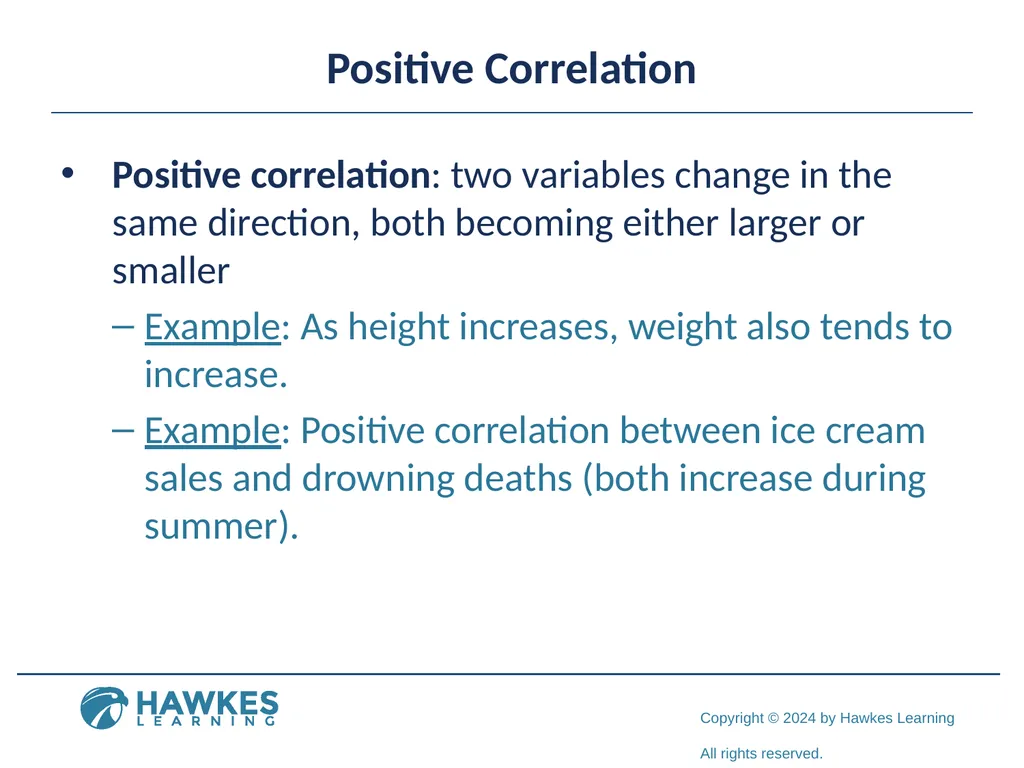
Positive Correlation Positive correlation: two variables change in the same direction, both becoming either larger or smaller
Example: As height increases, weight also tends to increase.
Example: Positive correlation between ice cream sales and drowning deaths (both increase during summer).<br>
Example: As height increases, weight also tends to increase.
Example: Positive correlation between ice cream sales and drowning deaths (both increase during summer).<br>
05
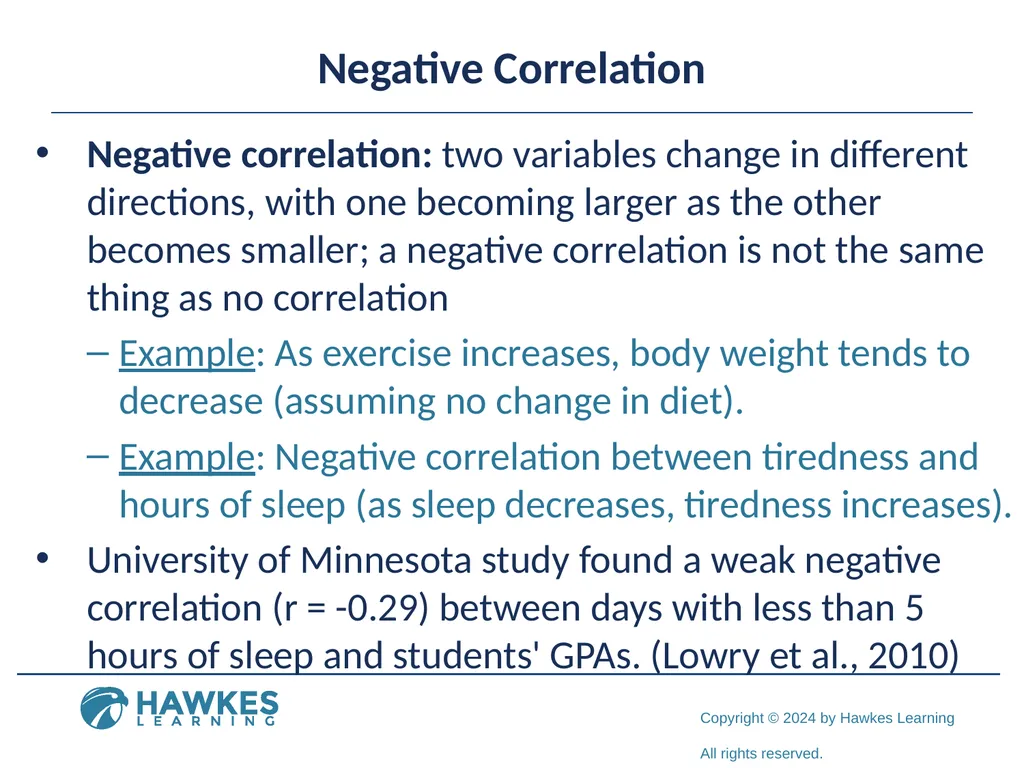
Negative Correlation Negative correlation: two variables change in different directions, with one becoming larger as the other becomes smaller; a negative correlation is not the same thing as no correlation
Example: As exercise increases, body weight tends to decrease (assuming no change in diet).
Example: Negative correlation between tiredness and hours of sleep (as sleep decreases, tiredness increases).
University of Minnesota study found a weak negative correlation (r = -0.29) between days with less than 5 hours of sleep and students' GPAs. (Lowry et al., 2010)<br>
06
On Your Own1 Identify your own positive and negative correlations. Give two examples for each.<br>
07
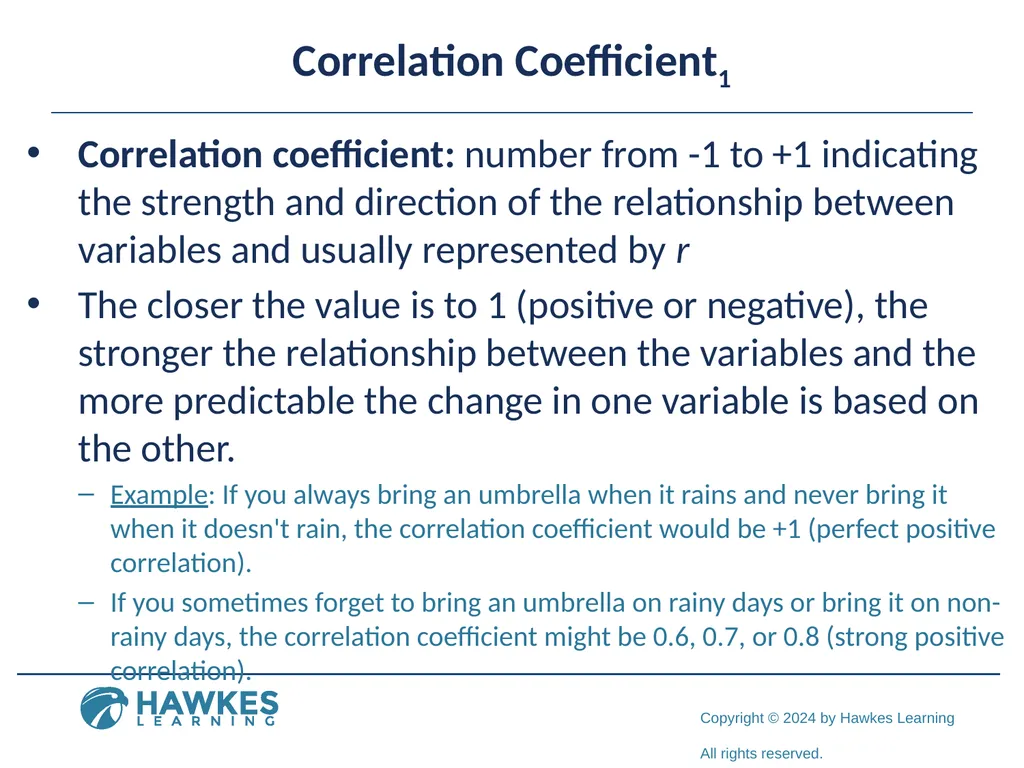
Correlation Coefficient1 Correlation coefficient: number from -1 to +1 indicating the strength and direction of the relationship between variables and usually represented by r
The closer the value is to 1 (positive or negative), the stronger the relationship between the variables and the more predictable the change in one variable is based on the other.
Example: If you always bring an umbrella when it rains and never bring it when it doesn't rain, the correlation coefficient would be +1 (perfect positive correlation).
If you sometimes forget to bring an umbrella on rainy days or bring it on non-rainy days, the correlation coefficient might be 0.6, 0.7, or 0.8 (strong positive correlation).<br>
08
Correlation Coefficient2 The closer the value is to 0, the weaker the relationship between the variables and the less predictable the change in one variable is based on the other.
If two variables are not related at all (e.g., shoe size and hours of sleep), the correlation coefficient is 0 (no correlation).<br>
If two variables are not related at all (e.g., shoe size and hours of sleep), the correlation coefficient is 0 (no correlation).<br>
09
Correlation Does Not Indicate Causation Correlational research shows the strength and direction of relationships between variables but does not establish cause and effect.
Even with a correlation, there could be a confounding variable causing the systematic changes in the variables of interest.
People often mistakenly make causal claims based solely on correlations, which is common in advertisements and news stories.
The major limitation of correlational research is the inability to establish causality between variables.
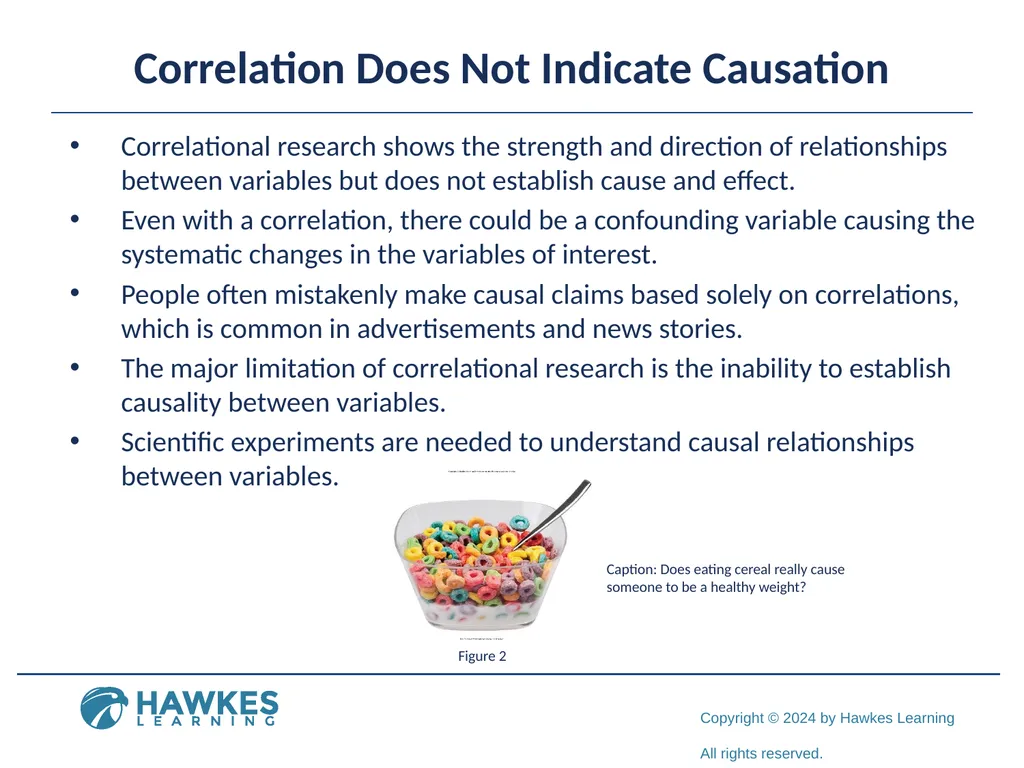
Scientific experiments are needed to understand causal relationships between variables. Figure 2 Caption: Does eating cereal really cause someone to be a healthy weight?<br>
10
Illusory Correlations Illusory correlations: seeing relationships between two things when in reality no such relationship exists
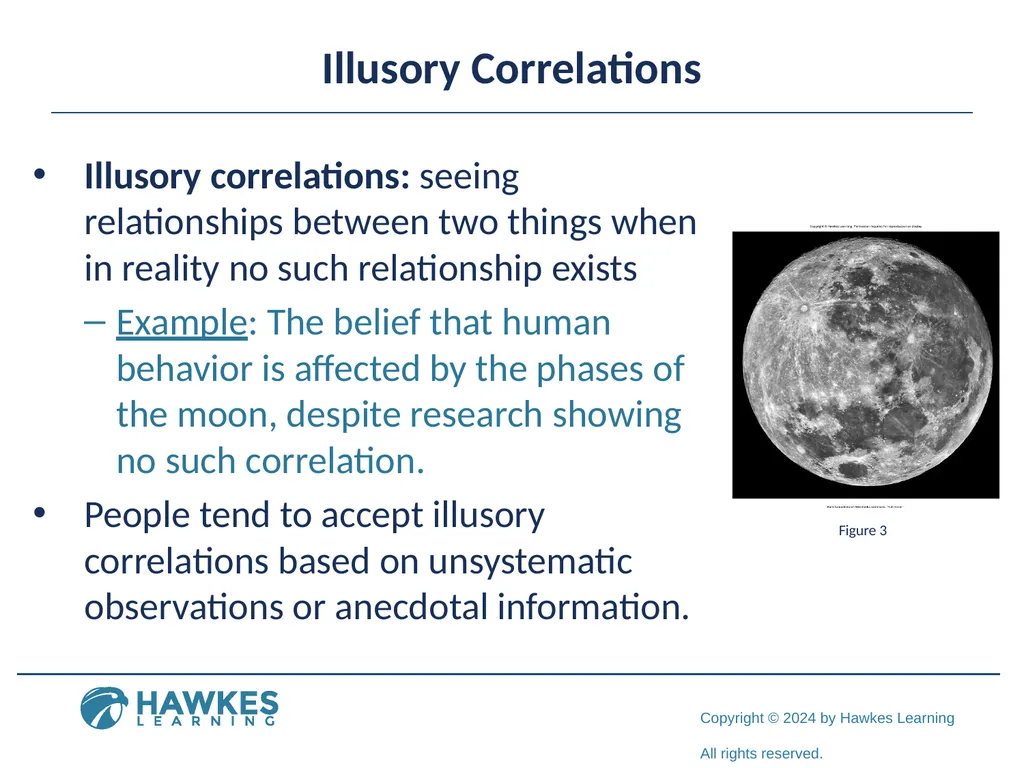
Example: The belief that human behavior is affected by the phases of the moon, despite research showing no such correlation.
People tend to accept illusory correlations based on unsystematic observations or anecdotal information. Figure 3<br>
Example: The belief that human behavior is affected by the phases of the moon, despite research showing no such correlation.
People tend to accept illusory correlations based on unsystematic observations or anecdotal information. Figure 3<br>
11
Confirmation Bias Confirmation bias: tendency to focus on information that supports our beliefs while ignoring or failing to seek contradictory evidence
Contributes to the formation and persistence of illusory correlations.
Example: Looking for evidence to support a hunch about how something works, while disregarding evidence that disproves the hunch.
Illusory correlations and confirmation bias can lead to prejudicial attitudes and discriminatory behavior.<br>
12
Causality Scientific experiments are conducted to establish if there is a cause-and-effect relationship between two variables.
Experiments use controlled settings to determine if one carriable causes a change in the other variable.
Experiments are usually conducted in a laboratory setting to enable researchers to control conditions.<br>
Experiments use controlled settings to determine if one carriable causes a change in the other variable.
Experiments are usually conducted in a laboratory setting to enable researchers to control conditions.<br>
13
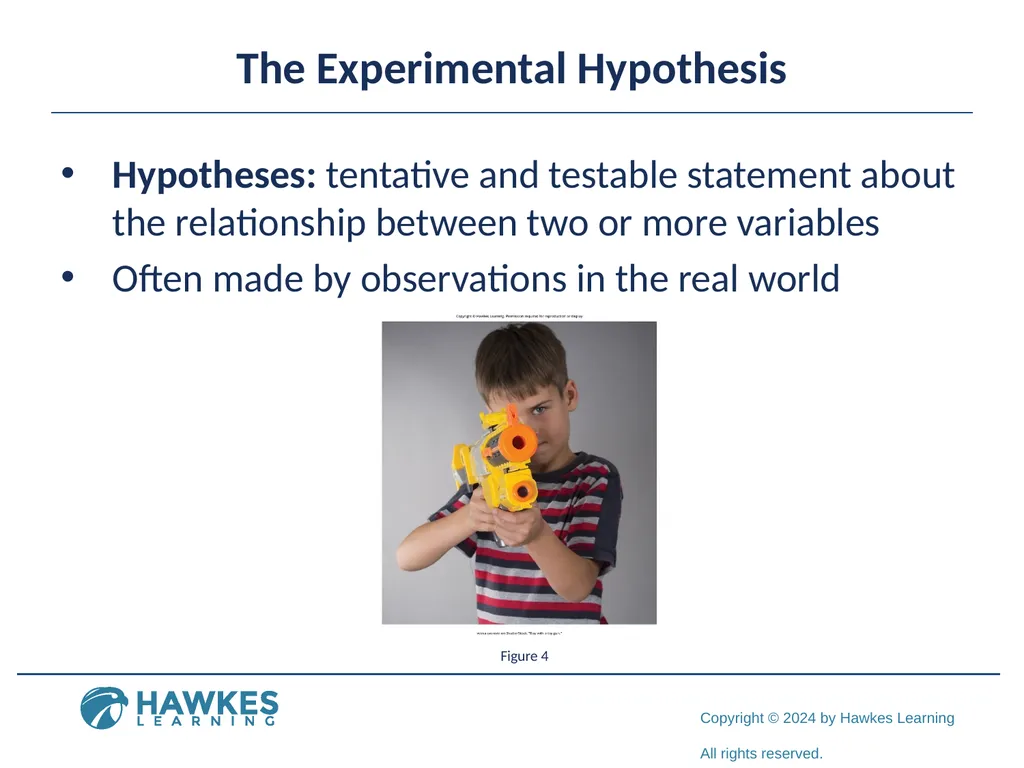
The Experimental Hypothesis Hypotheses: tentative and testable statement about the relationship between two or more variables
Often made by observations in the real world Figure 4<br>
Often made by observations in the real world Figure 4<br>
14
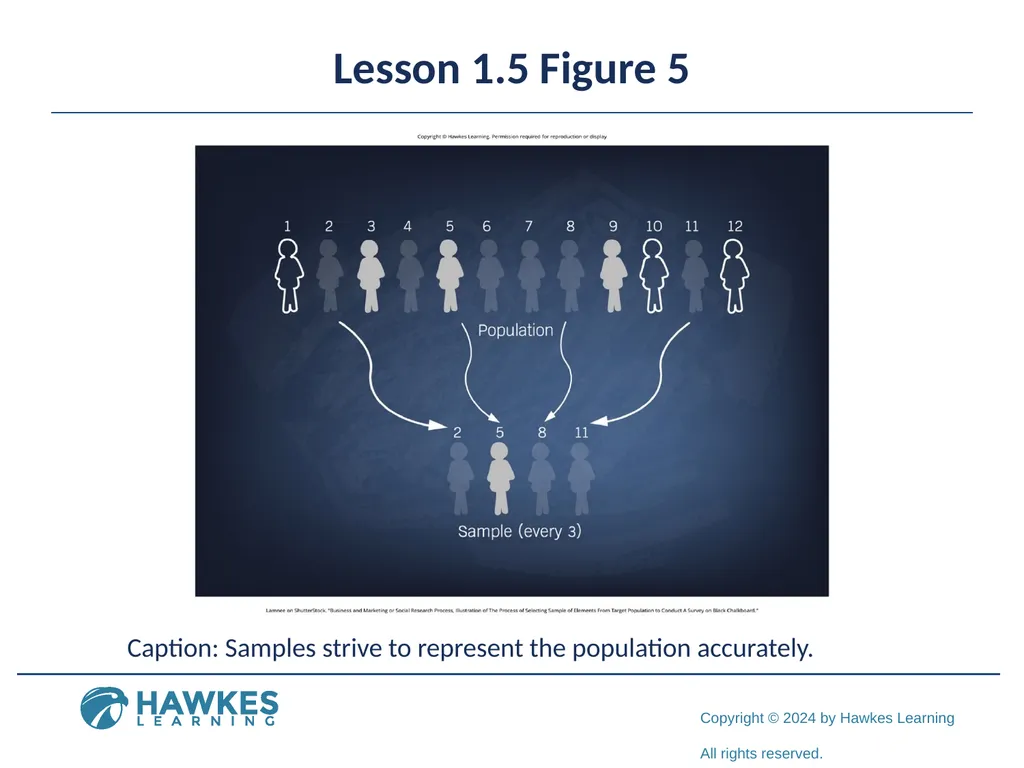
Lesson 1.5 Figure 5 Caption: Samples strive to represent the population accurately.<br>
15
Variables1 Basic experimental design involves two groups:
Experimental group: group designed to answer the research question
Controlled group: serves as a basis for comparison and controls for chance factors that might influence the results of the study
Any differences between the two are due to experimental manipulation rather than chance<br>
Experimental group: group designed to answer the research question
Controlled group: serves as a basis for comparison and controls for chance factors that might influence the results of the study
Any differences between the two are due to experimental manipulation rather than chance<br>
16
Variables2 Example: Albert Bandura hypothesized that watching adults engage in violent behavior on television can cause children to become aggressive in real life
Experimental group: children who watched a video of adults punching, kicking, and hitting a doll
Children were placed in a room with a doll and their behavior was observed
These children were more likely to punch, hit, and kick the doll<br>
Experimental group: children who watched a video of adults punching, kicking, and hitting a doll
Children were placed in a room with a doll and their behavior was observed
These children were more likely to punch, hit, and kick the doll<br>
17
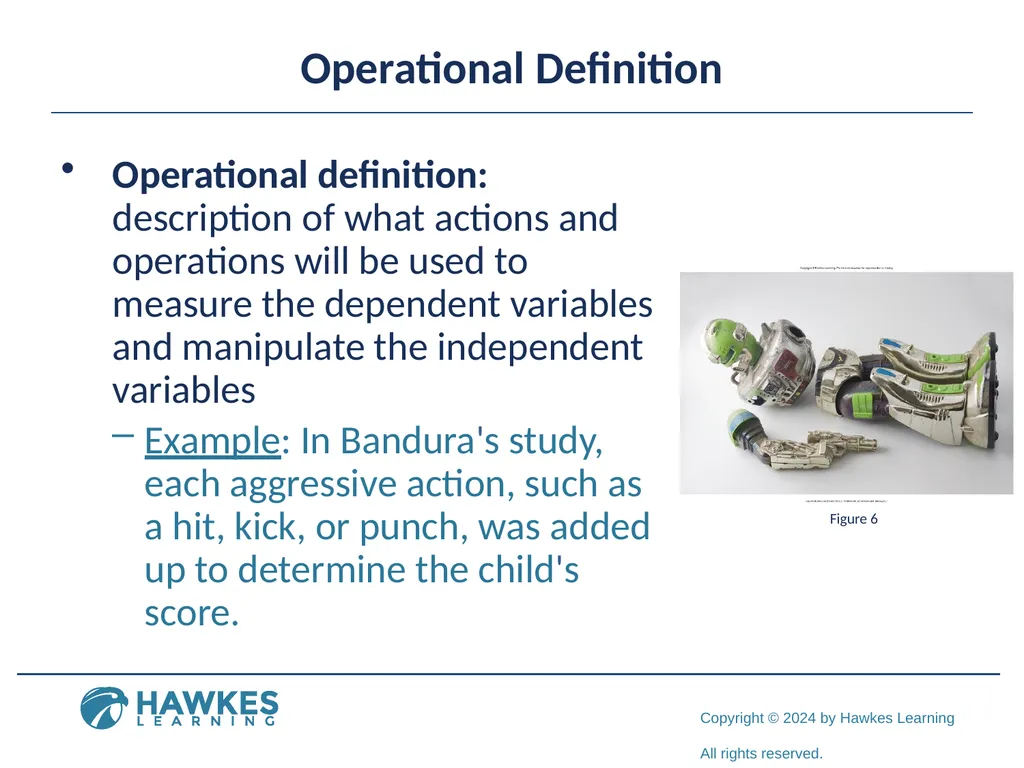
Operational Definition Operational definition: description of what actions and operations will be used to measure the dependent variables and manipulate the independent variables
Example: In Bandura's study, each aggressive action, such as a hit, kick, or punch, was added up to determine the child's score. Figure 6<br>
Example: In Bandura's study, each aggressive action, such as a hit, kick, or punch, was added up to determine the child's score. Figure 6<br>
18
Group Activity Work with your group to come up with your own operational definition for a variable that might be measured in a psychology study. Remember to explain exactly how you are going to measure it.<br>
19
Experimenter Bias Experimenter bias: researcher expectations skew the results of the study
Random assignment is a process that ensures each participant has an equal chance of being assigned to the experimental or control group.
Since Bandura used random assignment to divide the participants into experimental and control groups, his study is less likely to be affected by experimenter bias.
In a single-blind study, the participants are unaware as to which group they are in (experiment or control), while the researcher knows the assignments.
In a double-blind study, both the researchers and the participants are blind to group assignments.<br>
20
Placebo Effect Figure 7 Placebo effect: people's expectations or beliefs influencing or determining their experience in a given situation
Example: An individual feels better after taking a sugar pill believed to be an antidepressant medication.
To control for the placebo effect, researchers randomly assign participants to an experimental and placebo group.
The placebo group takes a pill with a noneffective substance like sugar instead of the actual treatment drug.
Participants cannot know if they are receiving the real treatment or placebo to avoid lowering expectations in the placebo group.<br>
21
Independent Variables Independent variable: variable that is influences or controlled by the experimenter
In an experimental study, the independent variable is the only important difference between experimental and control groups.
In Bandura's doll study, a child's viewing of the aggressive adult behavior was the independent variable.
An independent variable related to violent TV content would be the specific TV shows a child watches.
Researchers manipulate the independent variable to examine its effect on the dependent variable.<br>
22
Dependent Variables Dependent variable: variable that the researcher measures to see how much effect the independent variable had
The dependent variable depends on or is influenced by the independent variable.
In Bandura's study, the number of aggressive acts by children toward dolls was the dependent variable.
For a study on violent TV, a child's display of violent acts could be the dependent variable.
Researchers observe and measure changes in the dependent variable based on the independent variable manipulation.<br>
23
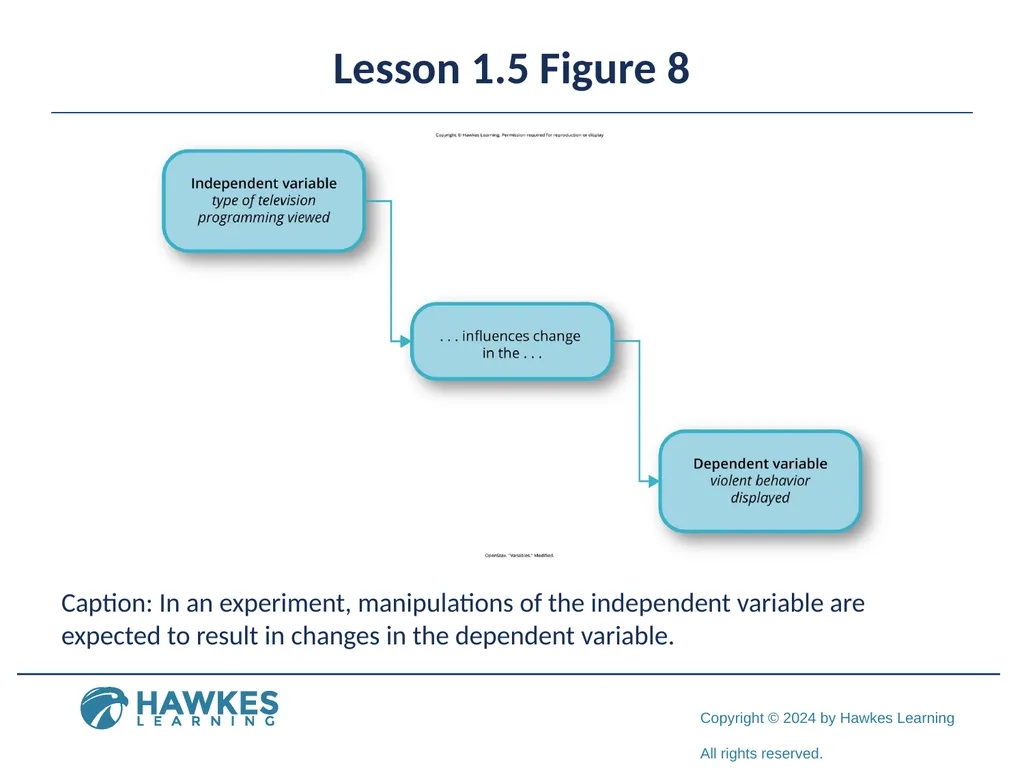
Lesson 1.5 Figure 8 Caption: In an experiment, manipulations of the independent variable are expected to result in changes in the dependent variable.<br>
24
Experimental Participants Participants are the individuals who are involved in psychological research or actively participate in the process.
The group of participants in a study are referred to as the sample.
A population is the larger group that the study's results are intended to apply to.
A sample should be representative of the intended population for the results to be generalizable.
A random sample gives every member of the population an equal chance of being selected for the study.
Random sampling is ideal, as it increases the likelihood the sample represents the larger population.<br>
25
Issues to Consider True experiments require manipulating an independent variable, limiting questions psychologists can study experimentally.
Example: you cannot experimentally manipulate a person's biological sex to study its effect on spatial memory
Research that cannot manipulate the independent variable is considered quasi-experimental, preventing cause-and-effect claims.
Ethical constraints prevent experiments that could potentially harm participants, like studying child abuse effects.
An experiment randomly assigning some participants to experience abuse would be unethical to conduct.
Psychologists must carefully weigh potential scientific benefits against ethical risks when designing experiments.<br>
26
Interpreting Experimental Findings After data is collected from experimental and control groups, a statistical analysis is conducted.
Statistical analysis determines if there are meaningful differences between the two groups.
In Bandura's study, statistical tests revealed if watching the aggressive video significantly impacted aggressive acts.
Significance typically means 95% confidence that the results did not occur by chance.
Bandura's tests showed 95% confidence that watching aggression increased likelihood of aggressive behavior toward the doll.
Statistical analysis allows researchers to interpret if their experimental manipulation had the expected effect.<br>
27
Reporting Research Research psychologists write up findings of their study for publication in a peer-reviewed journal.
The peer review process provides quality control, with other scientists evaluating the study methods and conclusions.
Journal articles follow formatting guidelines from the American Psychological Association (APA).
Peer reviewers assess if the study significantly advances knowledge in the field.
Peer review ensures research is described clearly enough for other scientists to replicate or repeat the study.<br>
28
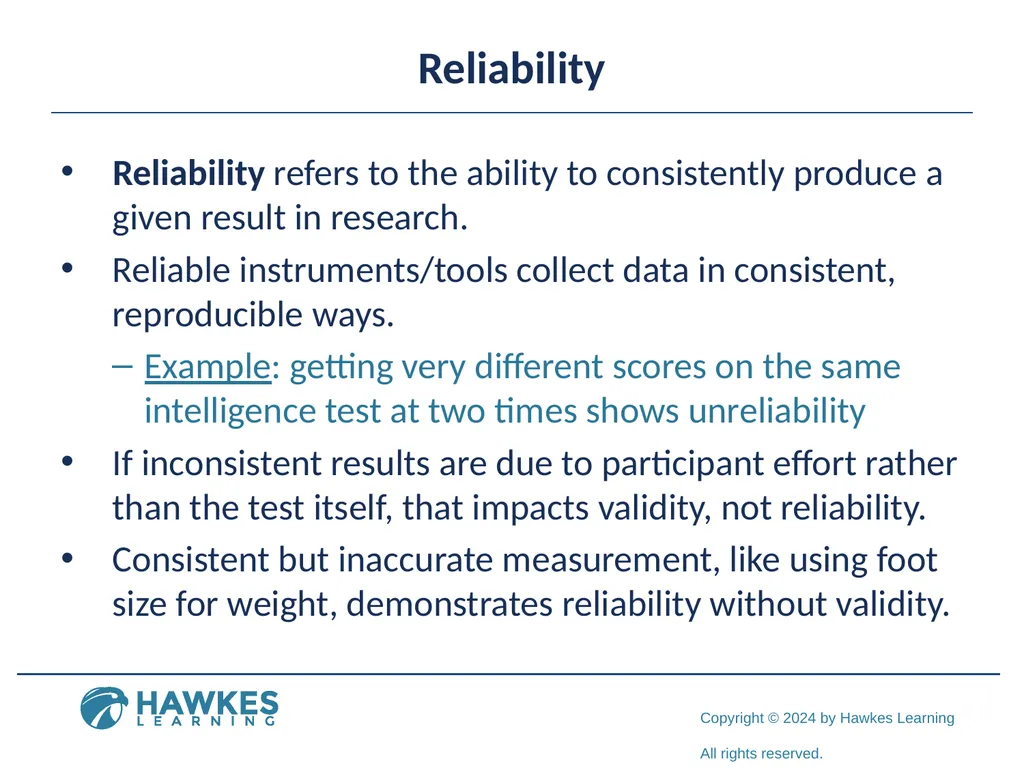
Reliability Reliability refers to the ability to consistently produce a given result in research.
Reliable instruments/tools collect data in consistent, reproducible ways.
Example: getting very different scores on the same intelligence test at two times shows unreliability
If inconsistent results are due to participant effort rather than the test itself, that impacts validity, not reliability.
Consistent but inaccurate measurement, like using foot size for weight, demonstrates reliability without validity.<br>
29
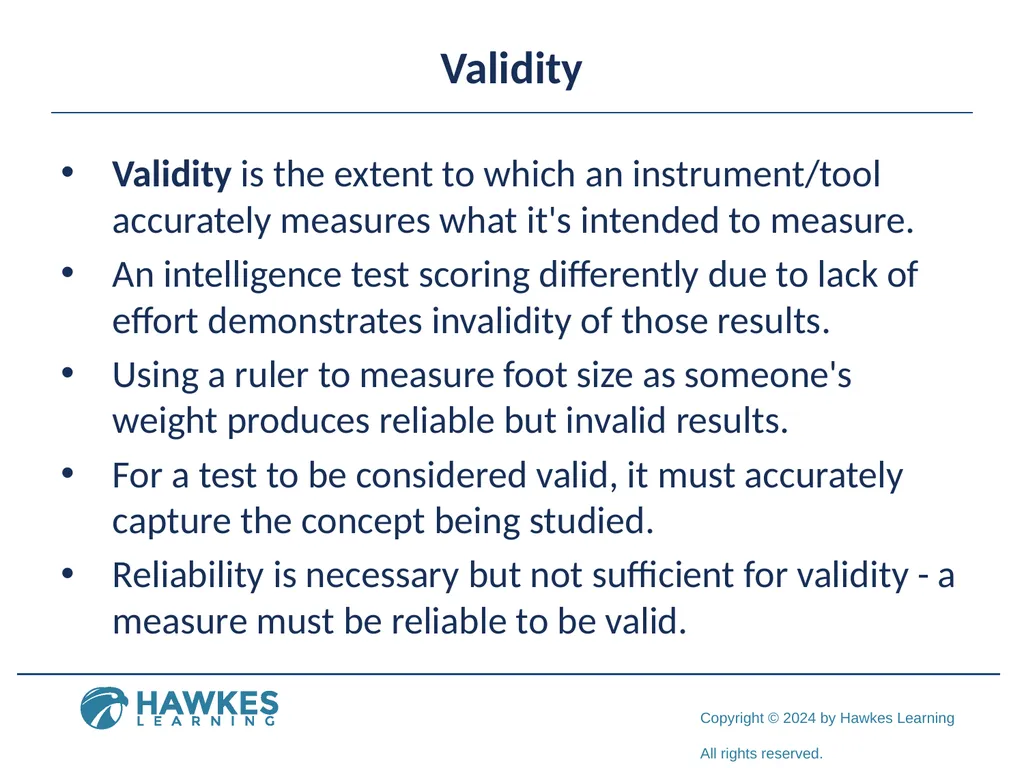
Validity Validity is the extent to which an instrument/tool accurately measures what it's intended to measure.
An intelligence test scoring differently due to lack of effort demonstrates invalidity of those results.
Using a ruler to measure foot size as someone's weight produces reliable but invalid results.
For a test to be considered valid, it must accurately capture the concept being studied.
Reliability is necessary but not sufficient for validity - a measure must be reliable to be valid.<br>
30
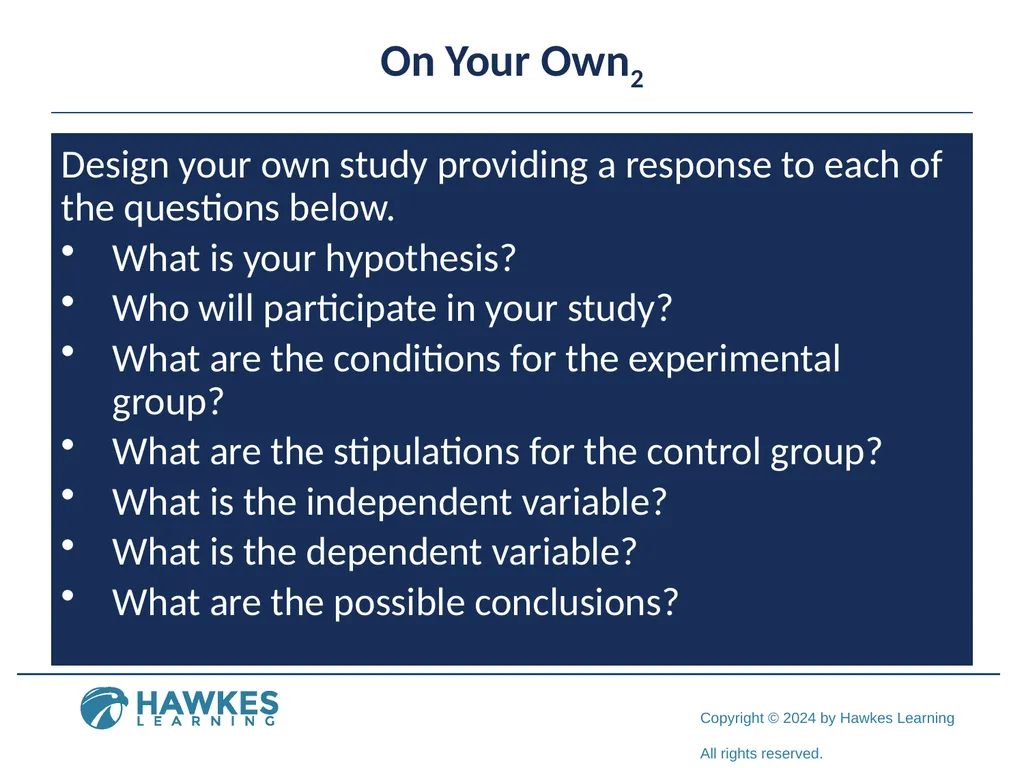
On Your Own2 Design your own study providing a response to each of the questions below.
What is your hypothesis?
Who will participate in your study?
What are the conditions for the experimental group?
What are the stipulations for the control group?
What is the independent variable?
What is the dependent variable?
What are the possible conclusions?<br>
What is your hypothesis?
Who will participate in your study?
What are the conditions for the experimental group?
What are the stipulations for the control group?
What is the independent variable?
What is the dependent variable?
What are the possible conclusions?<br>
31
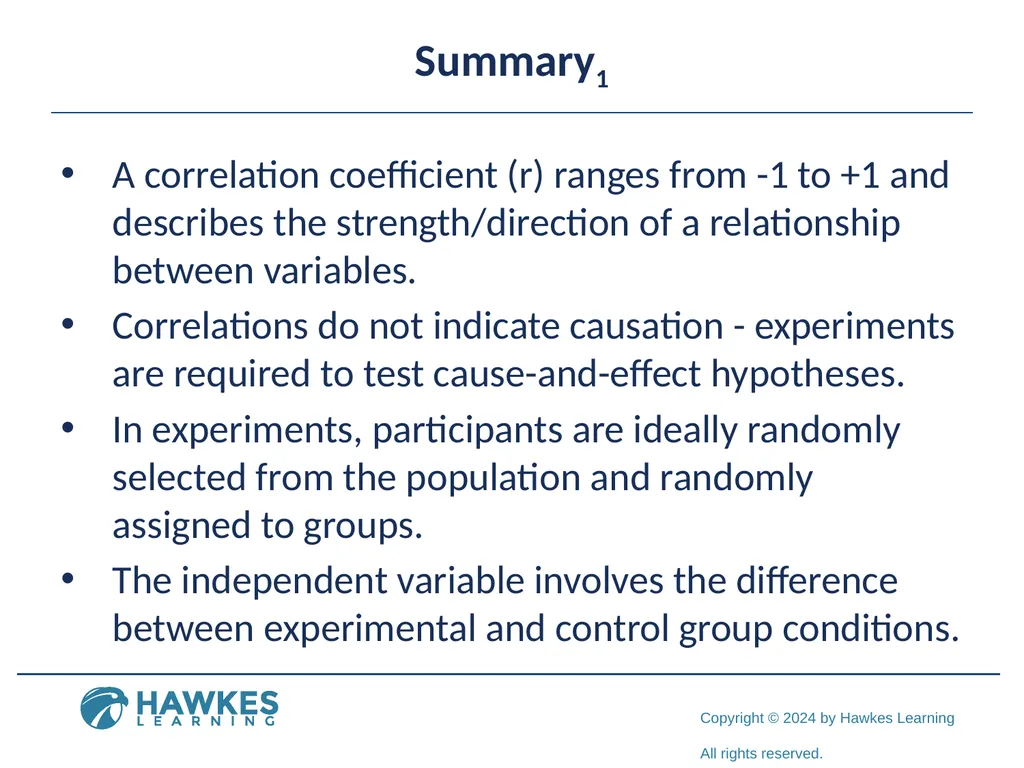
Summary1 A correlation coefficient (r) ranges from -1 to +1 and describes the strength/direction of a relationship between variables.
Correlations do not indicate causation - experiments are required to test cause-and-effect hypotheses.
In experiments, participants are ideally randomly selected from the population and randomly assigned to groups.
The independent variable involves the difference between experimental and control group conditions.<br>
32
End of Hawkes Learning PowerPoint<br>