
Levey-Jennings Charts Graphically Representing



Description: Levey-Jennings Charts Graphically Representing your data Labs for Life Project Quality CONTROL TRAINING Levey-Jennings Chart - History W. Shewhart an American physicist, engineer and statisticianin 1931 proposed applying statistical based
Related Topics
Download Presentation
"Levey-Jennings Charts Graphically Representing" is the property of its rightful owner. Permission is granted to download and print the materials on this website for personal, non-commercial use only, and to display it on your personal computer provided you do not modify the materials and that you retain all copyright notices contained in the materials. By downloading content from our website, you accept the terms of this agreement.
Presentation Transcript
slide1. Levey-Jennings Charts
Graphically Representing your data
Labs for Life Project Quality CONTROL TRAINING<br>
slide2. Levey-Jennings Chart - History W. Shewhart an American physicist, engineer and statisticianin 1931 proposed applying statistical based control charts to interpret industrial manufacturing processes.
In 1950 , S. Levey and E. R Jennings suggested the use of Shewhart`s control charts in the clinical laboratories. 7/18/2017 QC Training- Labs for Life Project 2<br>
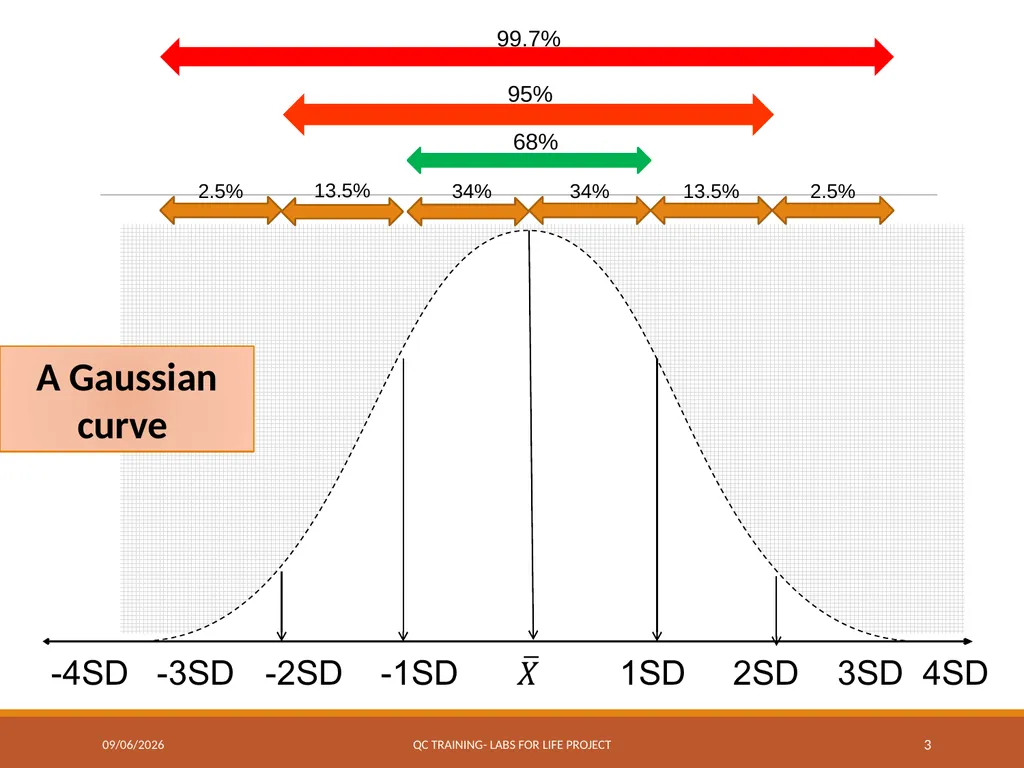
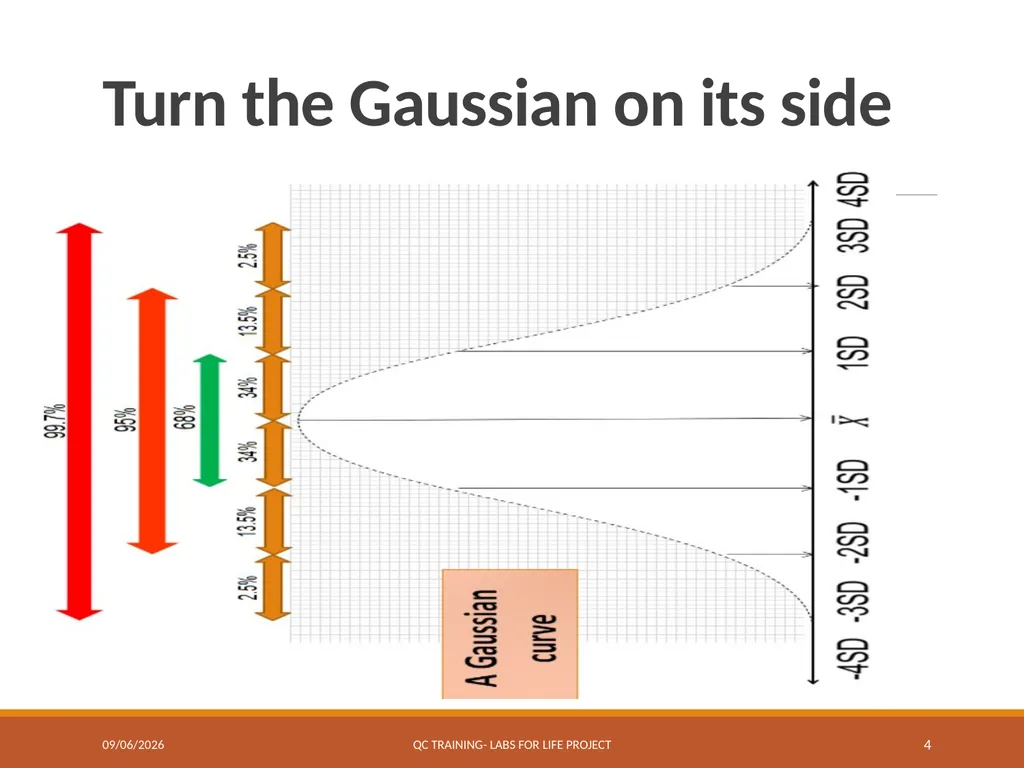
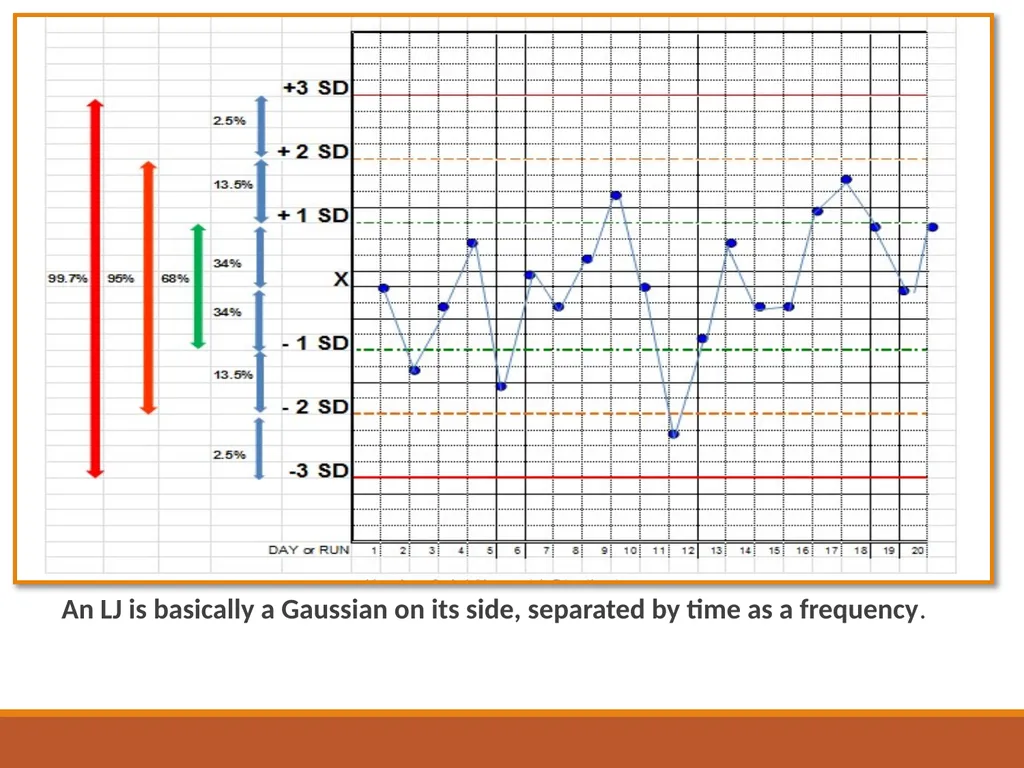
slide3. 68% 95% 99.7% 34% 34% 2.5% 2.5% 13.5% 13.5% A Gaussian curve 7/18/2017 QC Training- Labs for Life Project 3<br>
slide4. Turn the Gaussian on its side 7/18/2017 QC Training- Labs for Life Project 4<br>
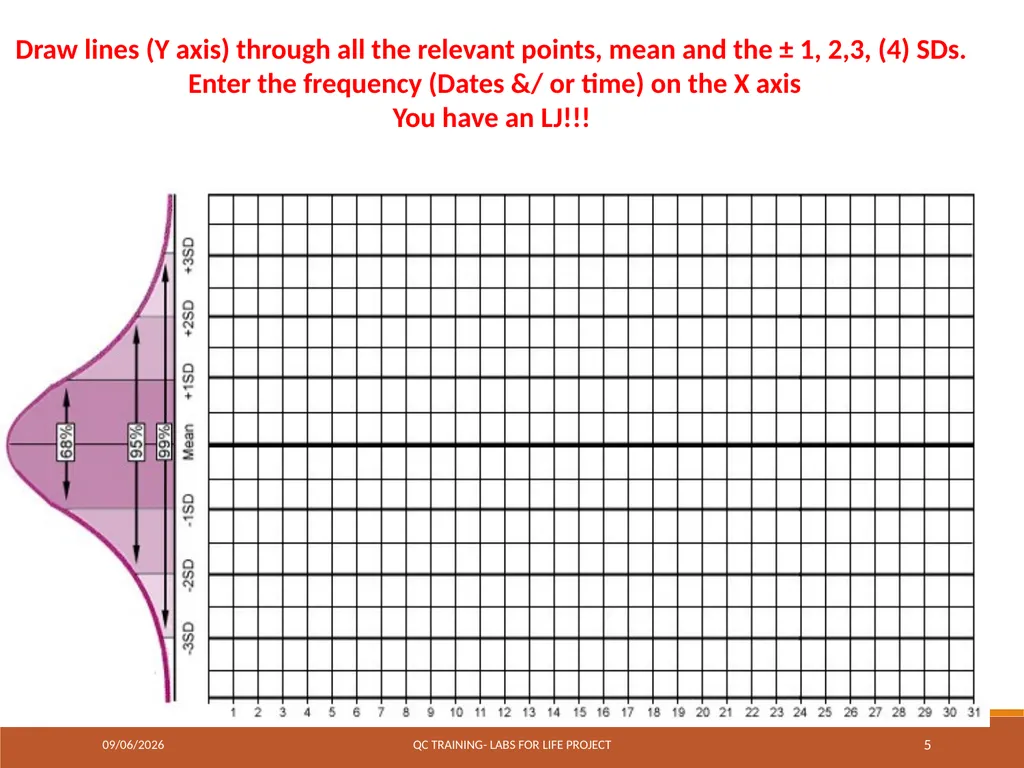
slide5. Draw lines (Y axis) through all the relevant points, mean and the ± 1, 2,3, (4) SDs.
Enter the frequency (Dates &/ or time) on the X axis
You have an LJ!!! 7/18/2017 QC Training- Labs for Life Project 5<br>
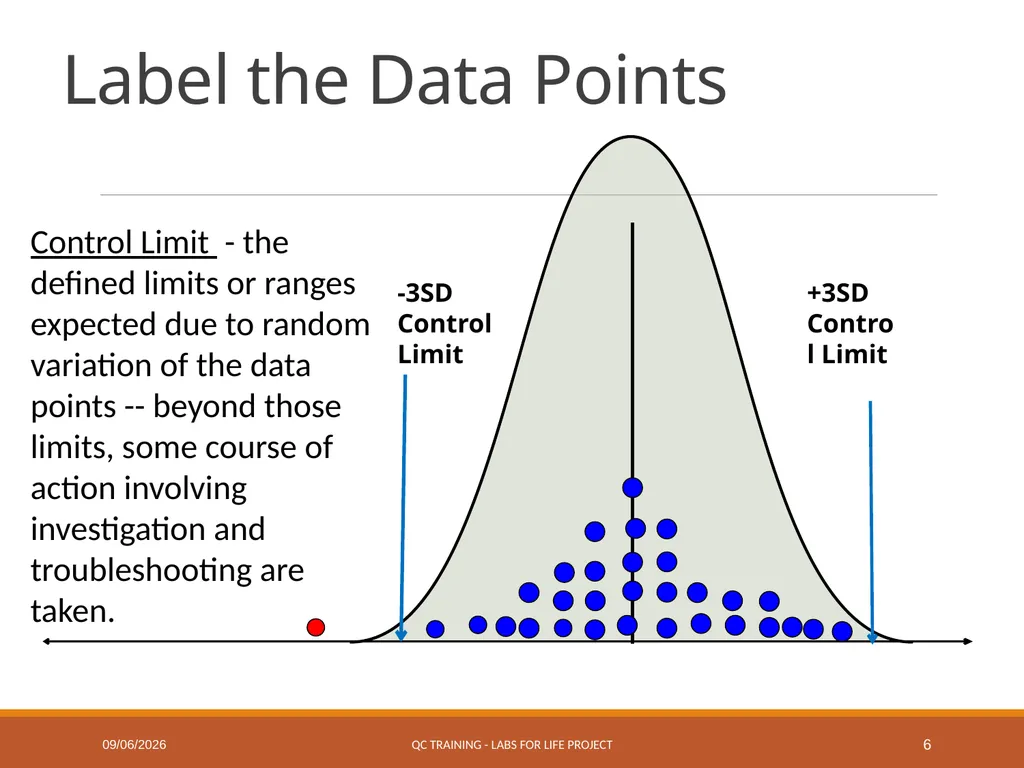
slide6. Label the Data Points -3SD Control Limit +3SD Control Limit Control Limit - the defined limits or ranges expected due to random variation of the data points -- beyond those limits, some course of action involving investigation and troubleshooting are taken. 7/18/2017 QC Training - Labs for Life Project 6<br>
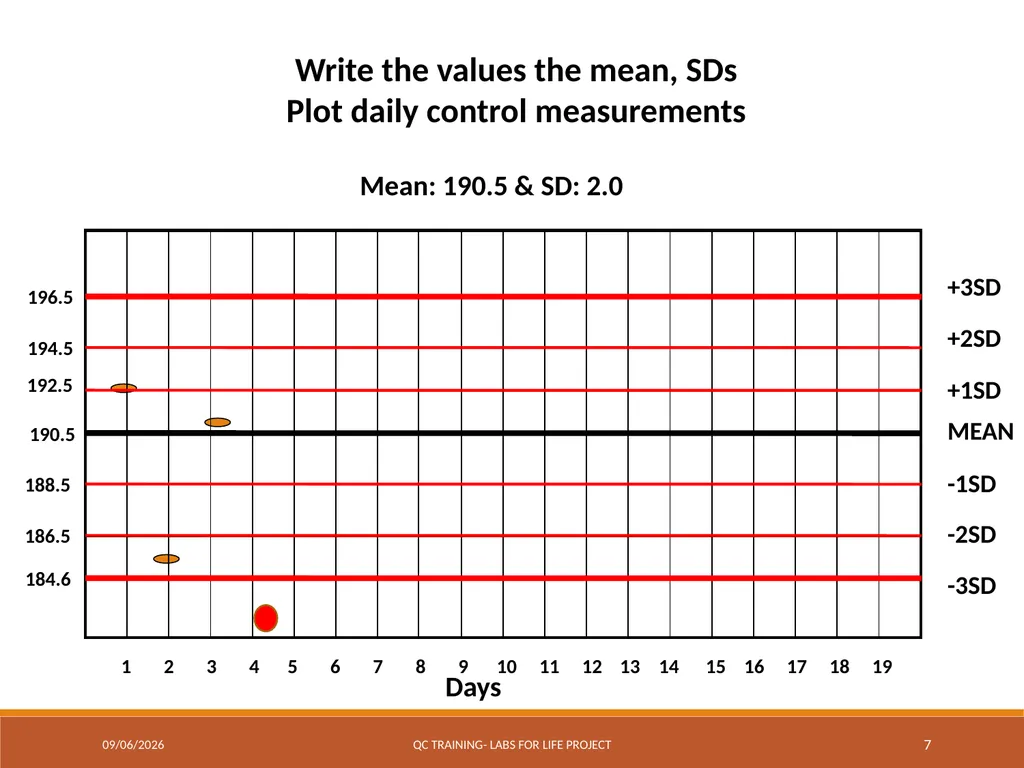
slide7. 7 MEAN +1SD +2SD -1SD -2SD -3SD +3SD Days 192.5 194.5 196.5 188.5 186.5 184.6 1 2 3 4 5 6 7 8 9 10 11 12 13 14 15 16 17 18 19 190.5 Write the values the mean, SDs
Plot daily control measurements Mean: 190.5 & SD: 2.0 7/18/2017 QC Training- Labs for Life Project<br>
slide8. An LJ is basically a Gaussian on its side, separated by time as a frequency.<br>
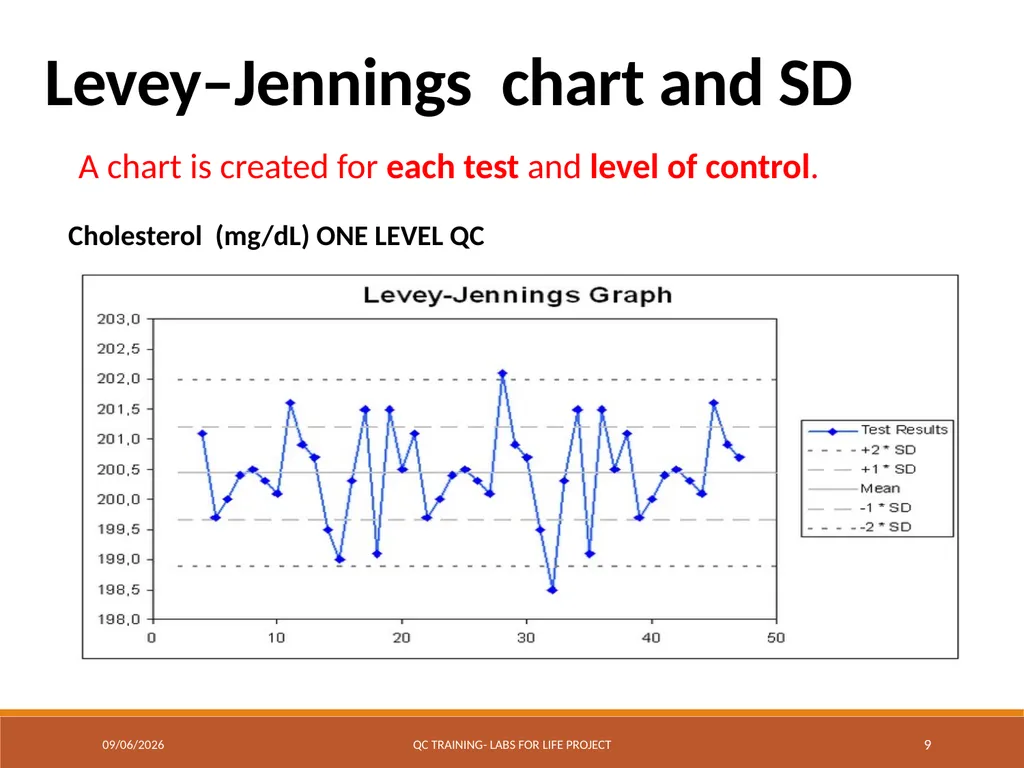
slide9. 9 Levey–Jennings chart and SD A chart is created for each test and level of control.
Cholesterol (mg/dL) ONE LEVEL QC 7/18/2017 QC Training- Labs for Life Project<br>
slide10. Levey–Jennings (LJ) chart A graphical method for displaying control results and evaluating whether a procedure is in-control or out-of-control
Daily control values are plotted versus time
Lines are drawn from point to point to understand any trends, shifts, or random variations 10<br>
slide11. The first step is to calculate decision limits.
Standard deviation is commonly used to set the limits
These limits are ±1SD, ±2SD and ±3SD from the mean.
A chart is created for each test and level of control. Levey–Jennings chart and SD 11<br>
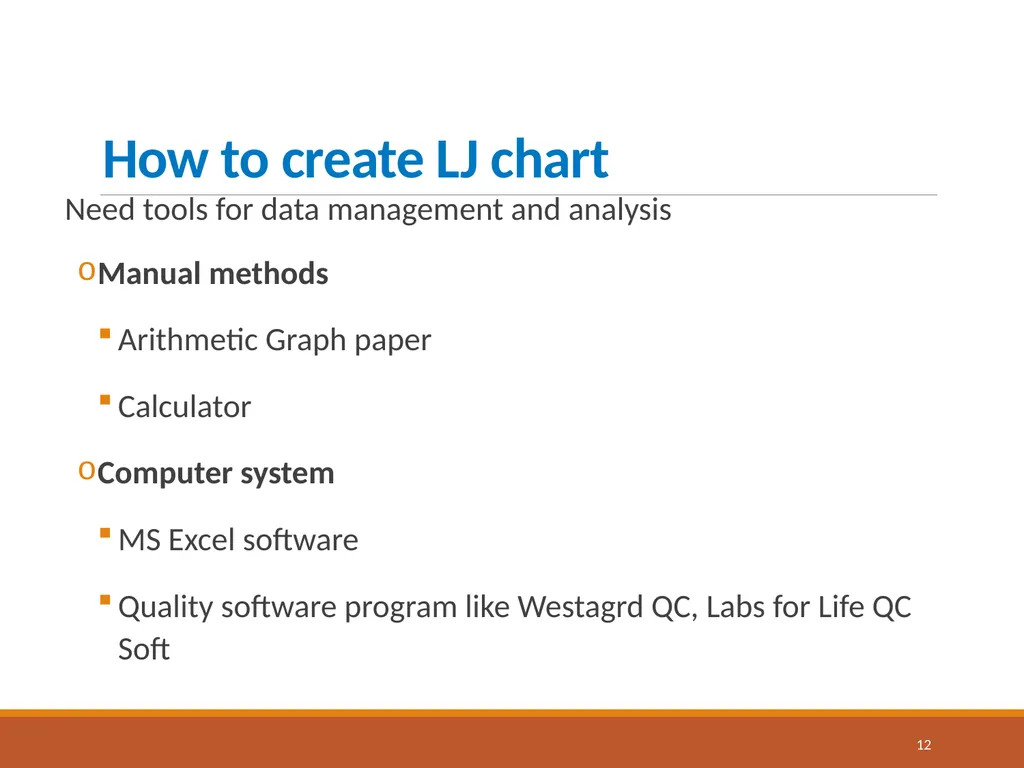
slide12. How to create LJ chart Need tools for data management and analysis
Manual methods
Arithmetic Graph paper
Calculator
Computer system
MS Excel software
Quality software program like Westagrd QC, Labs for Life QC Soft 12<br>
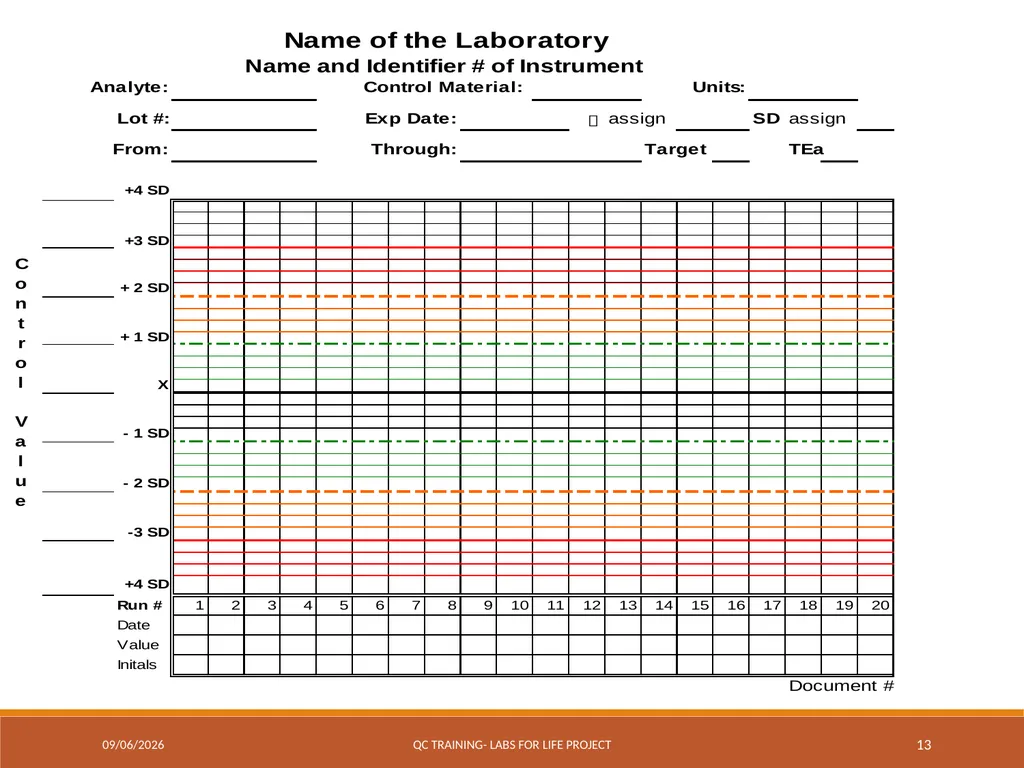
slide13. 7/18/2017 QC Training- Labs for Life Project 13<br>
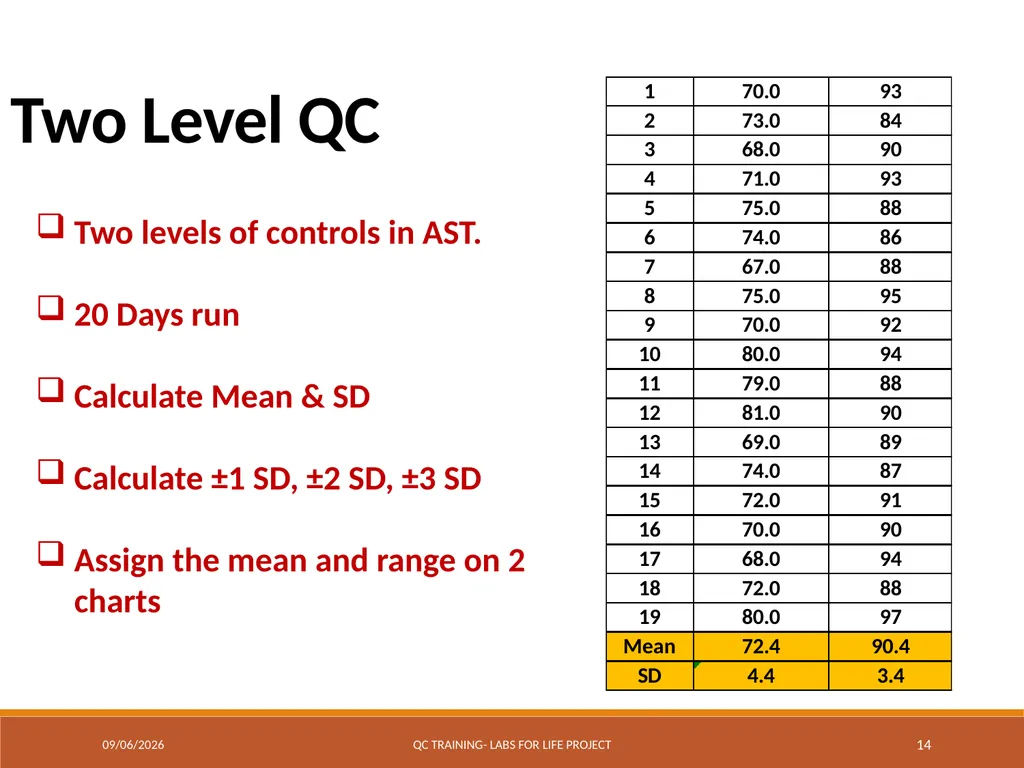
slide14. 7/18/2017 QC Training- Labs for Life Project 14 Two Level QC Two levels of controls in AST.
20 Days run
Calculate Mean & SD
Calculate ±1 SD, ±2 SD, ±3 SD
Assign the mean and range on 2 charts<br>
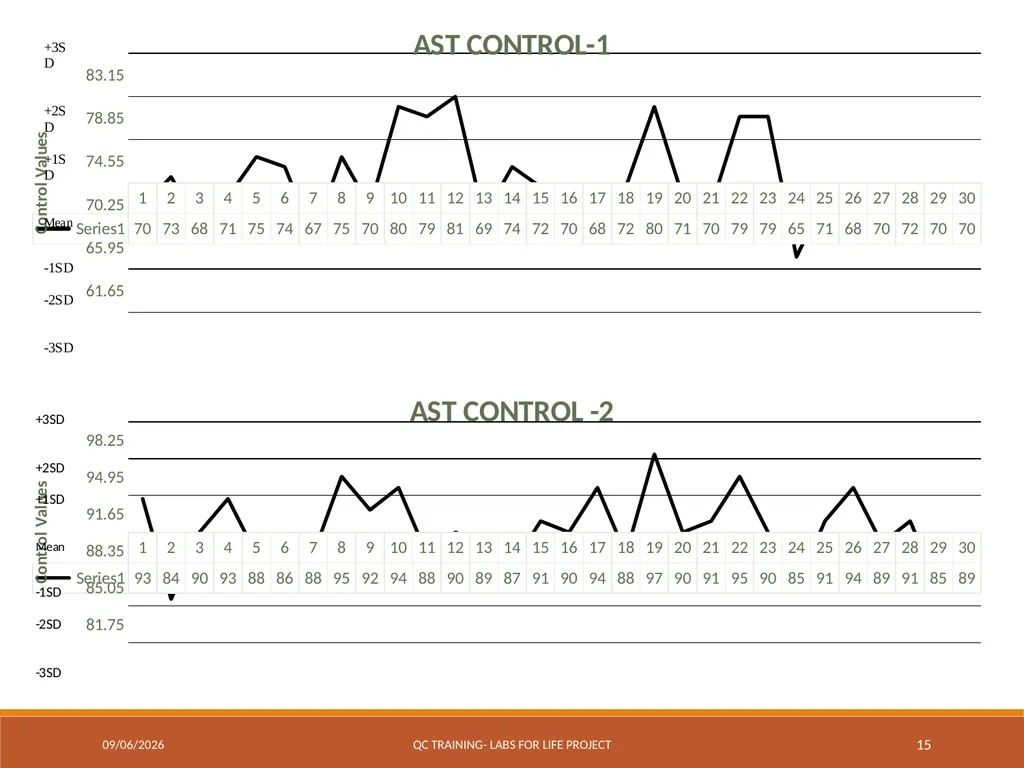
slide15. 7/18/2017 QC Training- Labs for Life Project 15<br>
slide16. Excel Plot LJ-
Glucose Level1 for the month of Nov 2015 from 1st Nov to 20th Nov.
Mean: 100
SD : 5
Data points : 102, 104, 99, 89, 90, 105, 100, 101,105, 104, 101, 88, 94, 104, 101, 106, 100, 94,106, 107. 7/18/2017 QC Training- Labs for Life Project 16<br>
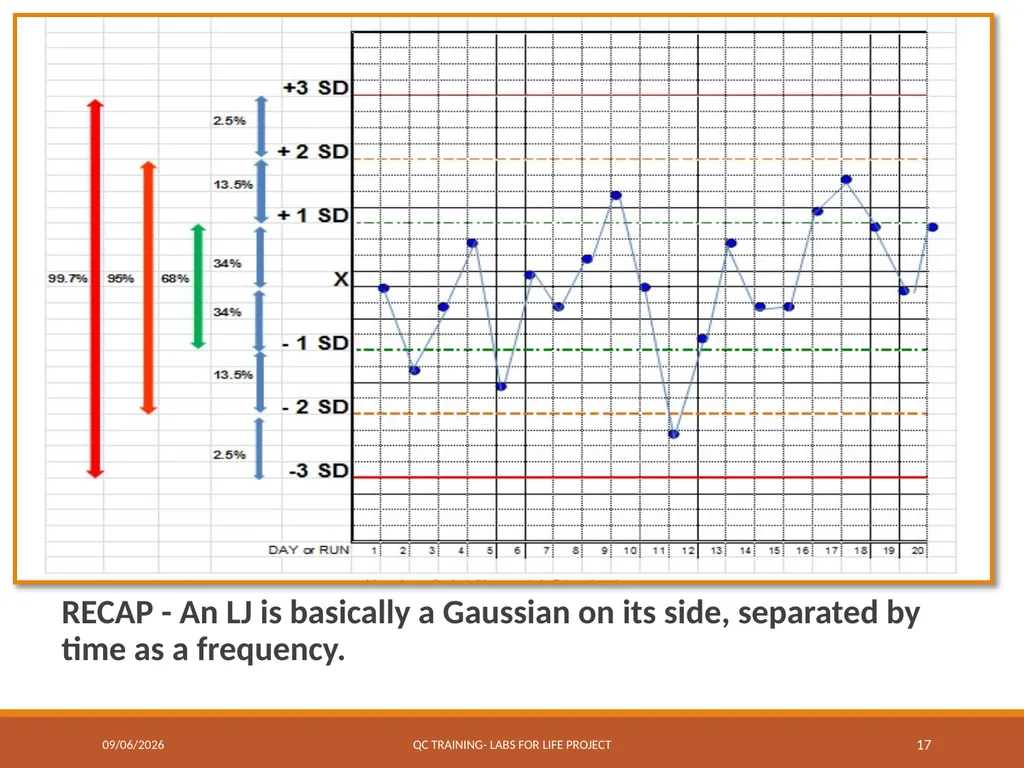
slide17. RECAP - An LJ is basically a Gaussian on its side, separated by time as a frequency. 7/18/2017 QC Training- Labs for Life Project 17<br>
slide18. Train Your Eyes to see, Train the Eyes of Your Staff to see!!!! 7/18/2017 QC Training- Labs for Life Project 18<br>
slide19. 7/18/2017 QC Training- Labs for Life Project 19<br>
slide20. 7/18/2017 QC Training- Labs for Life Project 20<br>
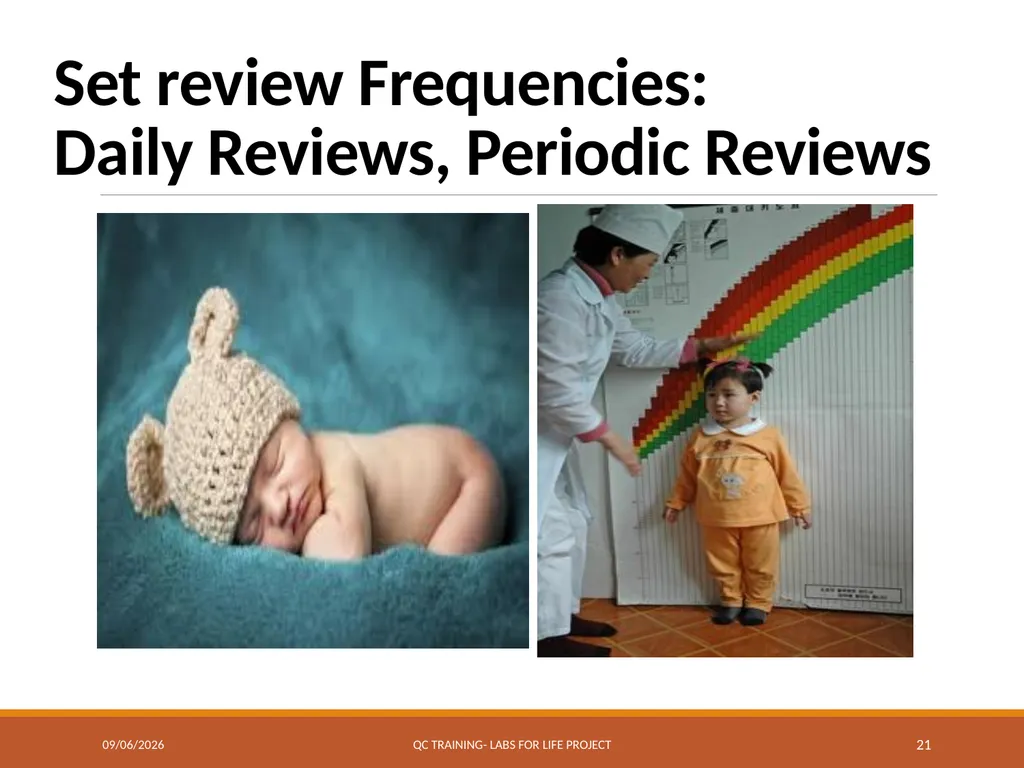
slide21. Set review Frequencies: Daily Reviews, Periodic Reviews 7/18/2017 QC Training- Labs for Life Project 21<br>
slide22. 7/18/2017 QC Training- Labs for Life Project 22 DOCUMENT!!!!! 4 main kinds of documentation audited by NABL are
Values of daily runs
Corrective action proof( evidence for remedial action in the event of QC failures)
LJ charts (Monthly)
CV% tracking for at least 6 months
As we learnt earlier 5.6 of the ISO deals with the assurance of the quality of examinations. Any non-conformance in this area is dealt with as a “Major” non-conformance. Hence documenting your QC related activity is very important<br>
slide23. 7/18/2017 QC Training- Labs for Life Project 23<br>
slide2. Levey-Jennings Chart - History W. Shewhart an American physicist, engineer and statisticianin 1931 proposed applying statistical based control charts to interpret industrial manufacturing processes.
In 1950 , S. Levey and E. R Jennings suggested the use of Shewhart`s control charts in the clinical laboratories. 7/18/2017 QC Training- Labs for Life Project 2<br>
slide3. 68% 95% 99.7% 34% 34% 2.5% 2.5% 13.5% 13.5% A Gaussian curve 7/18/2017 QC Training- Labs for Life Project 3<br>
slide4. Turn the Gaussian on its side 7/18/2017 QC Training- Labs for Life Project 4<br>
slide5. Draw lines (Y axis) through all the relevant points, mean and the ± 1, 2,3, (4) SDs.
Enter the frequency (Dates &/ or time) on the X axis
You have an LJ!!! 7/18/2017 QC Training- Labs for Life Project 5<br>
slide6. Label the Data Points -3SD Control Limit +3SD Control Limit Control Limit - the defined limits or ranges expected due to random variation of the data points -- beyond those limits, some course of action involving investigation and troubleshooting are taken. 7/18/2017 QC Training - Labs for Life Project 6<br>
slide7. 7 MEAN +1SD +2SD -1SD -2SD -3SD +3SD Days 192.5 194.5 196.5 188.5 186.5 184.6 1 2 3 4 5 6 7 8 9 10 11 12 13 14 15 16 17 18 19 190.5 Write the values the mean, SDs
Plot daily control measurements Mean: 190.5 & SD: 2.0 7/18/2017 QC Training- Labs for Life Project<br>
slide8. An LJ is basically a Gaussian on its side, separated by time as a frequency.<br>
slide9. 9 Levey–Jennings chart and SD A chart is created for each test and level of control.
Cholesterol (mg/dL) ONE LEVEL QC 7/18/2017 QC Training- Labs for Life Project<br>
slide10. Levey–Jennings (LJ) chart A graphical method for displaying control results and evaluating whether a procedure is in-control or out-of-control
Daily control values are plotted versus time
Lines are drawn from point to point to understand any trends, shifts, or random variations 10<br>
slide11. The first step is to calculate decision limits.
Standard deviation is commonly used to set the limits
These limits are ±1SD, ±2SD and ±3SD from the mean.
A chart is created for each test and level of control. Levey–Jennings chart and SD 11<br>
slide12. How to create LJ chart Need tools for data management and analysis
Manual methods
Arithmetic Graph paper
Calculator
Computer system
MS Excel software
Quality software program like Westagrd QC, Labs for Life QC Soft 12<br>
slide13. 7/18/2017 QC Training- Labs for Life Project 13<br>
slide14. 7/18/2017 QC Training- Labs for Life Project 14 Two Level QC Two levels of controls in AST.
20 Days run
Calculate Mean & SD
Calculate ±1 SD, ±2 SD, ±3 SD
Assign the mean and range on 2 charts<br>
slide15. 7/18/2017 QC Training- Labs for Life Project 15<br>
slide16. Excel Plot LJ-
Glucose Level1 for the month of Nov 2015 from 1st Nov to 20th Nov.
Mean: 100
SD : 5
Data points : 102, 104, 99, 89, 90, 105, 100, 101,105, 104, 101, 88, 94, 104, 101, 106, 100, 94,106, 107. 7/18/2017 QC Training- Labs for Life Project 16<br>
slide17. RECAP - An LJ is basically a Gaussian on its side, separated by time as a frequency. 7/18/2017 QC Training- Labs for Life Project 17<br>
slide18. Train Your Eyes to see, Train the Eyes of Your Staff to see!!!! 7/18/2017 QC Training- Labs for Life Project 18<br>
slide19. 7/18/2017 QC Training- Labs for Life Project 19<br>
slide20. 7/18/2017 QC Training- Labs for Life Project 20<br>
slide21. Set review Frequencies: Daily Reviews, Periodic Reviews 7/18/2017 QC Training- Labs for Life Project 21<br>
slide22. 7/18/2017 QC Training- Labs for Life Project 22 DOCUMENT!!!!! 4 main kinds of documentation audited by NABL are
Values of daily runs
Corrective action proof( evidence for remedial action in the event of QC failures)
LJ charts (Monthly)
CV% tracking for at least 6 months
As we learnt earlier 5.6 of the ISO deals with the assurance of the quality of examinations. Any non-conformance in this area is dealt with as a “Major” non-conformance. Hence documenting your QC related activity is very important<br>
slide23. 7/18/2017 QC Training- Labs for Life Project 23<br>