Life Table, Reproductive Rate, Reproductive Values
Description: Life Table, Reproductive Rate, Reproductive Values Dr Mohammed Shoeb Assistant Professor Department of Zoology Govt. Dr WW Patankar Girls PG College, Durg Introduction A life table is a demographic tool used to analyze death rates and
Related Topics
Download Presentation
"Life Table, Reproductive Rate, Reproductive Values" is the property of its rightful owner. Permission is granted to download and print the materials on this website for personal, non-commercial use only, and to display it on your personal computer provided you do not modify the materials and that you retain all copyright notices contained in the materials. By downloading content from our website, you accept the terms of this agreement.
Presentation Transcript
slide1. Life Table, Reproductive Rate, Reproductive ValuesDr Mohammed ShoebAssistant ProfessorDepartment of ZoologyGovt. Dr WW Patankar Girl’s PG College, Durg<br>
slide2. Introduction A life table is a demographic tool used to analyze death rates and calculate life expectancies at various ages.
Life Table summarizes the probability of death and survival for a population over time.
Life expectancy, usually reported at birth assess the probability of how long a person will live.
Life expectancy is calculated using life table.<br>
slide3. A life table is a table which shows, for a person at each age, what the probability is that they die before their next birthday.
From this starting point, a number of statistics can be derived :
The probability of surviving any particular year of age
The remaining life expectancy for people at different ages
The proportion of the original birth cohort still alive.
Life tables are usually constructed separately for men and for women because of their substantially different mortality rates.
There are two types of Life tables: Period life table and Cohort life table<br>
slide4. Period Life Table The Period life table show the current probability of death (for people of different ages, in the current year)
The period life table represents mortality rates during a specific time period for a certain population.
It is also known as static life table.
In static life tables, individuals are assumed to be a stationary population with overlapping generations.<br>
slide5. Cohort Life Table Cohort life tables show the probability of death of people from a given cohort (especially birth year) over the course of their lifetime.
A cohort life table is also known as a generation life table.
It will display the overall mortality rates of a specific population’s entire lifetime.
Within the cohort life table, it is required that an individual must be born within a specific time period.
The table will demonstrate the probability of death of the people within a certain cohort – usually birth year – over their lifetime.<br>
slide6. Applications of Life Table The life table is a widely-used statistical table in demographic, social and health studies.
Life tables have many applications, including:
Calculating life expectancy: Life tables can be used to calculate life expectancy, which is a common way to measure the health of a population.
Predicting population growth: Life tables can help predict how a population will grow or decline in the future.<br>
slide7. Managing endangered species: Ecologists can use life tables to help manage populations of endangered species.
Comparing countries: Life expectancy can be used to compare the health of different countries.<br>
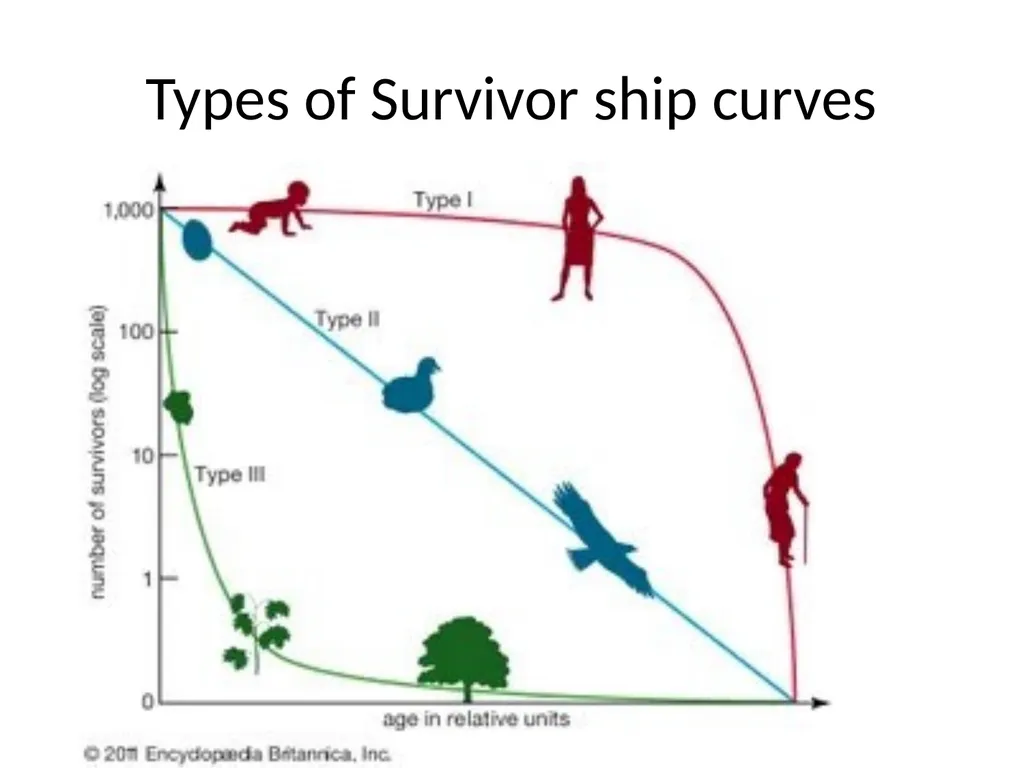
slide8. Survivorship Curve Survivorship curve, graphic representation of the number of individuals in a population that can be expected to survive to any specific age.
There are three general types of curves.
The Type I curve, illustrated by the large mammals, tracks organisms that tend to live long lives (low death rate and high survivorship rate); toward the end of their life expectancies, however, there is a dramatic increase in the death rate.
The Type III curve, characteristic of small mammals, fishes, and invertebrates, is the opposite: it describes organisms with a high death rate (or low survivorship rate) immediately following birth.
In contrast, the Type II curve considers birds, mice, and other organisms characterized by a relatively constant mortality or survivorship rate throughout their life expectancies.<br>
slide9. Types of Survivor ship curves<br>
slide10. From the above curve we can see that
Type I organisms have high survivorship throughout life until old age sets in, and then survivorship declines dramatically to 0.
Type II organisms have steadily decreasing survivorship with age.
Type III organisms, in contrast, have very low survivorship early in life, and few individuals live to old age.<br>
slide11. Reproduction of the population The reproduction of the population refers to a change of a generation into a new one.
Reproduction is measured by gross reproduction rates or net reproduction rates that generally indicate the ratio between the sizes of the daughter's and mother's generations.<br>
slide12. Gross Reproductive Rate does not take into account the fertility and mortality of the mother's generation before the end of the childbearing age.
The fertility and mortality of the mother's generation before the end of the childbearing age is taken into account in the calculation of the Net reproduction rate.<br>
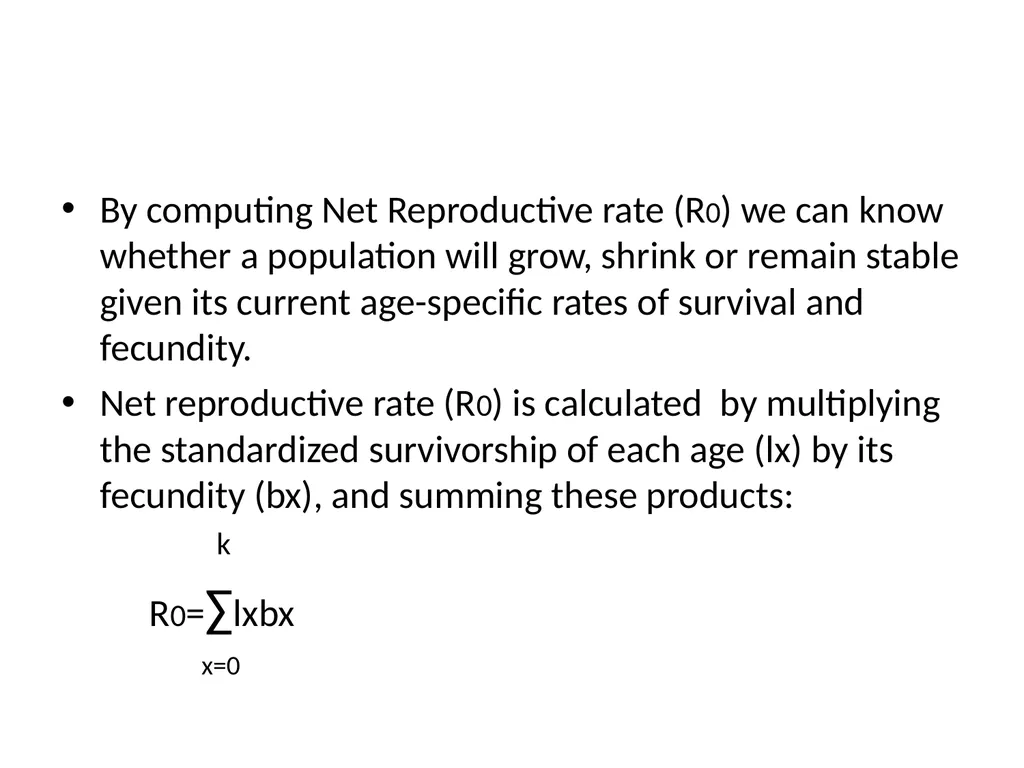
slide13. By computing Net Reproductive rate (R0) we can know whether a population will grow, shrink or remain stable given its current age-specific rates of survival and fecundity.
Net reproductive rate (R0) is calculated by multiplying the standardized survivorship of each age (lx) by its fecundity (bx), and summing these products:
k
R0=∑lxbx x=0<br>
slide14. The net reproductive rate R0 is the lifetime reproductive potential of the average female, adjusted for survival.
Assuming survival and fertility schedules remain constant over time, if R0 > 1, then the population will grow exponentially.
If R0 <1, the population will shrink exponentially, and if R0 =1, the population size will not change over time.<br>
slide15. The net reproductive rate R0 measures population change in terms of generation time.
To predict long-term changes in population size, we must use this net reproductive rate to estimate the intrinsic rate of population increase (r).
r measures population change in absolute units of time (e.g., years).<br>
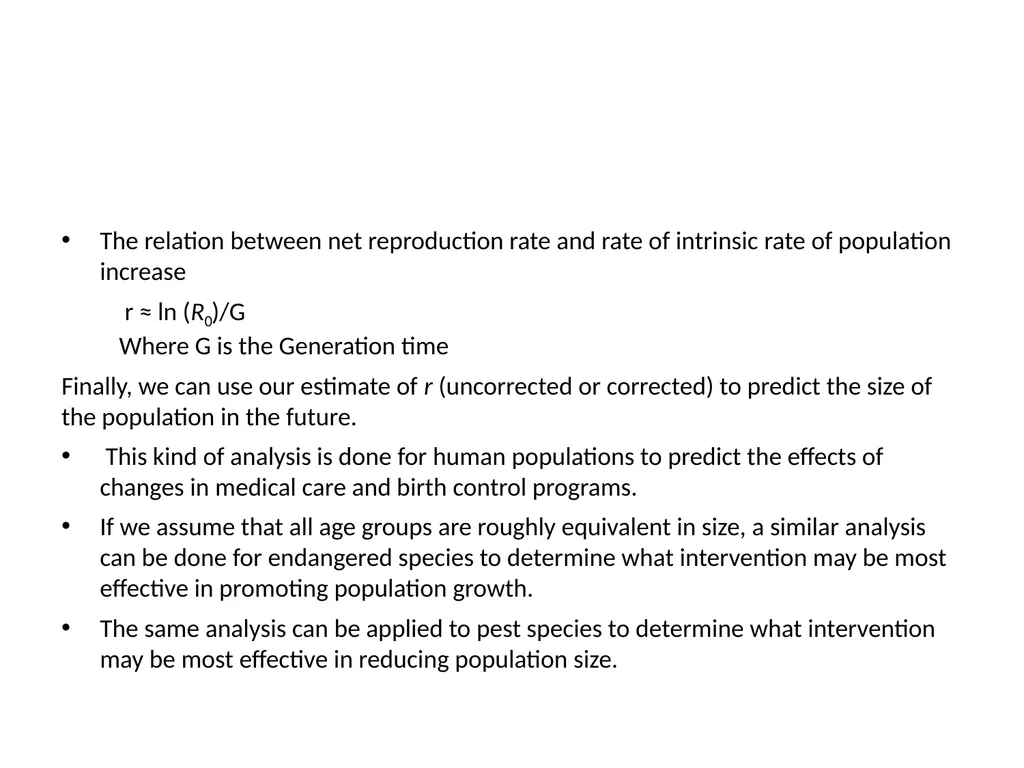
slide16. The relation between net reproduction rate and rate of intrinsic rate of population increase
r ≈ ln (R0)/G Where G is the Generation time
Finally, we can use our estimate of r (uncorrected or corrected) to predict the size of the population in the future.
This kind of analysis is done for human populations to predict the effects of changes in medical care and birth control programs.
If we assume that all age groups are roughly equivalent in size, a similar analysis can be done for endangered species to determine what intervention may be most effective in promoting population growth.
The same analysis can be applied to pest species to determine what intervention may be most effective in reducing population size.<br>
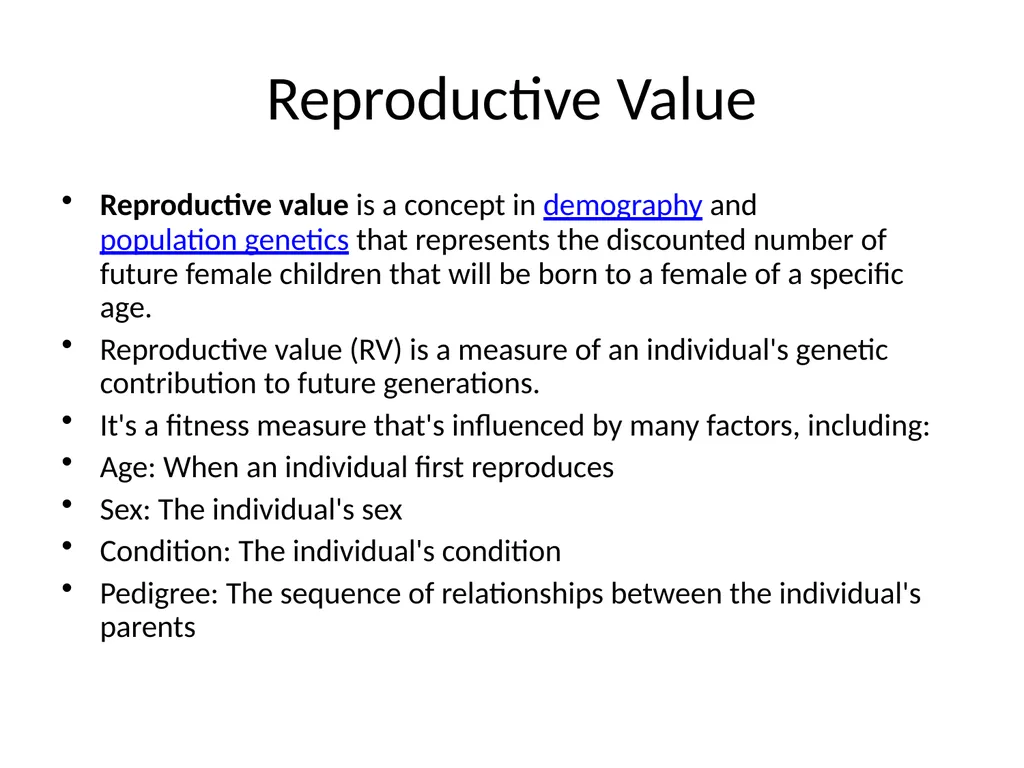
slide17. Reproductive Value Reproductive value is a concept in demography and population genetics that represents the discounted number of future female children that will be born to a female of a specific age.
Reproductive value (RV) is a measure of an individual's genetic contribution to future generations.
It's a fitness measure that's influenced by many factors, including:
Age: When an individual first reproduces
Sex: The individual's sex
Condition: The individual's condition
Pedigree: The sequence of relationships between the individual's parents<br>
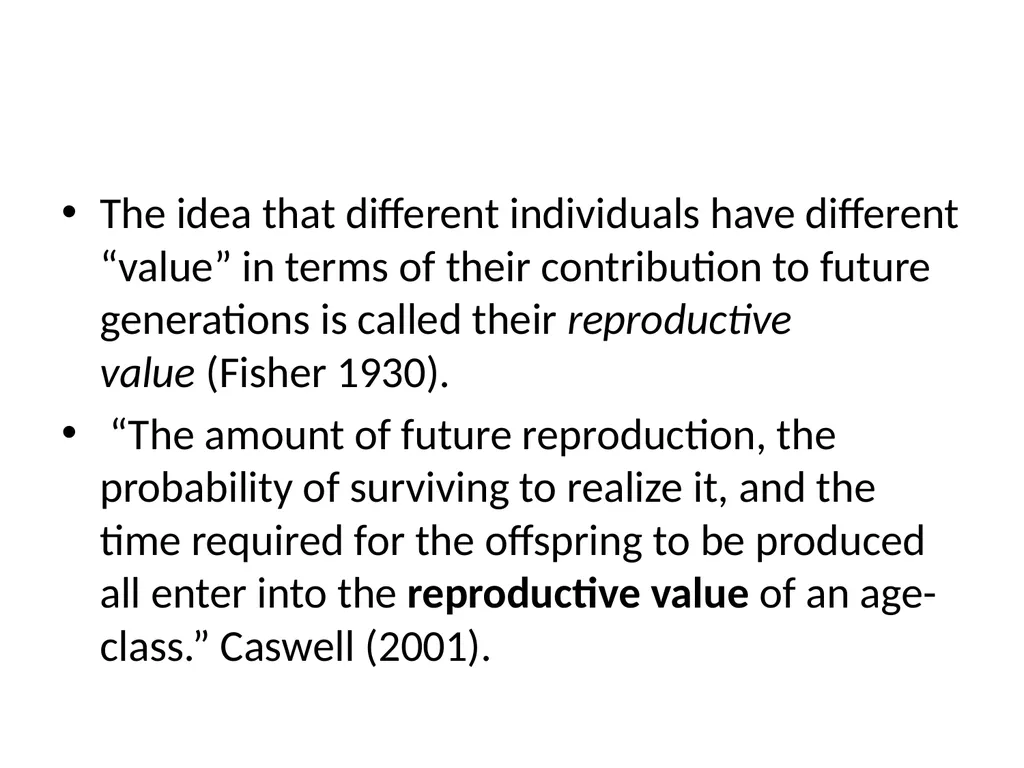
slide18. The idea that different individuals have different “value” in terms of their contribution to future generations is called their reproductive value (Fisher 1930).
“The amount of future reproduction, the probability of surviving to realize it, and the time required for the offspring to be produced all enter into the reproductive value of an age-class.” Caswell (2001).<br>
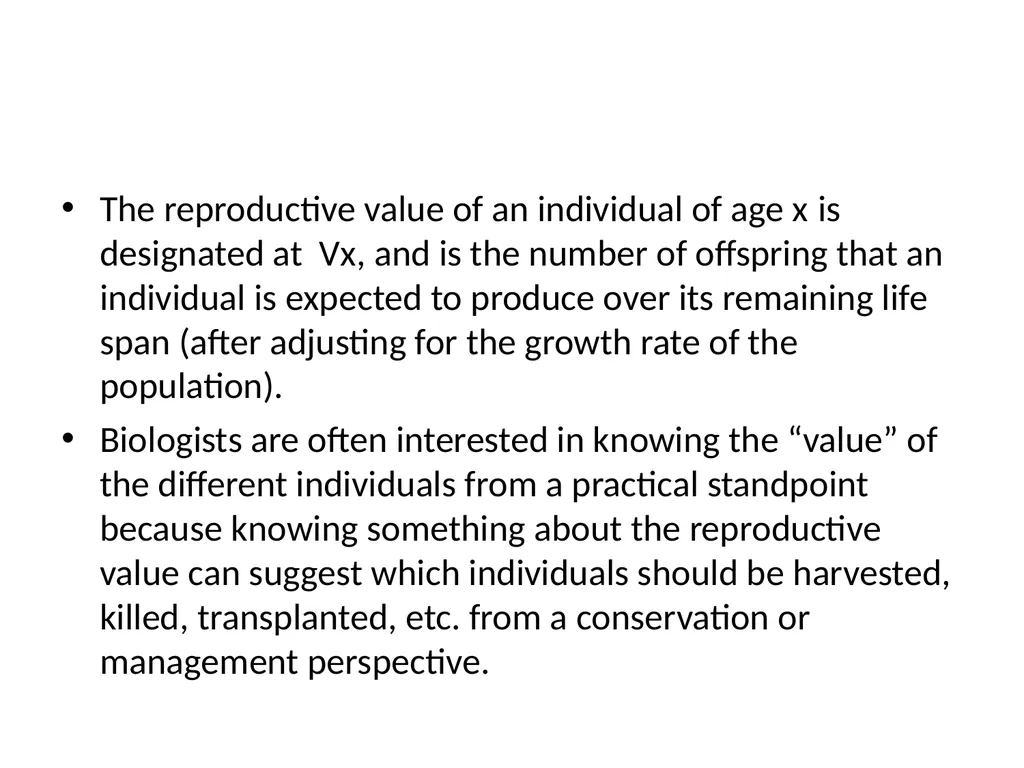
slide19. The reproductive value of an individual of age x is designated at Vx, and is the number of offspring that an individual is expected to produce over its remaining life span (after adjusting for the growth rate of the population).
Biologists are often interested in knowing the “value” of the different individuals from a practical standpoint because knowing something about the reproductive value can suggest which individuals should be harvested, killed, transplanted, etc. from a conservation or management perspective.<br>
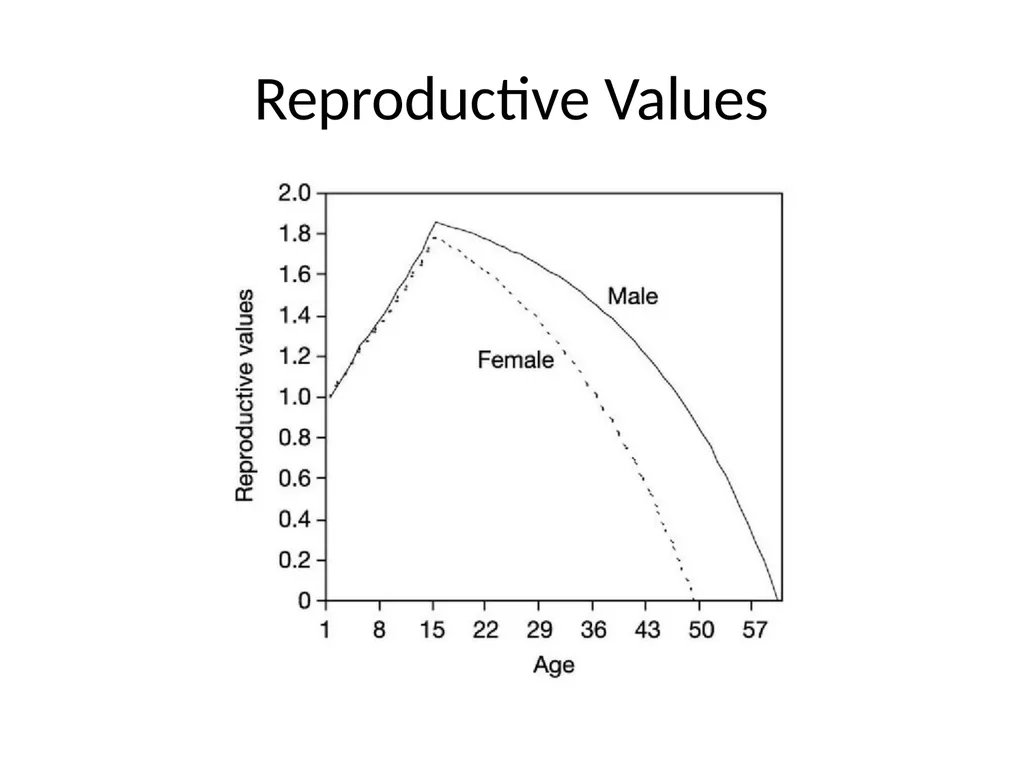
slide20. The reproductive value of different ages is strongly tied to an organism’s life history. Typically, reproductive value is low at birth, increases to a peak near the age of first reproduction, and then declines (Caswell 2001)<br>
slide21. Reproductive Values<br>
slide22. REFERENCES Donovan, T. M. and C. Welden. 2002. Spreadsheet exercises in ecology and evolution. Sinauer Associates, Inc. Sunderland, MA, USA.
Statistics Finland
Ecology and Environment by PD Sharma
eGyankosh<br>

slide2. Introduction A life table is a demographic tool used to analyze death rates and calculate life expectancies at various ages.
Life Table summarizes the probability of death and survival for a population over time.
Life expectancy, usually reported at birth assess the probability of how long a person will live.
Life expectancy is calculated using life table.<br>
slide3. A life table is a table which shows, for a person at each age, what the probability is that they die before their next birthday.
From this starting point, a number of statistics can be derived :
The probability of surviving any particular year of age
The remaining life expectancy for people at different ages
The proportion of the original birth cohort still alive.
Life tables are usually constructed separately for men and for women because of their substantially different mortality rates.
There are two types of Life tables: Period life table and Cohort life table<br>
slide4. Period Life Table The Period life table show the current probability of death (for people of different ages, in the current year)
The period life table represents mortality rates during a specific time period for a certain population.
It is also known as static life table.
In static life tables, individuals are assumed to be a stationary population with overlapping generations.<br>
slide5. Cohort Life Table Cohort life tables show the probability of death of people from a given cohort (especially birth year) over the course of their lifetime.
A cohort life table is also known as a generation life table.
It will display the overall mortality rates of a specific population’s entire lifetime.
Within the cohort life table, it is required that an individual must be born within a specific time period.
The table will demonstrate the probability of death of the people within a certain cohort – usually birth year – over their lifetime.<br>
slide6. Applications of Life Table The life table is a widely-used statistical table in demographic, social and health studies.
Life tables have many applications, including:
Calculating life expectancy: Life tables can be used to calculate life expectancy, which is a common way to measure the health of a population.
Predicting population growth: Life tables can help predict how a population will grow or decline in the future.<br>
slide7. Managing endangered species: Ecologists can use life tables to help manage populations of endangered species.
Comparing countries: Life expectancy can be used to compare the health of different countries.<br>
slide8. Survivorship Curve Survivorship curve, graphic representation of the number of individuals in a population that can be expected to survive to any specific age.
There are three general types of curves.
The Type I curve, illustrated by the large mammals, tracks organisms that tend to live long lives (low death rate and high survivorship rate); toward the end of their life expectancies, however, there is a dramatic increase in the death rate.
The Type III curve, characteristic of small mammals, fishes, and invertebrates, is the opposite: it describes organisms with a high death rate (or low survivorship rate) immediately following birth.
In contrast, the Type II curve considers birds, mice, and other organisms characterized by a relatively constant mortality or survivorship rate throughout their life expectancies.<br>
slide9. Types of Survivor ship curves<br>
slide10. From the above curve we can see that
Type I organisms have high survivorship throughout life until old age sets in, and then survivorship declines dramatically to 0.
Type II organisms have steadily decreasing survivorship with age.
Type III organisms, in contrast, have very low survivorship early in life, and few individuals live to old age.<br>
slide11. Reproduction of the population The reproduction of the population refers to a change of a generation into a new one.
Reproduction is measured by gross reproduction rates or net reproduction rates that generally indicate the ratio between the sizes of the daughter's and mother's generations.<br>
slide12. Gross Reproductive Rate does not take into account the fertility and mortality of the mother's generation before the end of the childbearing age.
The fertility and mortality of the mother's generation before the end of the childbearing age is taken into account in the calculation of the Net reproduction rate.<br>
slide13. By computing Net Reproductive rate (R0) we can know whether a population will grow, shrink or remain stable given its current age-specific rates of survival and fecundity.
Net reproductive rate (R0) is calculated by multiplying the standardized survivorship of each age (lx) by its fecundity (bx), and summing these products:
k
R0=∑lxbx x=0<br>
slide14. The net reproductive rate R0 is the lifetime reproductive potential of the average female, adjusted for survival.
Assuming survival and fertility schedules remain constant over time, if R0 > 1, then the population will grow exponentially.
If R0 <1, the population will shrink exponentially, and if R0 =1, the population size will not change over time.<br>
slide15. The net reproductive rate R0 measures population change in terms of generation time.
To predict long-term changes in population size, we must use this net reproductive rate to estimate the intrinsic rate of population increase (r).
r measures population change in absolute units of time (e.g., years).<br>
slide16. The relation between net reproduction rate and rate of intrinsic rate of population increase
r ≈ ln (R0)/G Where G is the Generation time
Finally, we can use our estimate of r (uncorrected or corrected) to predict the size of the population in the future.
This kind of analysis is done for human populations to predict the effects of changes in medical care and birth control programs.
If we assume that all age groups are roughly equivalent in size, a similar analysis can be done for endangered species to determine what intervention may be most effective in promoting population growth.
The same analysis can be applied to pest species to determine what intervention may be most effective in reducing population size.<br>
slide17. Reproductive Value Reproductive value is a concept in demography and population genetics that represents the discounted number of future female children that will be born to a female of a specific age.
Reproductive value (RV) is a measure of an individual's genetic contribution to future generations.
It's a fitness measure that's influenced by many factors, including:
Age: When an individual first reproduces
Sex: The individual's sex
Condition: The individual's condition
Pedigree: The sequence of relationships between the individual's parents<br>
slide18. The idea that different individuals have different “value” in terms of their contribution to future generations is called their reproductive value (Fisher 1930).
“The amount of future reproduction, the probability of surviving to realize it, and the time required for the offspring to be produced all enter into the reproductive value of an age-class.” Caswell (2001).<br>
slide19. The reproductive value of an individual of age x is designated at Vx, and is the number of offspring that an individual is expected to produce over its remaining life span (after adjusting for the growth rate of the population).
Biologists are often interested in knowing the “value” of the different individuals from a practical standpoint because knowing something about the reproductive value can suggest which individuals should be harvested, killed, transplanted, etc. from a conservation or management perspective.<br>
slide20. The reproductive value of different ages is strongly tied to an organism’s life history. Typically, reproductive value is low at birth, increases to a peak near the age of first reproduction, and then declines (Caswell 2001)<br>
slide21. Reproductive Values<br>
slide22. REFERENCES Donovan, T. M. and C. Welden. 2002. Spreadsheet exercises in ecology and evolution. Sinauer Associates, Inc. Sunderland, MA, USA.
Statistics Finland
Ecology and Environment by PD Sharma
eGyankosh<br>