NORMAL PROBABILITY CURVE CONCEPT, CHARACTERISTICS AND USES Prepared by Dr. Sarmishtha Dutta CONCEPT Normal probability curve is one type of theoretical distribution that is of immense use in Statistics. The normal distribution is a
"NORMAL PROBABILITY CURVE CONCEPT, CHARACTERISTICS" is the property of its rightful owner. Permission is granted to
download and print the materials on this website for personal, non-commercial use only, and to display it
on your personal computer provided you do not modify the materials and that you retain all copyright
notices contained in the materials. By downloading content from our website, you accept the terms of this
agreement.
Presentation Transcript
01
NORMAL PROBABILITY CURVE CONCEPT, CHARACTERISTICS AND USES
Prepared by Dr. Sarmishtha Dutta<br>
02
CONCEPT Normal probability curve is one type of theoretical distribution that is of immense use in Statistics.
The normal distribution is a continuous probability distribution that is symmetrical on both sides of the mean.
It is also called as the normal curve, the Gaussian curve and the Bell – shaped curve or Mesokurtic curve.
It is mainly computed for finding out average strength of the class, average marks and its distribution<br>
03
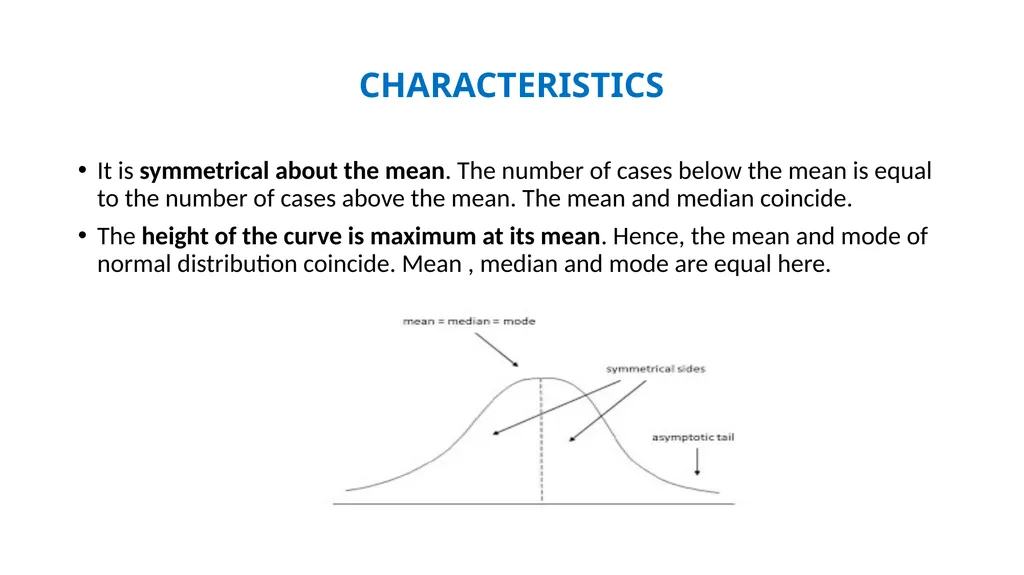
CHARACTERISTICS It is symmetrical about the mean. The number of cases below the mean is equal to the number of cases above the mean. The mean and median coincide.
The height of the curve is maximum at its mean. Hence, the mean and mode of normal distribution coincide. Mean , median and mode are equal here.<br>
04
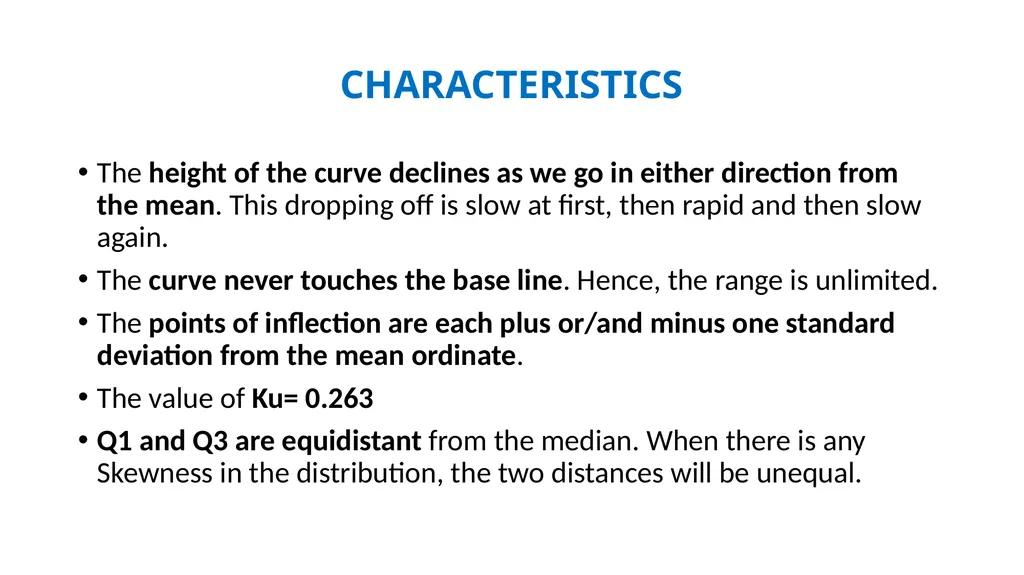
CHARACTERISTICS The height of the curve declines as we go in either direction from the mean. This dropping off is slow at first, then rapid and then slow again.
The curve never touches the base line. Hence, the range is unlimited.
The points of inflection are each plus or/and minus one standard deviation from the mean ordinate.
The value of Ku= 0.263
Q1 and Q3 are equidistant from the median. When there is any Skewness in the distribution, the two distances will be unequal.<br>
05
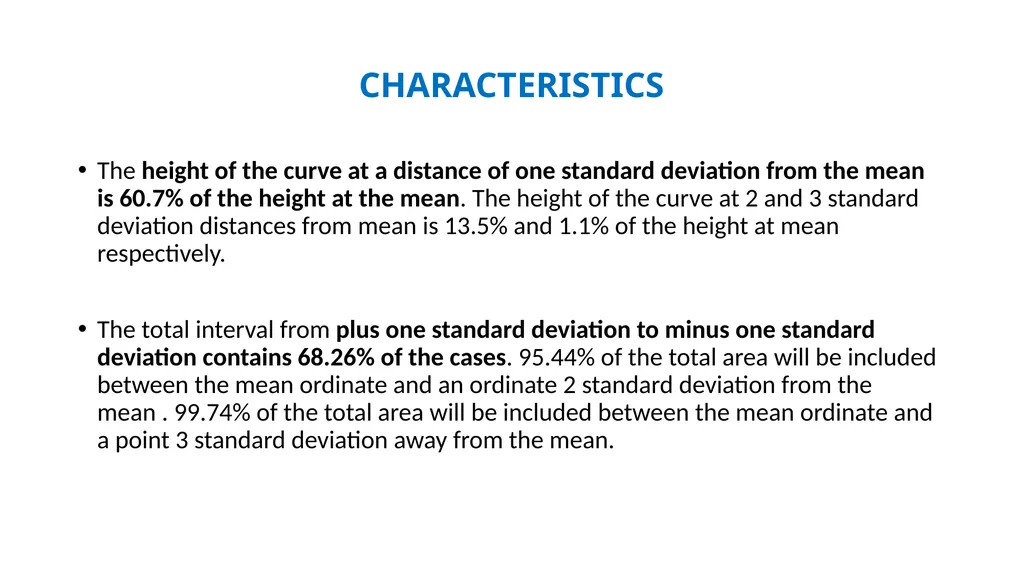
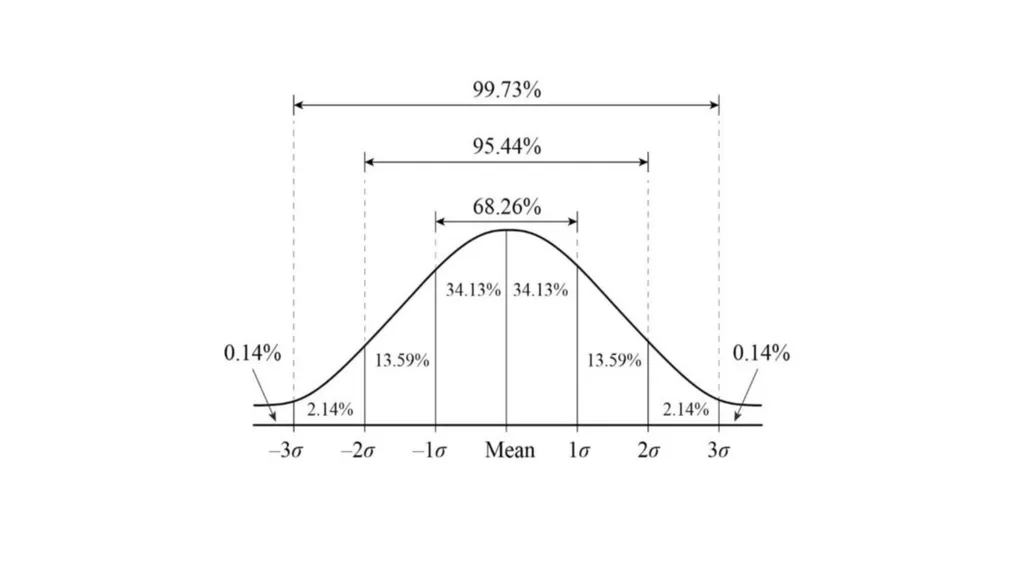
CHARACTERISTICS The height of the curve at a distance of one standard deviation from the mean is 60.7% of the height at the mean. The height of the curve at 2 and 3 standard deviation distances from mean is 13.5% and 1.1% of the height at mean respectively.
The total interval from plus one standard deviation to minus one standard deviation contains 68.26% of the cases. 95.44% of the total area will be included between the mean ordinate and an ordinate 2 standard deviation from the mean . 99.74% of the total area will be included between the mean ordinate and a point 3 standard deviation away from the mean.<br>
06
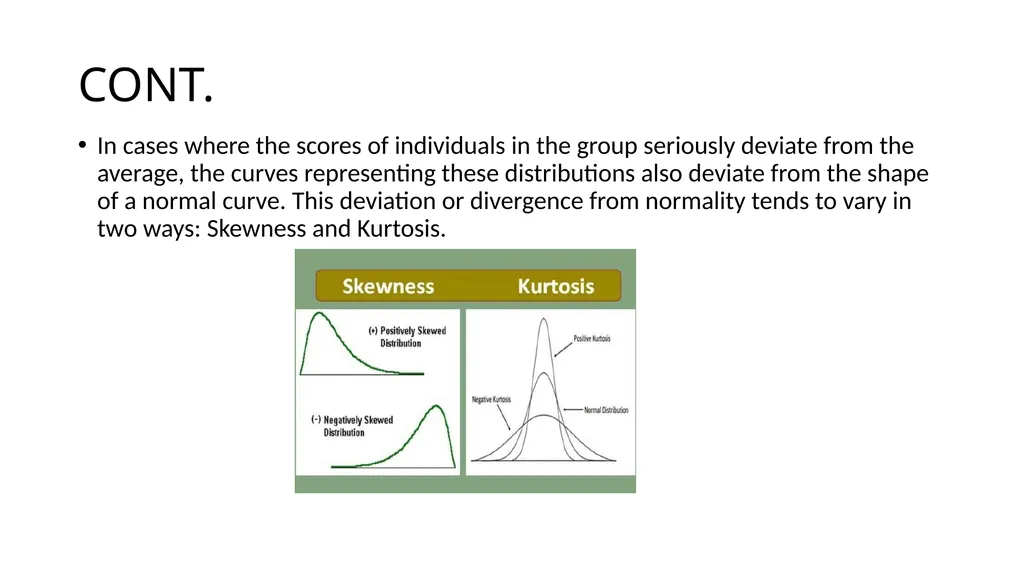
CONT. In cases where the scores of individuals in the group seriously deviate from the average, the curves representing these distributions also deviate from the shape of a normal curve. This deviation or divergence from normality tends to vary in two ways: Skewness and Kurtosis.<br>
07
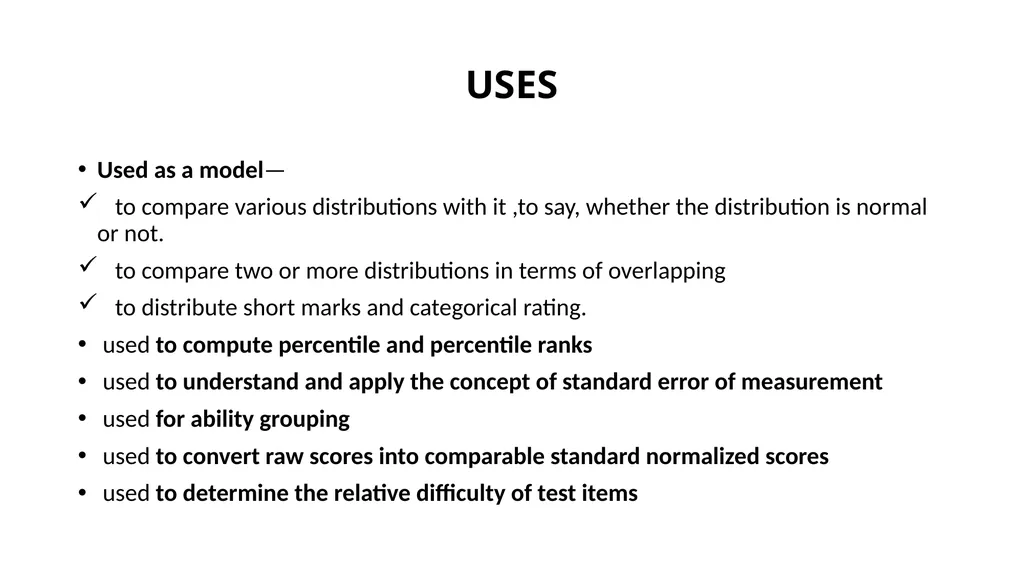
USES Used as a model—
to compare various distributions with it ,to say, whether the distribution is normal or not.
to compare two or more distributions in terms of overlapping
to distribute short marks and categorical rating.
used to compute percentile and percentile ranks
used to understand and apply the concept of standard error of measurement
used for ability grouping
used to convert raw scores into comparable standard normalized scores
used to determine the relative difficulty of test items<br>
08
References Statistics in Psychology and Education– S.K.Mangal
Educational Psychology- Dr. G Das
Monoboigyanik Porimap o Porisankhan- Dr. Arun Ghosh
Mulyayon – Niti o Koushal – Sushil Roy
https://www.simplypsychology.org/normal-distribution.html<br>