One Page Feed Formulation for Poultry Pigs etc. This workbook had its origins in a journal article: Gene M. Pesti, Andrew F. Seila 1999 The Use of an Electronic Spreadsheet to Solve Linear and Non-Linear Stochastic Feed Formulation
"One Page Feed Formulation for Poultry &Pigs etc." is the property of its rightful owner. Permission is granted to
download and print the materials on this website for personal, non-commercial use only, and to display it
on your personal computer provided you do not modify the materials and that you retain all copyright
notices contained in the materials. By downloading content from our website, you accept the terms of this
agreement.
Share
Embed code
Presentation Transcript
01
One Page Feed Formulation for Poultry &Pigs etc. This workbook had its’ origins in a journal article:
Gene M. Pesti, Andrew F. Seila 1999 The Use of an Electronic Spreadsheet to Solve Linear and Non-Linear “Stochastic” Feed Formulation Problems. Journal of Applied Poultry Research 8, 110-121, ISSN 1056-6171
This version was further developed by Gene Pesti at the Poultry Hub Australia<br>
02
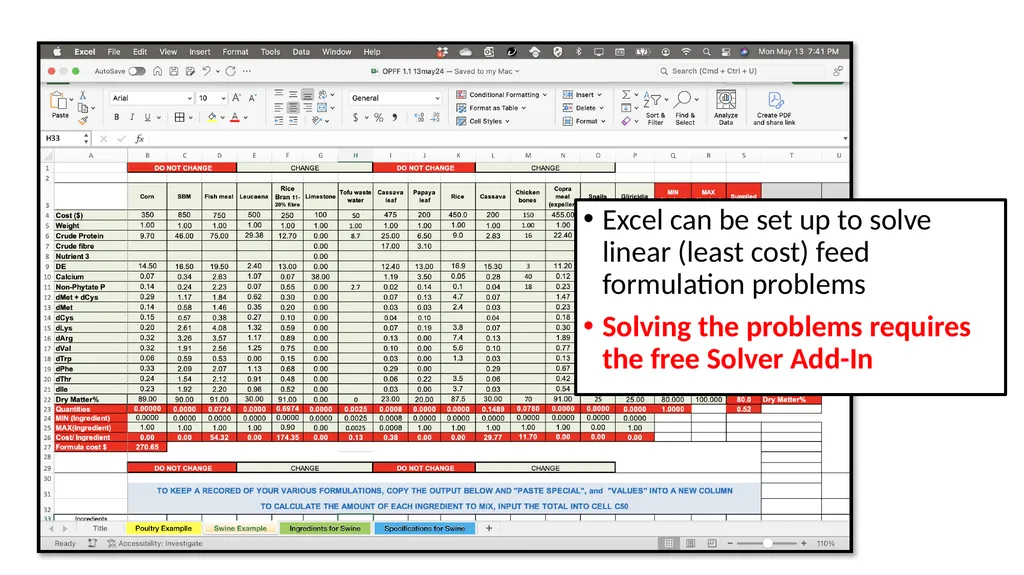
Excel can be set up to solve linear (least cost) feed formulation problems
Solving the problems requires the free Solver Add-In<br>
03
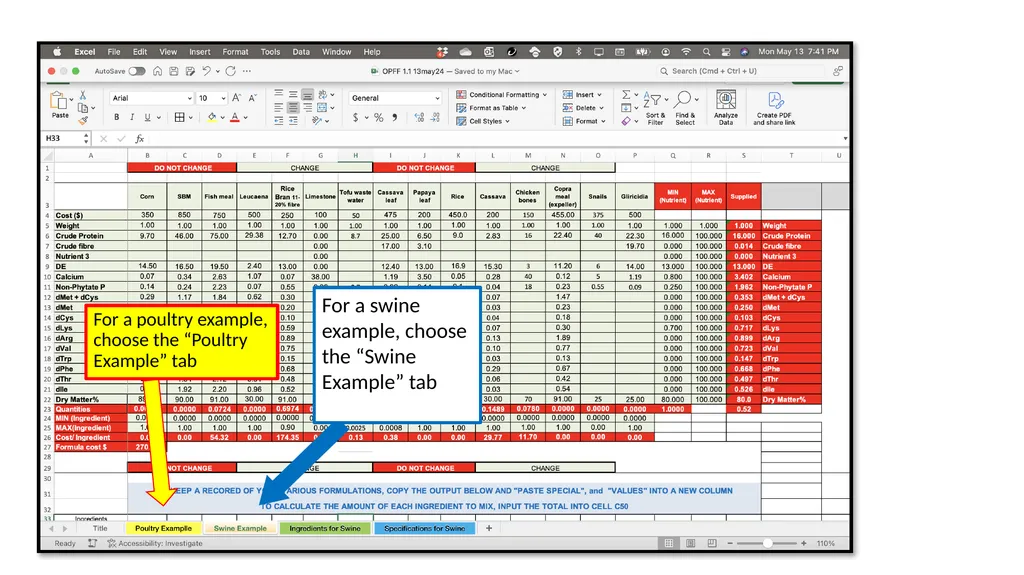
For a swine example, choose the “Swine Example” tab For a poultry example, choose the “Poultry Example” tab<br>
04
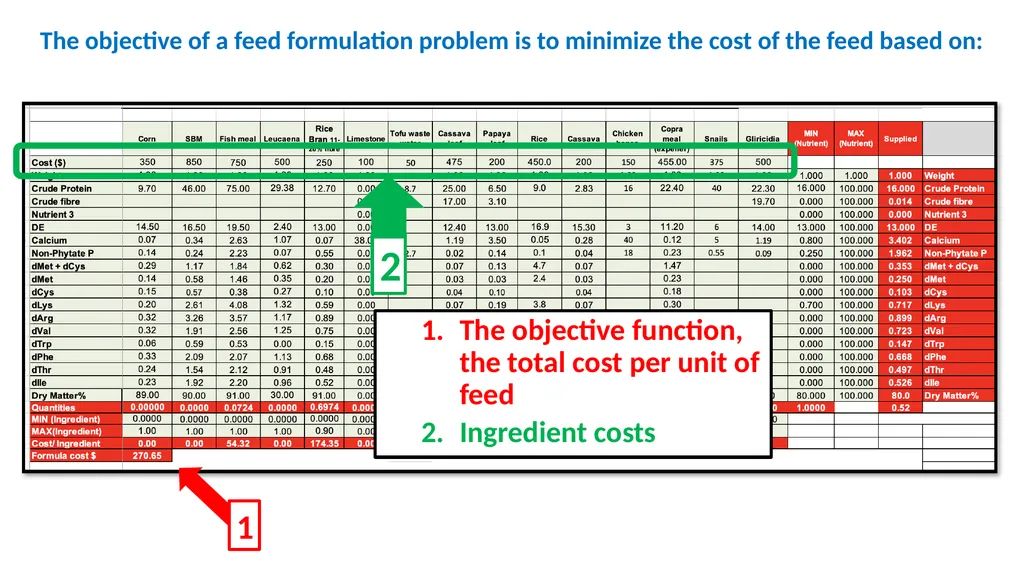
2 The objective function, the total cost per unit of feed
Ingredient costs The objective of a feed formulation problem is to minimize the cost of the feed based on: 1<br>
05
The least cost diet is subject to restrictions in
3) Ingredient composition matrix,
4) the Ingredient limits (Minimum and Maximums)
And 5)the Nutrient limits (Requirements and Maximums) 3 4 5<br>
06
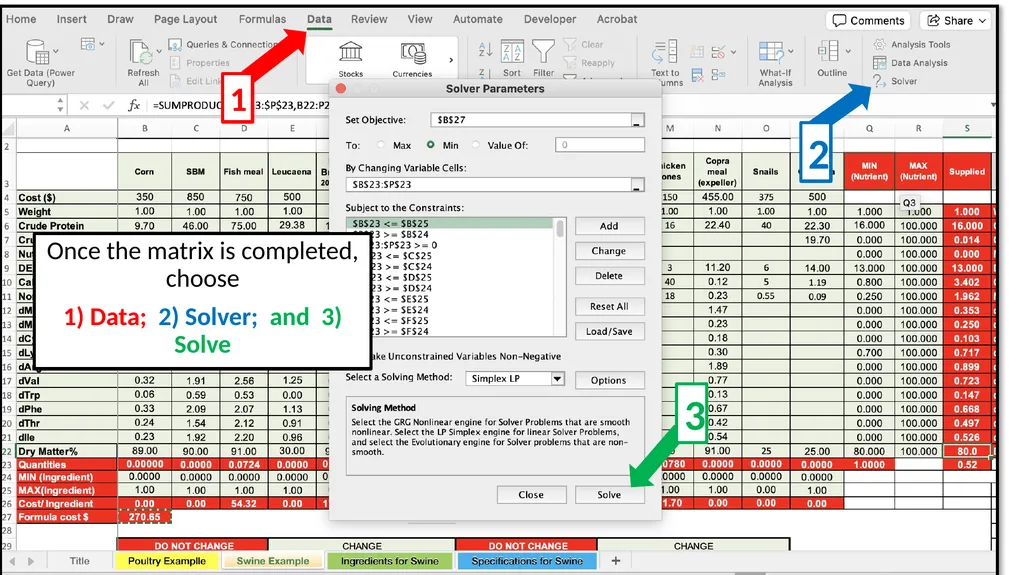
Once the matrix is completed, choose
1) Data; 2) Solver; and 3) Solve 1 2 3<br>
07
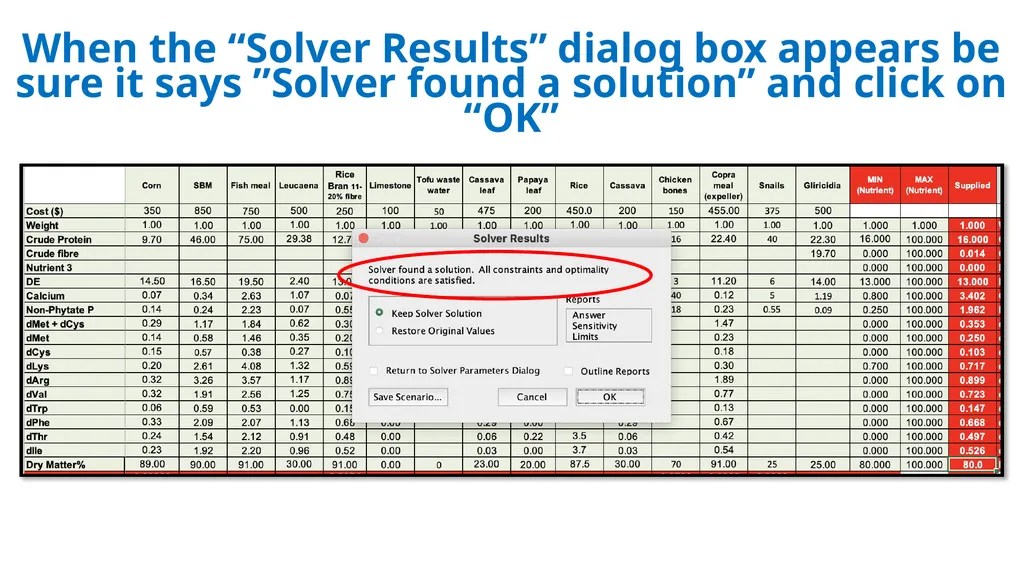
When the “Solver Results” dialog box appears be sure it says ”Solver found a solution” and click on “OK”<br>
08
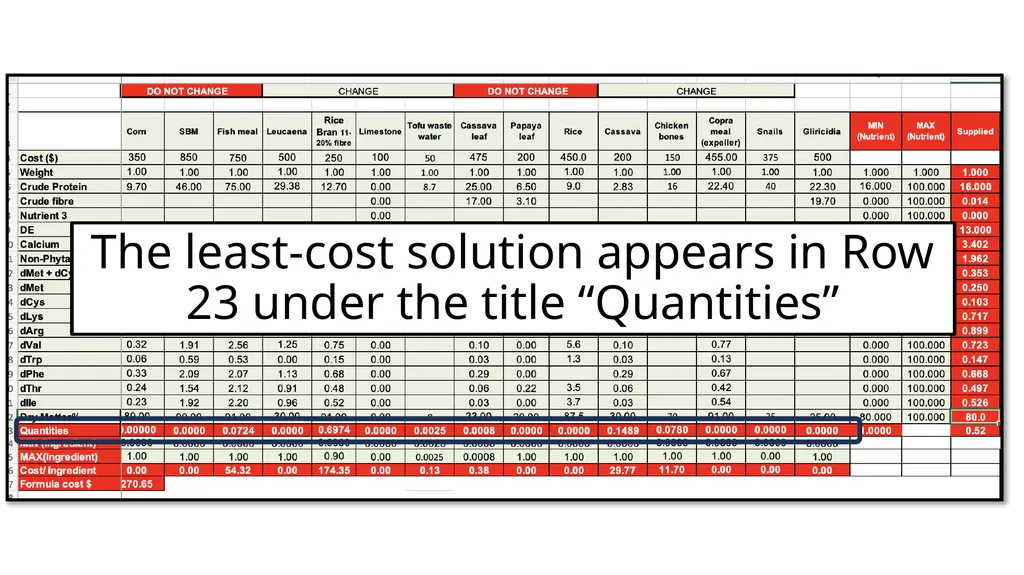
The least-cost solution appears in Row 23 under the title “Quantities”<br>
09
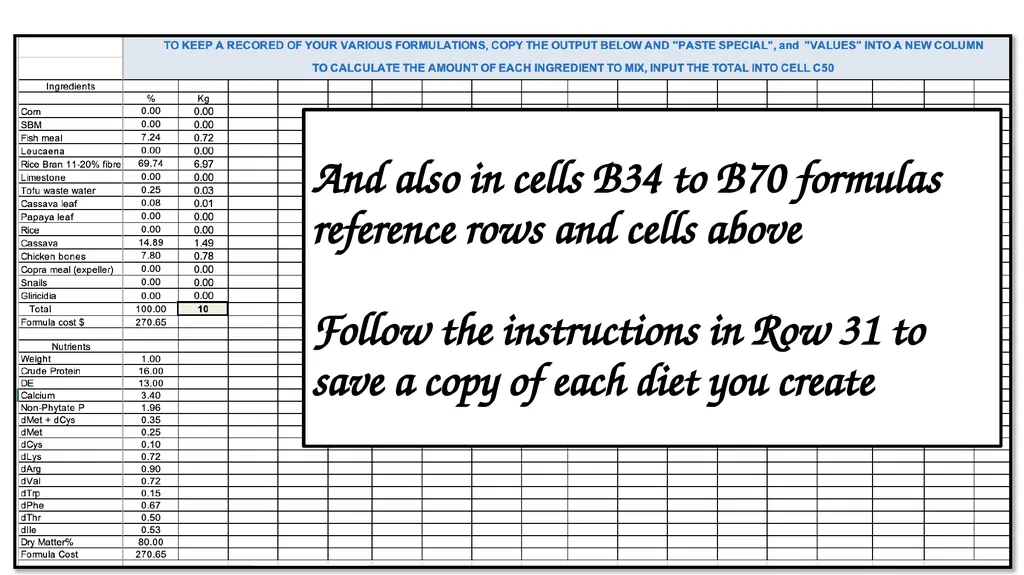
And also in cells B34 to B70 formulas reference rows and cells above Follow the instructions in Row 31 to save a copy of each diet you create<br>
10
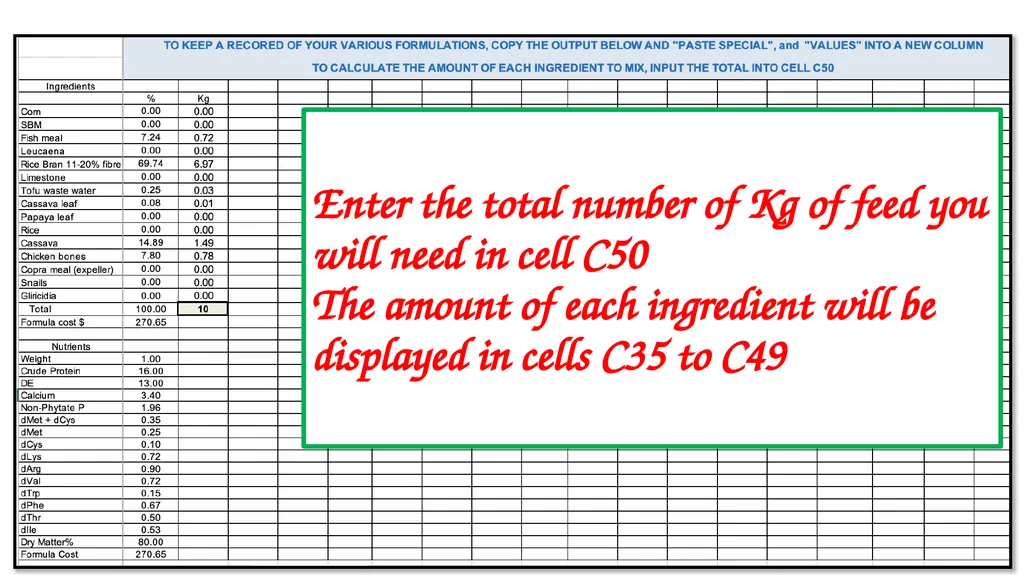
Enter the total number of Kg of feed you will need in cell C50 The amount of each ingredient will be displayed in cells C35 to C49<br>
11
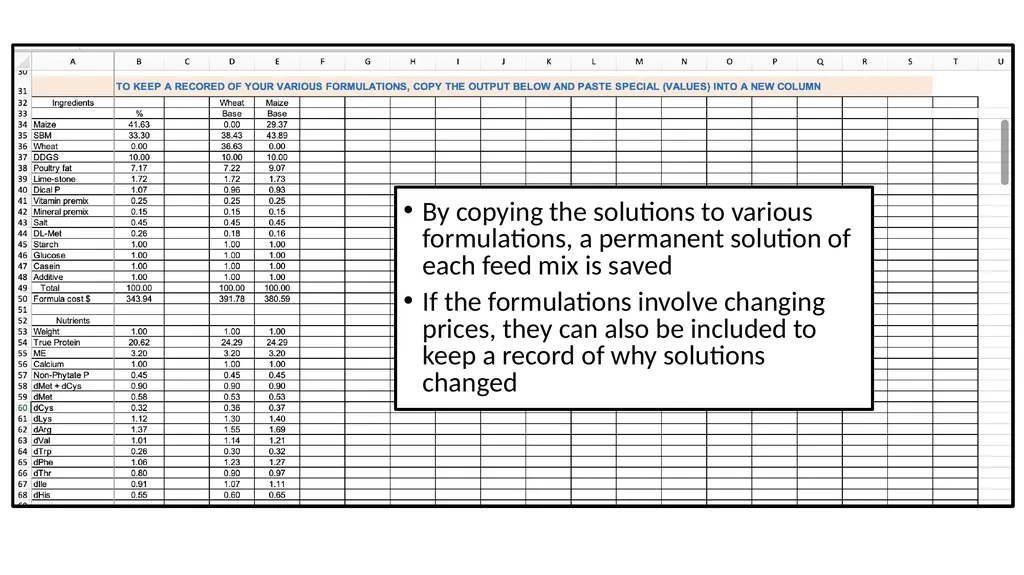
By copying the solutions to various formulations, a permanent solution of each feed mix is saved
If the formulations involve changing prices, they can also be included to keep a record of why solutions changed<br>
12
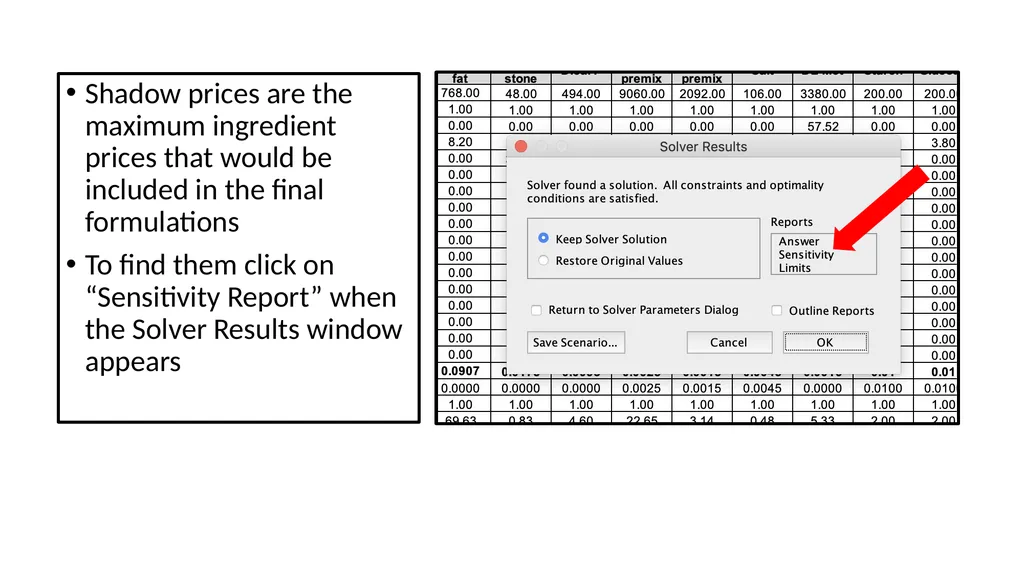
Shadow prices are the maximum ingredient prices that would be included in the final formulations
To find them click on “Sensitivity Report” when the Solver Results window appears<br>
13
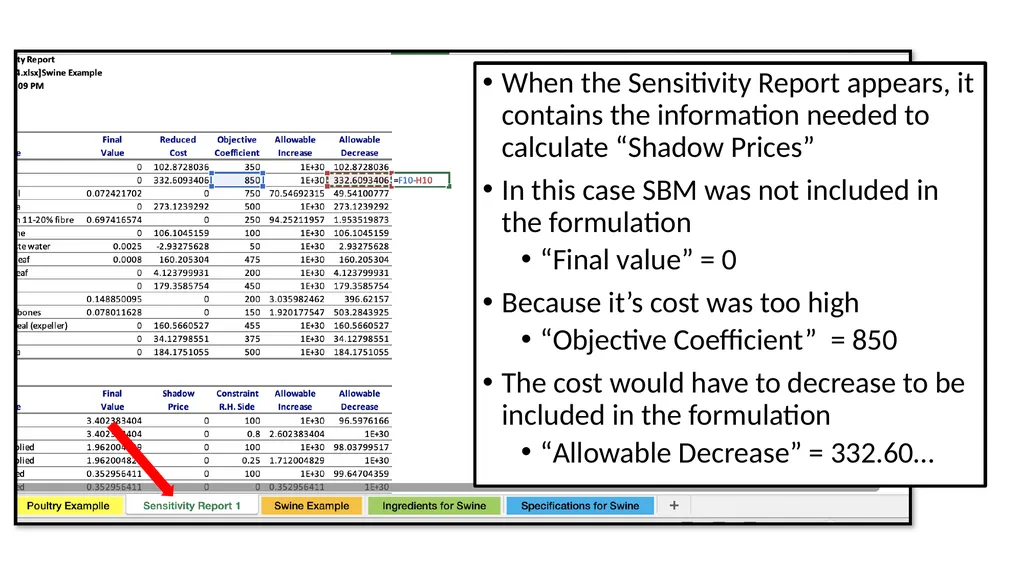
When the Sensitivity Report appears, it contains the information needed to calculate “Shadow Prices”
In this case SBM was not included in the formulation
“Final value” = 0
Because it’s cost was too high
“Objective Coefficient” = 850
The cost would have to decrease to be included in the formulation
“Allowable Decrease” = 332.60…<br>
14
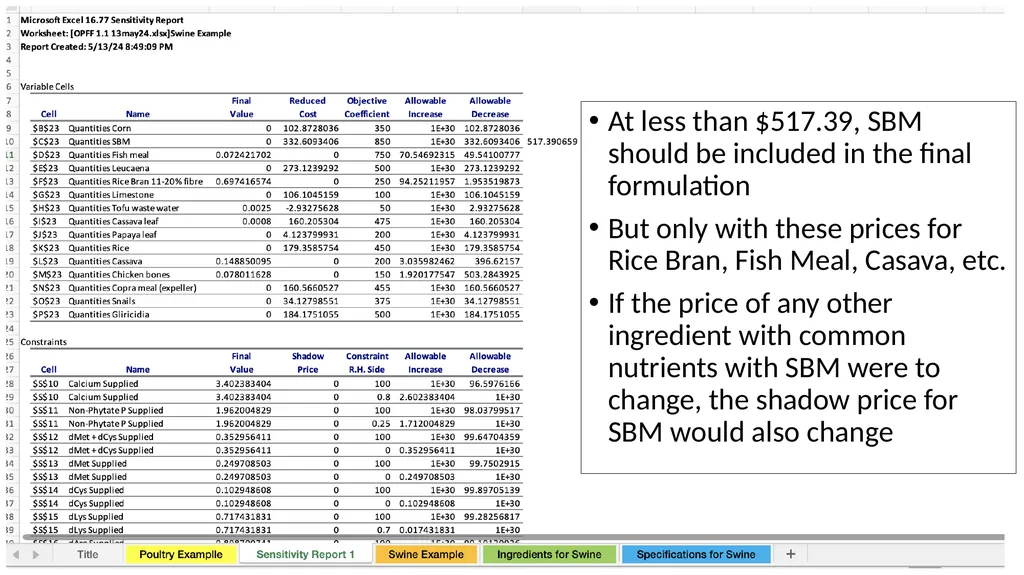
At less than $517.39, SBM should be included in the final formulation
But only with these prices for Rice Bran, Fish Meal, Casava, etc.
If the price of any other ingredient with common nutrients with SBM were to change, the shadow price for SBM would also change<br>
15
With SBM included at $517.38, the formulation contains 13.49% SBM and less Rice Bran
The Formula cost is unchanged so it doesn’t matter if SBM is used at $517.38 or Rice Bran at $250<br>