
Presentation: Barriers to Agribusiness in
Description: Presentation: Barriers to Agribusiness in Palestine General economic information Source: World Bank, 2019 Palestines economy saw a growth in the first half of 2019 but is expected to enter negative growth in 2020 Real GDP growth is
Related Topics
Download Presentation
"Presentation: Barriers to Agribusiness in" is the property of its rightful owner. Permission is granted to download and print the materials on this website for personal, non-commercial use only, and to display it on your personal computer provided you do not modify the materials and that you retain all copyright notices contained in the materials. By downloading content from our website, you accept the terms of this agreement.
Presentation Transcript
slide1. Presentation: Barriers to Agribusiness in Palestine<br>
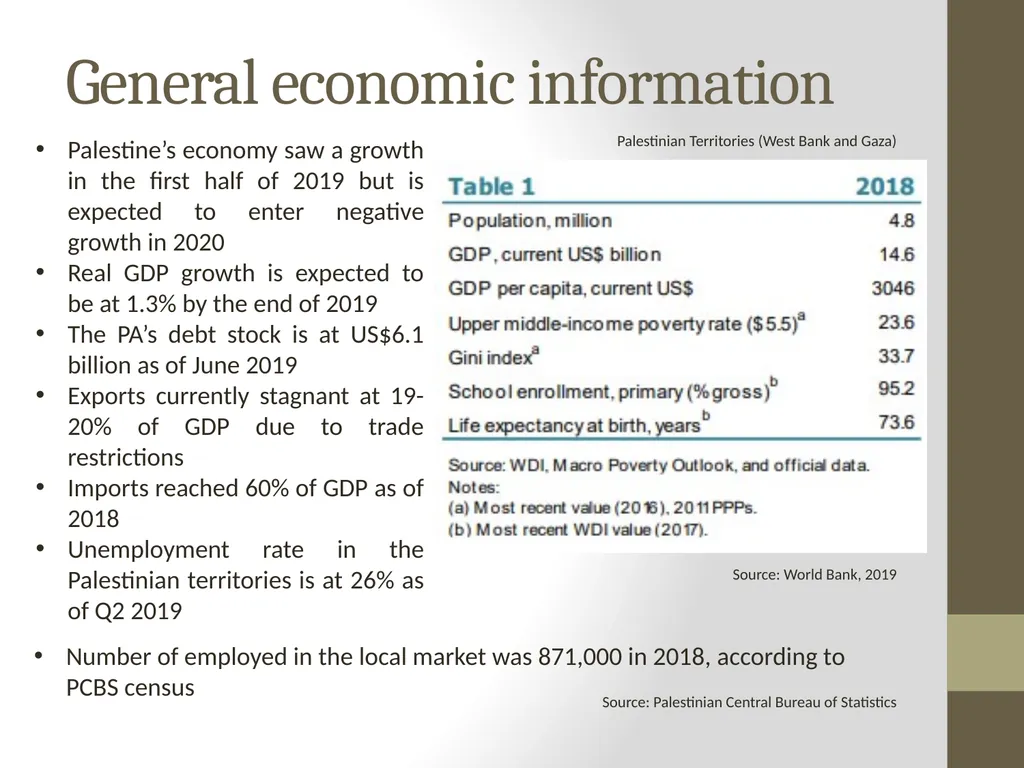
slide3. General economic information Source: World Bank, 2019 Palestine’s economy saw a growth in the first half of 2019 but is expected to enter negative growth in 2020
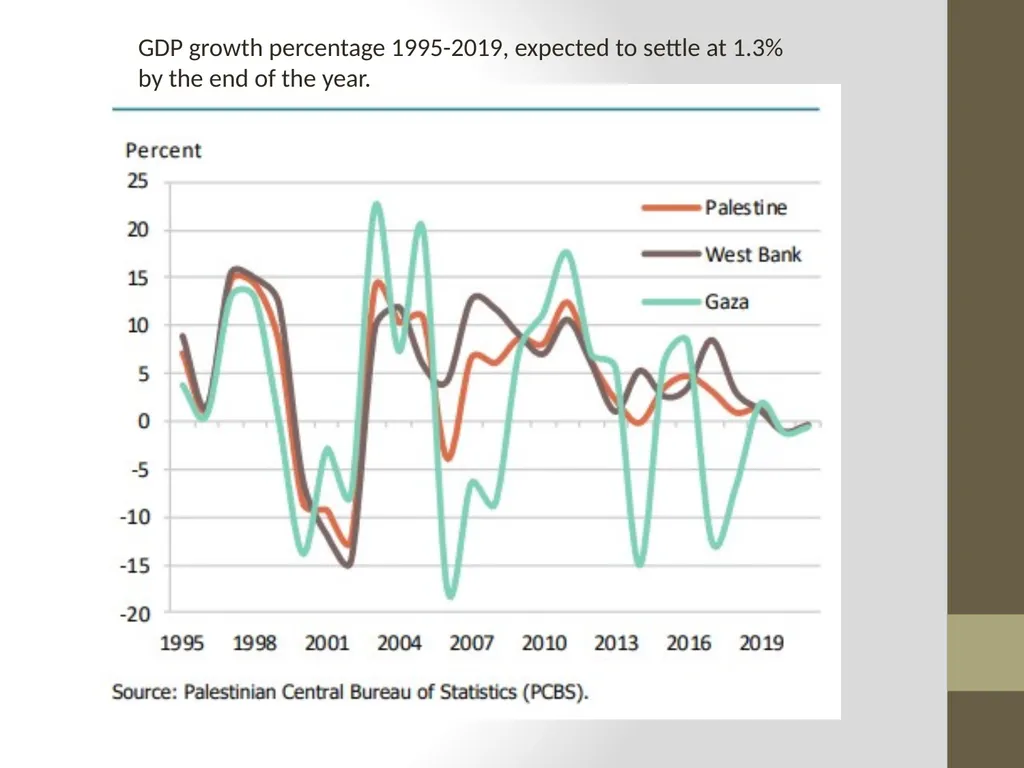
Real GDP growth is expected to be at 1.3% by the end of 2019
The PA’s debt stock is at US$6.1 billion as of June 2019
Exports currently stagnant at 19-20% of GDP due to trade restrictions
Imports reached 60% of GDP as of 2018
Unemployment rate in the Palestinian territories is at 26% as of Q2 2019 Number of employed in the local market was 871,000 in 2018, according to PCBS census Palestinian Territories (West Bank and Gaza) Source: Palestinian Central Bureau of Statistics<br>
slide4. GDP growth percentage 1995-2019, expected to settle at 1.3% by the end of the year.<br>
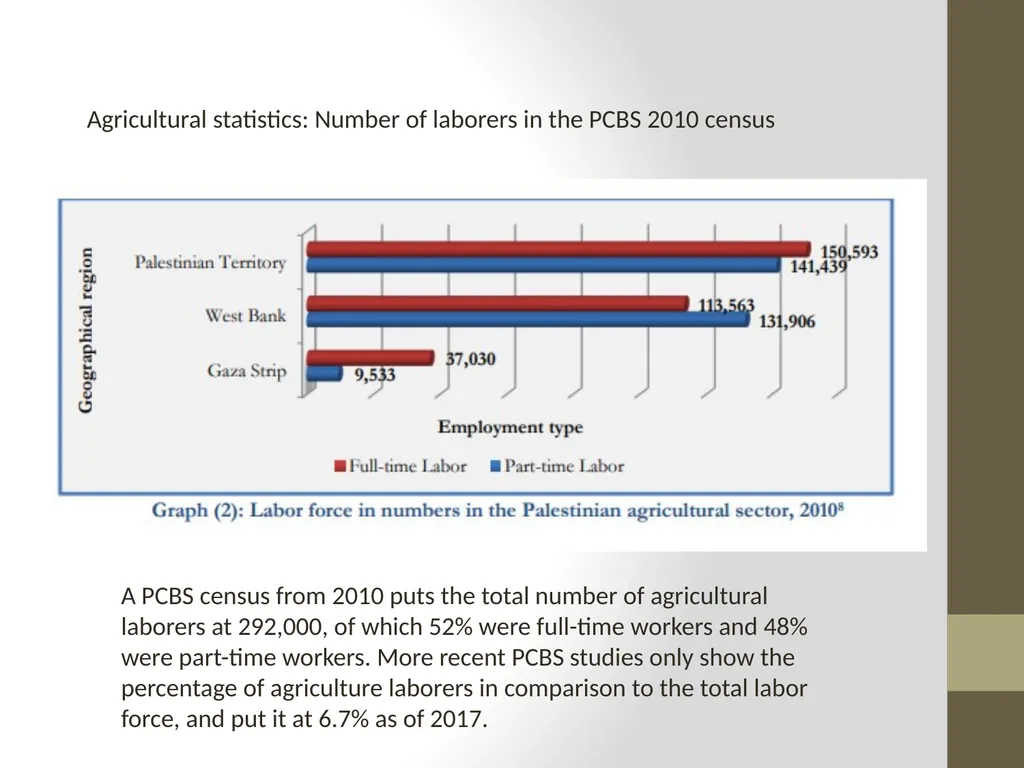
slide5. A PCBS census from 2010 puts the total number of agricultural laborers at 292,000, of which 52% were full-time workers and 48% were part-time workers. More recent PCBS studies only show the percentage of agriculture laborers in comparison to the total labor force, and put it at 6.7% as of 2017. Agricultural statistics: Number of laborers in the PCBS 2010 census<br>
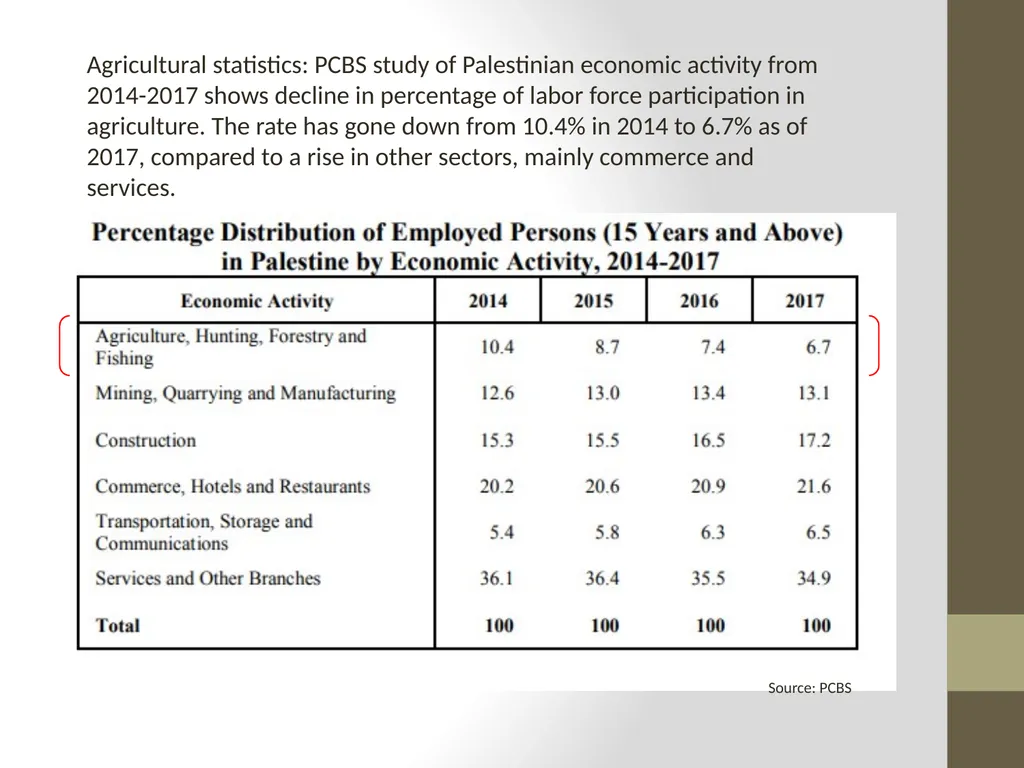
slide6. Source: PCBS Agricultural statistics: PCBS study of Palestinian economic activity from 2014-2017 shows decline in percentage of labor force participation in agriculture. The rate has gone down from 10.4% in 2014 to 6.7% as of 2017, compared to a rise in other sectors, mainly commerce and services.<br>
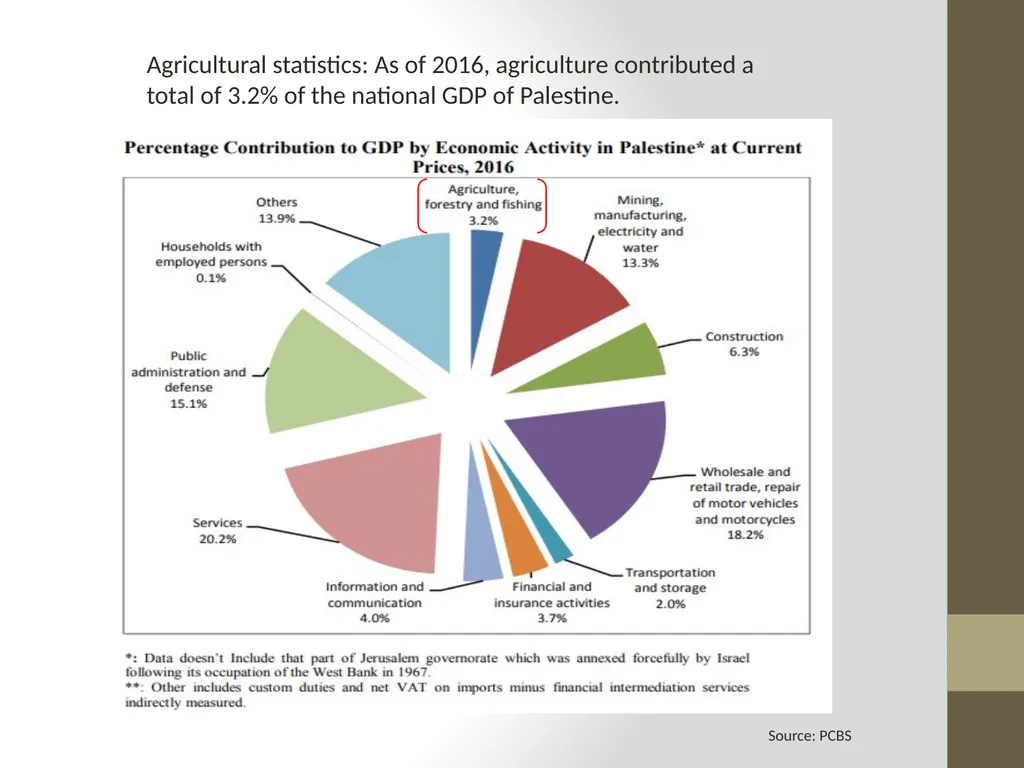
slide7. Source: PCBS Agricultural statistics: As of 2016, agriculture contributed a total of 3.2% of the national GDP of Palestine.<br>
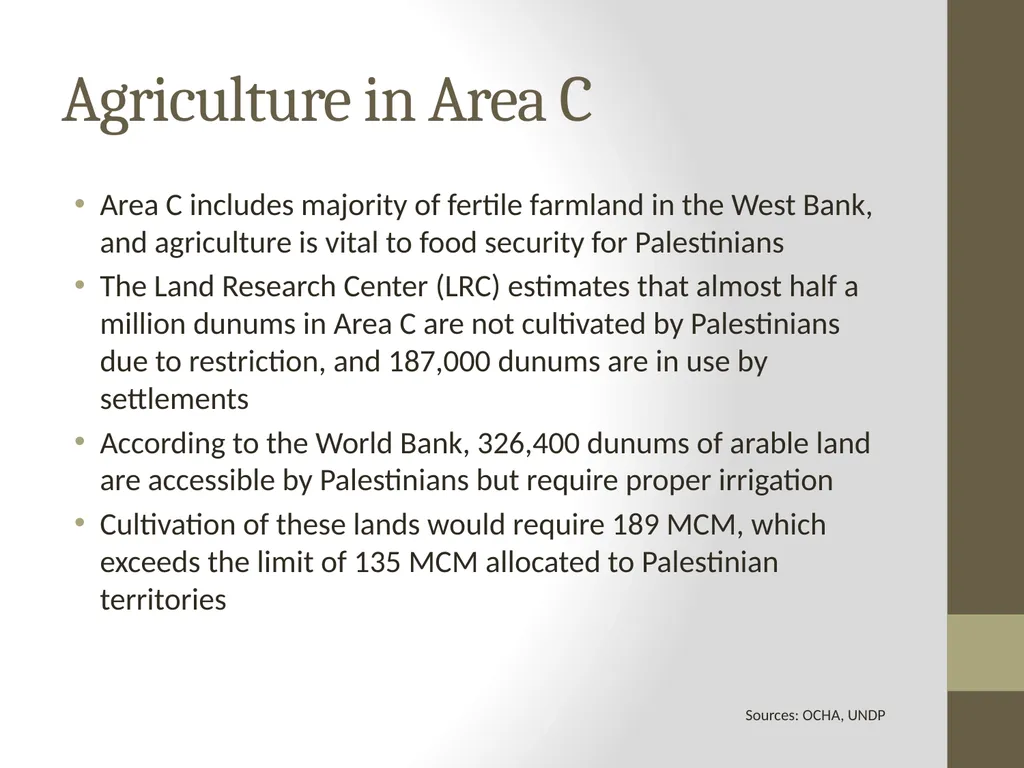
slide8. Agriculture in Area C Area C includes majority of fertile farmland in the West Bank, and agriculture is vital to food security for Palestinians
The Land Research Center (LRC) estimates that almost half a million dunums in Area C are not cultivated by Palestinians due to restriction, and 187,000 dunums are in use by settlements
According to the World Bank, 326,400 dunums of arable land are accessible by Palestinians but require proper irrigation
Cultivation of these lands would require 189 MCM, which exceeds the limit of 135 MCM allocated to Palestinian territories Sources: OCHA, UNDP<br>
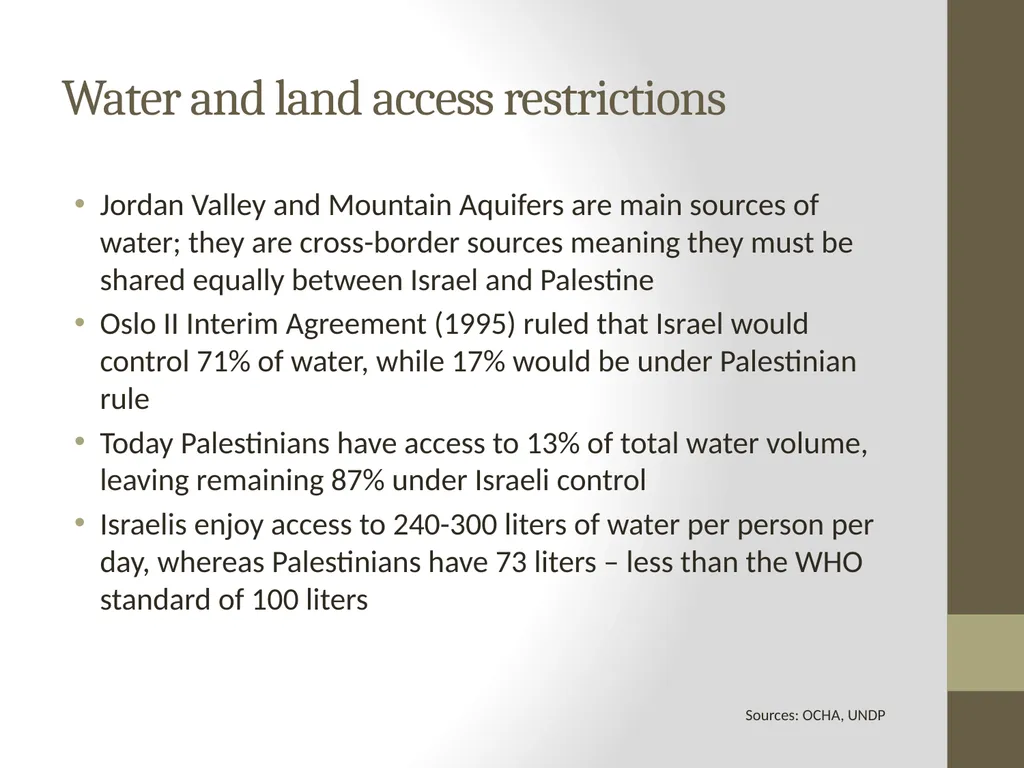
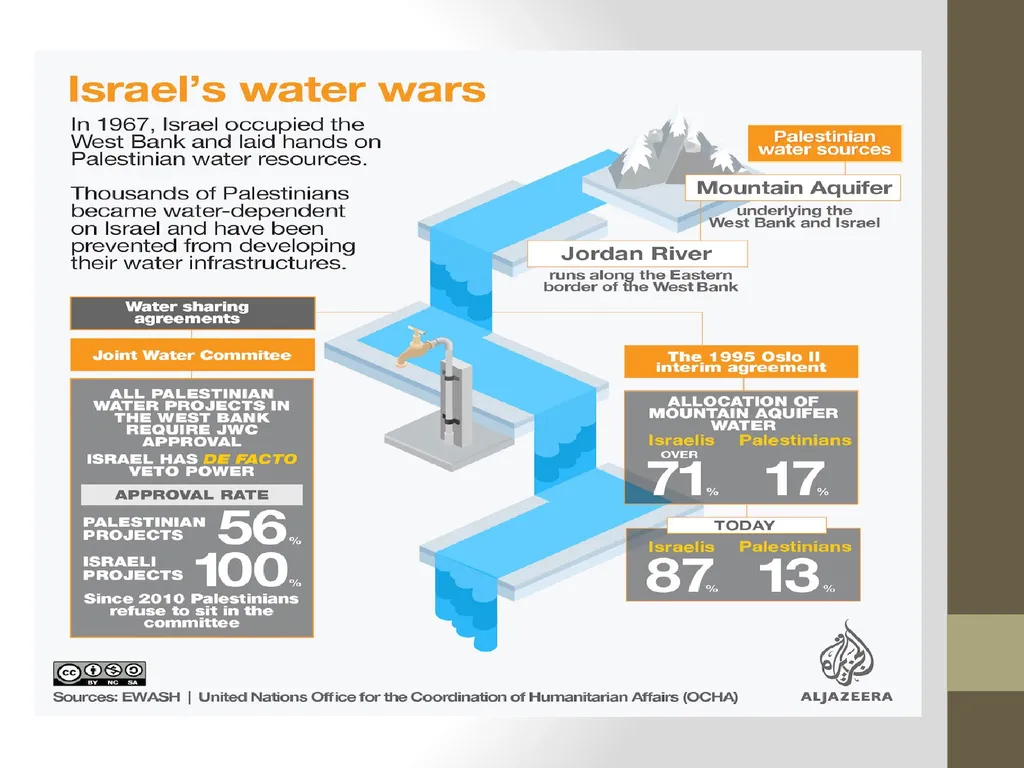
slide9. Water and land access restrictions Jordan Valley and Mountain Aquifers are main sources of water; they are cross-border sources meaning they must be shared equally between Israel and Palestine
Oslo II Interim Agreement (1995) ruled that Israel would control 71% of water, while 17% would be under Palestinian rule
Today Palestinians have access to 13% of total water volume, leaving remaining 87% under Israeli control
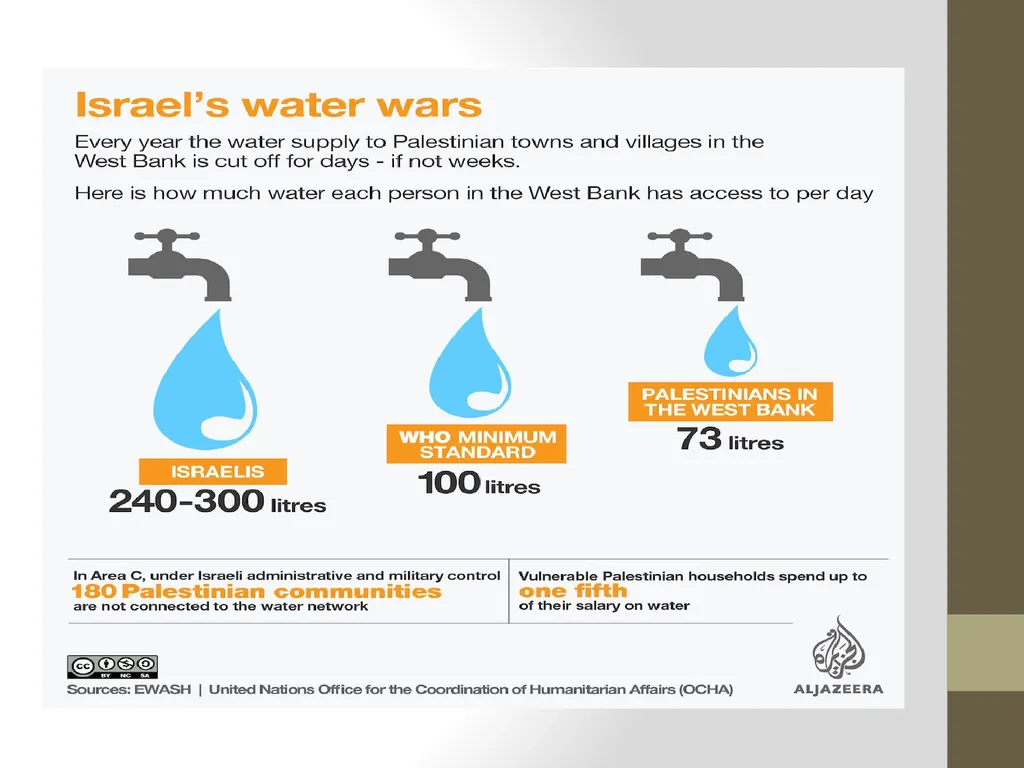
Israelis enjoy access to 240-300 liters of water per person per day, whereas Palestinians have 73 liters – less than the WHO standard of 100 liters Sources: OCHA, UNDP<br>
slide12. Water and land access restrictions: Area C Construction in Area C requires permits from the Israeli Civil Administration (ICA) and Joint Water Committee (JWC)
JWC’s approval rate for Palestinian projects is 54%, compared to nearly 100% approval rate for Israeli requests
According to OCHA, the ICA refused 98.5% of Palestinian building permit requests in Area C between 2010-2014; number of applications declining due to expected refusal
In addition, Israel regularly demolishes houses, agricultural structures, water reserve systems
Israel also regularly cuts off water, at times for days or weeks, forcing Palestinians to buy trucked water at 5 times the price of network water Sources: OCHA, UNDP<br>
slide13. Dual use items policy: Israel restricts the import and transfer of 62 items for Gaza and 56 for the West Bank, which is more than international standard practice
Dual use items include building materials, machinery, and active chemicals which are necessary for soil fertilizers
Restricted good also include communications equipment, manufacturing production lines, spare parts, and home appliances, which has contributed to delay in the development of the Palestinian ICT sector
Dual use goods transfers require permits from the Israeli Civil Administration (ICA), Israeli Security Agency (ISA) and the Coordinator of Government in the Territories (COGAT) and only allow a transfer period of 45 days Source: World Bank<br>
slide14. EU as largest importer of settlement produce Israel was ranked 27th on the list of European trade partners with a total of 34.4 billion euros in 2018
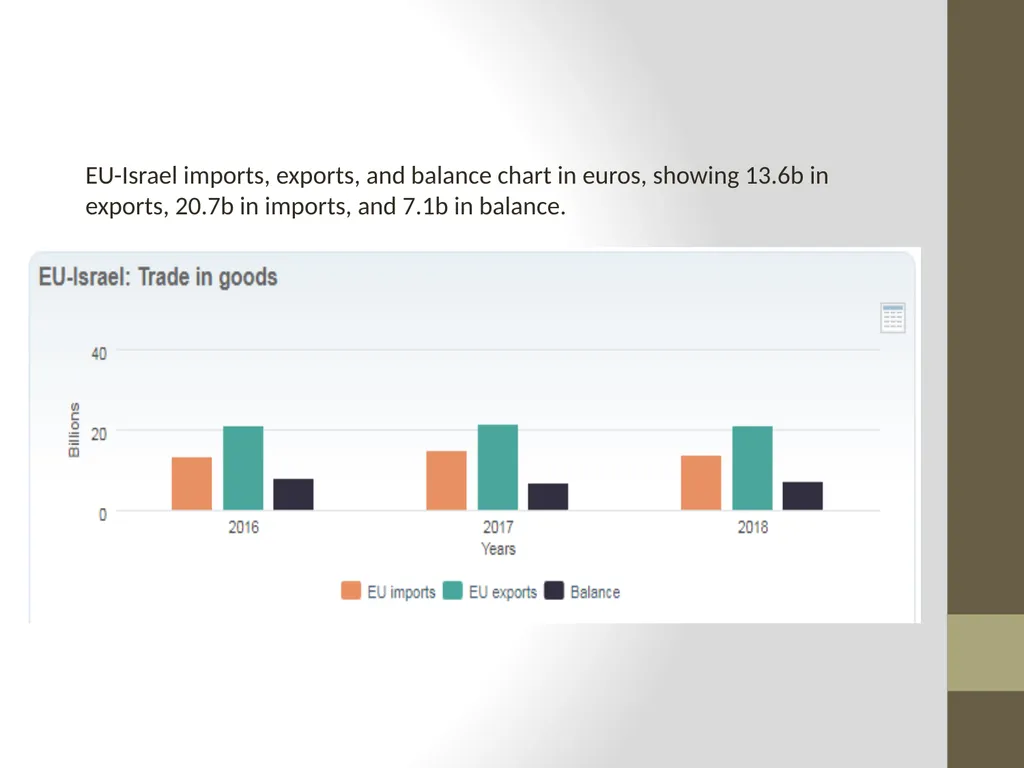
13.6 billion account for goods imported from Israel, and 20.7 billion for goods exported from the EU to Israel, in addition to a trade balance of 7.1 billion
Israel’s largest exports values to 5 European countries in 2018 are as follows: United Kingdom – US$ 5.1 billion Belgium – US$ 2.7 billion Netherlands – US$ 2.3 billion France – US$ 1.7 billion Germany – US$ 1.6 billion Source: globalTRADE, COMTRADE, European Commission<br>
slide15. EU-Israel imports, exports, and balance chart in euros, showing 13.6b in exports, 20.7b in imports, and 7.1b in balance.<br>
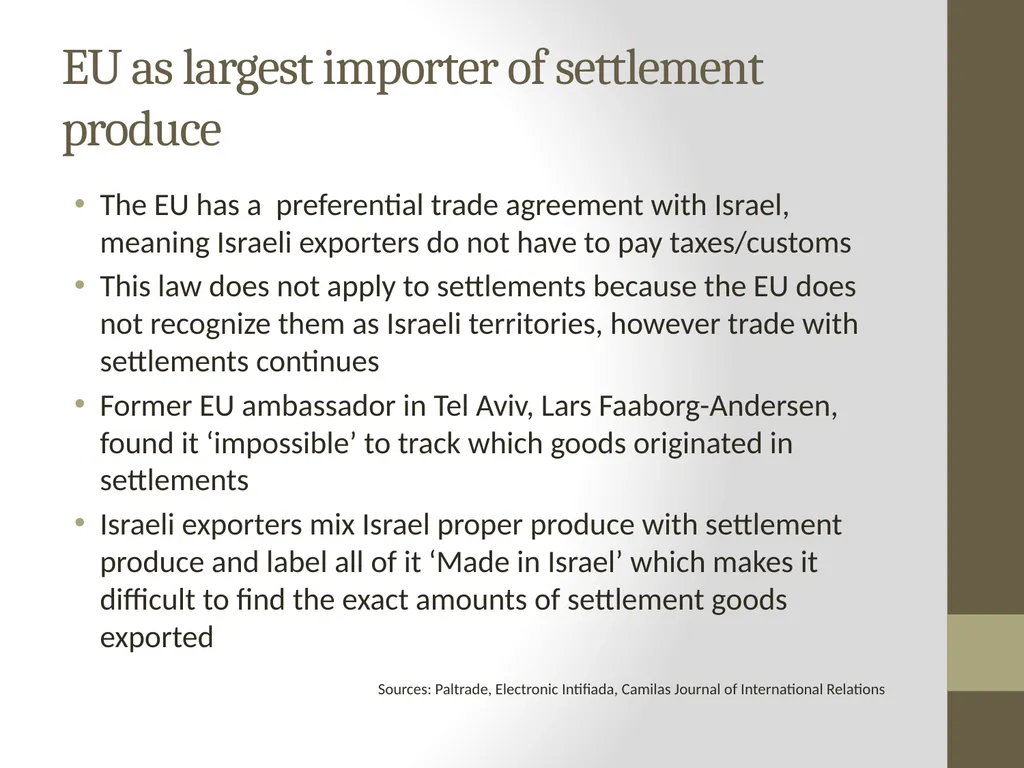
slide16. EU as largest importer of settlement produce The EU has a preferential trade agreement with Israel, meaning Israeli exporters do not have to pay taxes/customs
This law does not apply to settlements because the EU does not recognize them as Israeli territories, however trade with settlements continues
Former EU ambassador in Tel Aviv, Lars Faaborg-Andersen, found it ‘impossible’ to track which goods originated in settlements
Israeli exporters mix Israel proper produce with settlement produce and label all of it ‘Made in Israel’ which makes it difficult to find the exact amounts of settlement goods exported Sources: Paltrade, Electronic Intifiada, Camilas Journal of International Relations<br>
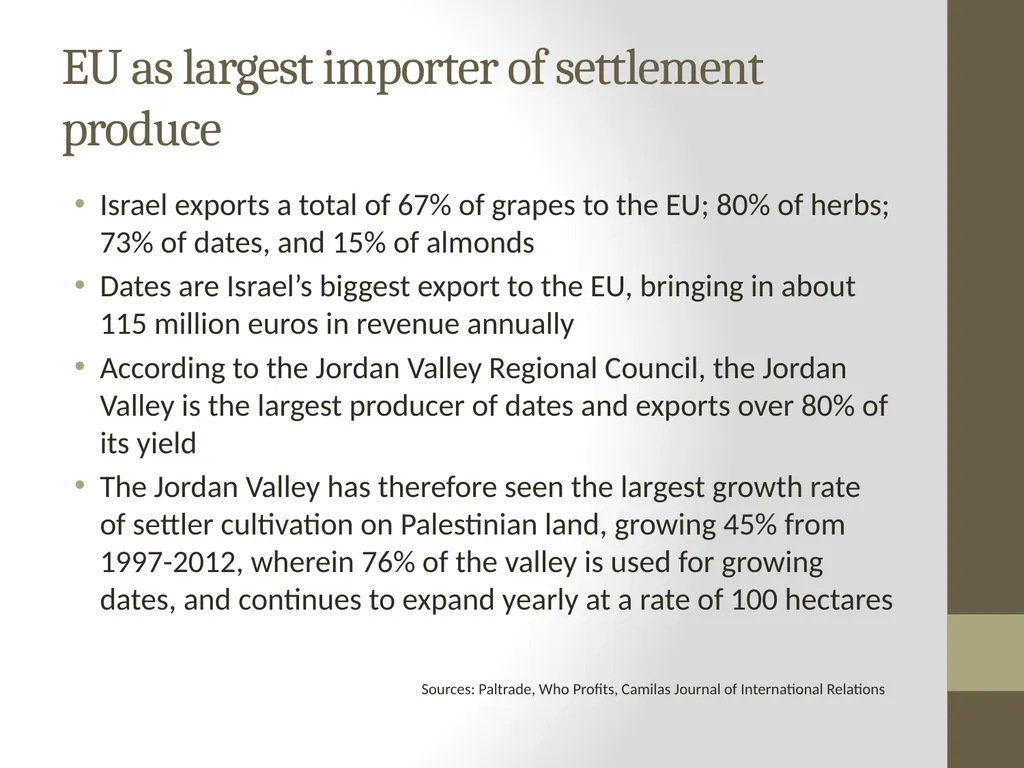
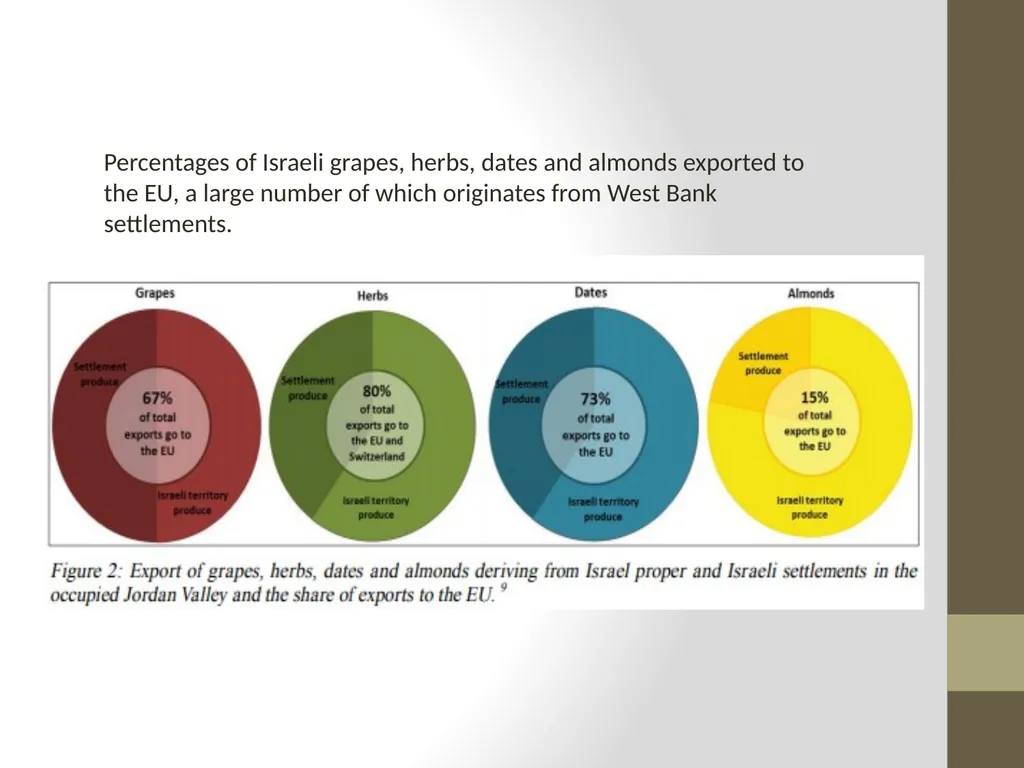
slide17. EU as largest importer of settlement produce Israel exports a total of 67% of grapes to the EU; 80% of herbs; 73% of dates, and 15% of almonds
Dates are Israel’s biggest export to the EU, bringing in about 115 million euros in revenue annually
According to the Jordan Valley Regional Council, the Jordan Valley is the largest producer of dates and exports over 80% of its yield
The Jordan Valley has therefore seen the largest growth rate of settler cultivation on Palestinian land, growing 45% from 1997-2012, wherein 76% of the valley is used for growing dates, and continues to expand yearly at a rate of 100 hectares Sources: Paltrade, Who Profits, Camilas Journal of International Relations<br>
slide18. Percentages of Israeli grapes, herbs, dates and almonds exported to the EU, a large number of which originates from West Bank settlements.<br>
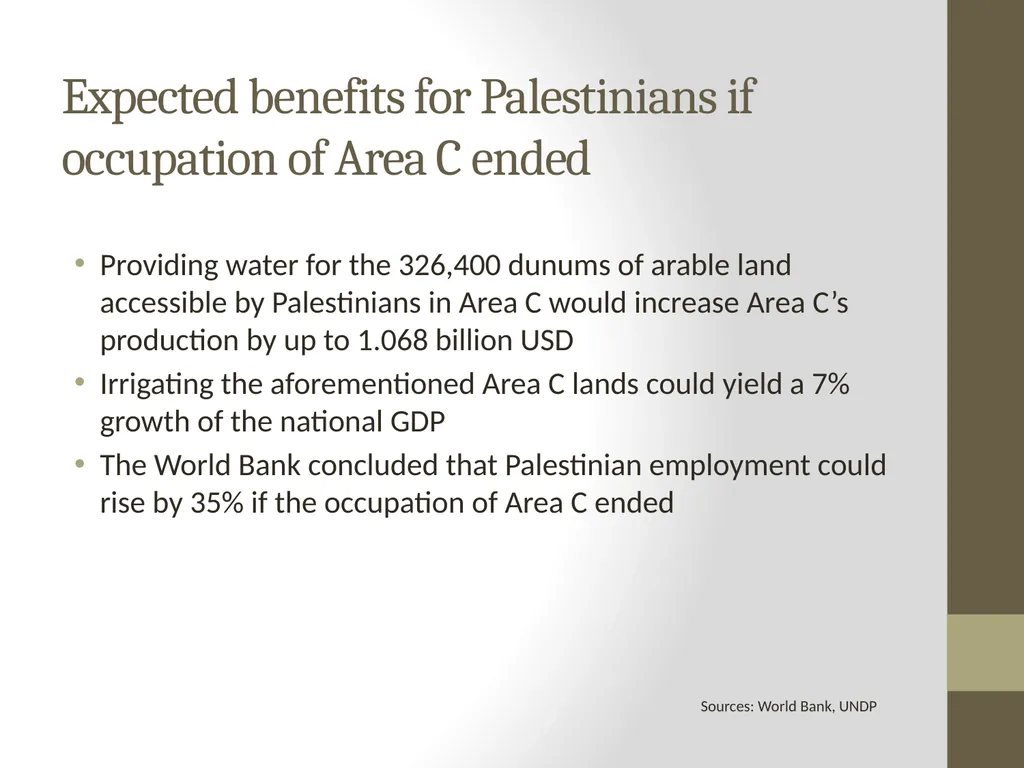
slide19. Expected benefits for Palestinians if occupation of Area C ended Providing water for the 326,400 dunums of arable land accessible by Palestinians in Area C would increase Area C’s production by up to 1.068 billion USD
Irrigating the aforementioned Area C lands could yield a 7% growth of the national GDP
The World Bank concluded that Palestinian employment could rise by 35% if the occupation of Area C ended Sources: World Bank, UNDP<br>
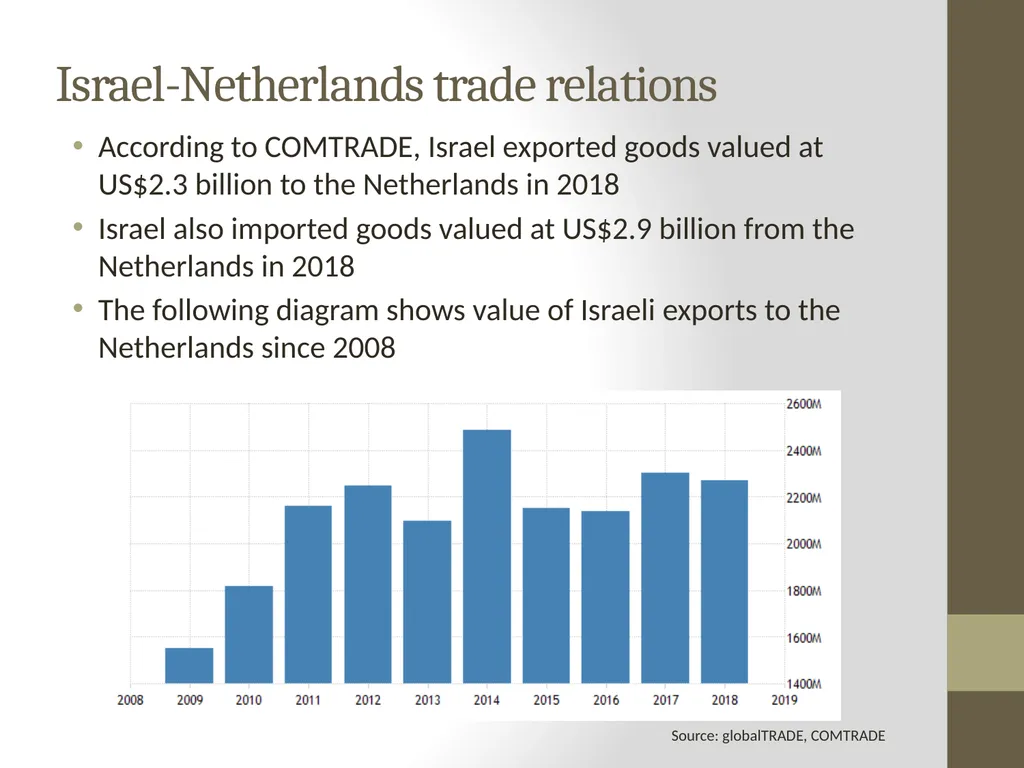
slide20. Israel-Netherlands trade relations According to COMTRADE, Israel exported goods valued at US$2.3 billion to the Netherlands in 2018
Israel also imported goods valued at US$2.9 billion from the Netherlands in 2018
The following diagram shows value of Israeli exports to the Netherlands since 2008 Source: globalTRADE, COMTRADE<br>
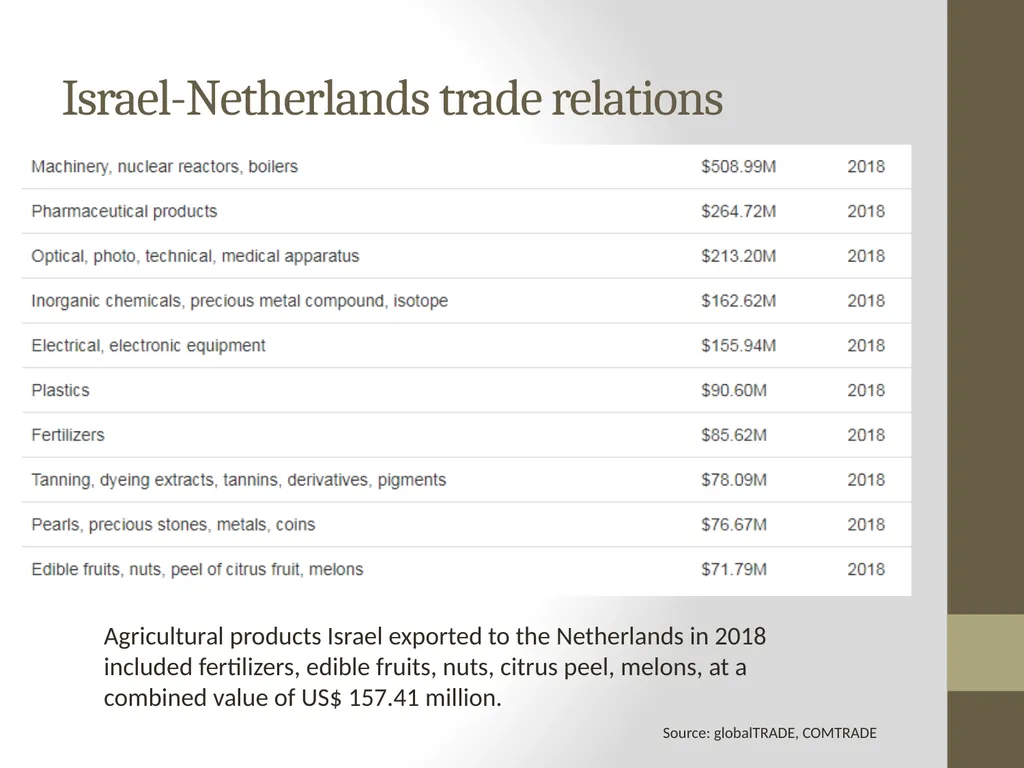
slide21. Israel-Netherlands trade relations Agricultural products Israel exported to the Netherlands in 2018 included fertilizers, edible fruits, nuts, citrus peel, melons, at a combined value of US$ 157.41 million. Source: globalTRADE, COMTRADE<br>
slide22. Sources: Audeh, A., “TRADE BETWEEN THE EU AND ISRAELI SETTLEMENTS: HOW TECHNICAL ARRANGEMENTS ADD TO STRUCTURAL INJUSTICE IN THE SUPPLY CHAIN,” in Camilas Journal of International Relations, vol. 11, 2018.
Electronic Intifiada article. Accessed: https://electronicintifada.net/blogs/david-cronin/checking-settlement-exports-impossible-eu-admits.
Paltrade Position Study: EU Trade with Israeli Settlements, 2013.
PCBS: Palestine in Figures, 2017.
PCBS: Agriculture Census, 2010.
UNDP Report: Building Resilience in Area C, 2016.
World Bank Study: Area C and the Future of Palestinian Economy, 2016
World Bank: Dual use items reform, press release. Accessed: https://www.worldbank.org/en/news/press-release/2019/04/17/world-bank-calls-for-reform-to-the-dual-use-goods-system-to-revive-a-stagnant-palestinian-economy
World Bank: Palestine ‘s Economic Update, October 2019. Accessed: https://www.worldbank.org/en/country/westbankandgaza/publication/economic-update-october-2019.
https://tradingeconomics.com/israel/exports/netherlands
https://globaledge.msu.edu/countries/israel/tradestats
https://trade.ec.europa.eu/doclib/docs/2006/september/tradoc_122530.pdf<br>
slide3. General economic information Source: World Bank, 2019 Palestine’s economy saw a growth in the first half of 2019 but is expected to enter negative growth in 2020
Real GDP growth is expected to be at 1.3% by the end of 2019
The PA’s debt stock is at US$6.1 billion as of June 2019
Exports currently stagnant at 19-20% of GDP due to trade restrictions
Imports reached 60% of GDP as of 2018
Unemployment rate in the Palestinian territories is at 26% as of Q2 2019 Number of employed in the local market was 871,000 in 2018, according to PCBS census Palestinian Territories (West Bank and Gaza) Source: Palestinian Central Bureau of Statistics<br>
slide4. GDP growth percentage 1995-2019, expected to settle at 1.3% by the end of the year.<br>
slide5. A PCBS census from 2010 puts the total number of agricultural laborers at 292,000, of which 52% were full-time workers and 48% were part-time workers. More recent PCBS studies only show the percentage of agriculture laborers in comparison to the total labor force, and put it at 6.7% as of 2017. Agricultural statistics: Number of laborers in the PCBS 2010 census<br>
slide6. Source: PCBS Agricultural statistics: PCBS study of Palestinian economic activity from 2014-2017 shows decline in percentage of labor force participation in agriculture. The rate has gone down from 10.4% in 2014 to 6.7% as of 2017, compared to a rise in other sectors, mainly commerce and services.<br>
slide7. Source: PCBS Agricultural statistics: As of 2016, agriculture contributed a total of 3.2% of the national GDP of Palestine.<br>
slide8. Agriculture in Area C Area C includes majority of fertile farmland in the West Bank, and agriculture is vital to food security for Palestinians
The Land Research Center (LRC) estimates that almost half a million dunums in Area C are not cultivated by Palestinians due to restriction, and 187,000 dunums are in use by settlements
According to the World Bank, 326,400 dunums of arable land are accessible by Palestinians but require proper irrigation
Cultivation of these lands would require 189 MCM, which exceeds the limit of 135 MCM allocated to Palestinian territories Sources: OCHA, UNDP<br>
slide9. Water and land access restrictions Jordan Valley and Mountain Aquifers are main sources of water; they are cross-border sources meaning they must be shared equally between Israel and Palestine
Oslo II Interim Agreement (1995) ruled that Israel would control 71% of water, while 17% would be under Palestinian rule
Today Palestinians have access to 13% of total water volume, leaving remaining 87% under Israeli control
Israelis enjoy access to 240-300 liters of water per person per day, whereas Palestinians have 73 liters – less than the WHO standard of 100 liters Sources: OCHA, UNDP<br>
slide12. Water and land access restrictions: Area C Construction in Area C requires permits from the Israeli Civil Administration (ICA) and Joint Water Committee (JWC)
JWC’s approval rate for Palestinian projects is 54%, compared to nearly 100% approval rate for Israeli requests
According to OCHA, the ICA refused 98.5% of Palestinian building permit requests in Area C between 2010-2014; number of applications declining due to expected refusal
In addition, Israel regularly demolishes houses, agricultural structures, water reserve systems
Israel also regularly cuts off water, at times for days or weeks, forcing Palestinians to buy trucked water at 5 times the price of network water Sources: OCHA, UNDP<br>
slide13. Dual use items policy: Israel restricts the import and transfer of 62 items for Gaza and 56 for the West Bank, which is more than international standard practice
Dual use items include building materials, machinery, and active chemicals which are necessary for soil fertilizers
Restricted good also include communications equipment, manufacturing production lines, spare parts, and home appliances, which has contributed to delay in the development of the Palestinian ICT sector
Dual use goods transfers require permits from the Israeli Civil Administration (ICA), Israeli Security Agency (ISA) and the Coordinator of Government in the Territories (COGAT) and only allow a transfer period of 45 days Source: World Bank<br>
slide14. EU as largest importer of settlement produce Israel was ranked 27th on the list of European trade partners with a total of 34.4 billion euros in 2018
13.6 billion account for goods imported from Israel, and 20.7 billion for goods exported from the EU to Israel, in addition to a trade balance of 7.1 billion
Israel’s largest exports values to 5 European countries in 2018 are as follows: United Kingdom – US$ 5.1 billion Belgium – US$ 2.7 billion Netherlands – US$ 2.3 billion France – US$ 1.7 billion Germany – US$ 1.6 billion Source: globalTRADE, COMTRADE, European Commission<br>
slide15. EU-Israel imports, exports, and balance chart in euros, showing 13.6b in exports, 20.7b in imports, and 7.1b in balance.<br>
slide16. EU as largest importer of settlement produce The EU has a preferential trade agreement with Israel, meaning Israeli exporters do not have to pay taxes/customs
This law does not apply to settlements because the EU does not recognize them as Israeli territories, however trade with settlements continues
Former EU ambassador in Tel Aviv, Lars Faaborg-Andersen, found it ‘impossible’ to track which goods originated in settlements
Israeli exporters mix Israel proper produce with settlement produce and label all of it ‘Made in Israel’ which makes it difficult to find the exact amounts of settlement goods exported Sources: Paltrade, Electronic Intifiada, Camilas Journal of International Relations<br>
slide17. EU as largest importer of settlement produce Israel exports a total of 67% of grapes to the EU; 80% of herbs; 73% of dates, and 15% of almonds
Dates are Israel’s biggest export to the EU, bringing in about 115 million euros in revenue annually
According to the Jordan Valley Regional Council, the Jordan Valley is the largest producer of dates and exports over 80% of its yield
The Jordan Valley has therefore seen the largest growth rate of settler cultivation on Palestinian land, growing 45% from 1997-2012, wherein 76% of the valley is used for growing dates, and continues to expand yearly at a rate of 100 hectares Sources: Paltrade, Who Profits, Camilas Journal of International Relations<br>
slide18. Percentages of Israeli grapes, herbs, dates and almonds exported to the EU, a large number of which originates from West Bank settlements.<br>
slide19. Expected benefits for Palestinians if occupation of Area C ended Providing water for the 326,400 dunums of arable land accessible by Palestinians in Area C would increase Area C’s production by up to 1.068 billion USD
Irrigating the aforementioned Area C lands could yield a 7% growth of the national GDP
The World Bank concluded that Palestinian employment could rise by 35% if the occupation of Area C ended Sources: World Bank, UNDP<br>
slide20. Israel-Netherlands trade relations According to COMTRADE, Israel exported goods valued at US$2.3 billion to the Netherlands in 2018
Israel also imported goods valued at US$2.9 billion from the Netherlands in 2018
The following diagram shows value of Israeli exports to the Netherlands since 2008 Source: globalTRADE, COMTRADE<br>
slide21. Israel-Netherlands trade relations Agricultural products Israel exported to the Netherlands in 2018 included fertilizers, edible fruits, nuts, citrus peel, melons, at a combined value of US$ 157.41 million. Source: globalTRADE, COMTRADE<br>
slide22. Sources: Audeh, A., “TRADE BETWEEN THE EU AND ISRAELI SETTLEMENTS: HOW TECHNICAL ARRANGEMENTS ADD TO STRUCTURAL INJUSTICE IN THE SUPPLY CHAIN,” in Camilas Journal of International Relations, vol. 11, 2018.
Electronic Intifiada article. Accessed: https://electronicintifada.net/blogs/david-cronin/checking-settlement-exports-impossible-eu-admits.
Paltrade Position Study: EU Trade with Israeli Settlements, 2013.
PCBS: Palestine in Figures, 2017.
PCBS: Agriculture Census, 2010.
UNDP Report: Building Resilience in Area C, 2016.
World Bank Study: Area C and the Future of Palestinian Economy, 2016
World Bank: Dual use items reform, press release. Accessed: https://www.worldbank.org/en/news/press-release/2019/04/17/world-bank-calls-for-reform-to-the-dual-use-goods-system-to-revive-a-stagnant-palestinian-economy
World Bank: Palestine ‘s Economic Update, October 2019. Accessed: https://www.worldbank.org/en/country/westbankandgaza/publication/economic-update-october-2019.
https://tradingeconomics.com/israel/exports/netherlands
https://globaledge.msu.edu/countries/israel/tradestats
https://trade.ec.europa.eu/doclib/docs/2006/september/tradoc_122530.pdf<br>