ROC analysis Background Differentially expressed genes can be used to classify biological samples into categories as: Responder Non-responder Classification is not always unequivocal, because the gene expression values often overlap One of
"ROC analysis Background Differentially expressed" is the property of its rightful owner. Permission is granted to
download and print the materials on this website for personal, non-commercial use only, and to display it
on your personal computer provided you do not modify the materials and that you retain all copyright
notices contained in the materials. By downloading content from our website, you accept the terms of this
agreement.
Presentation Transcript
01
ROC analysis<br>
02
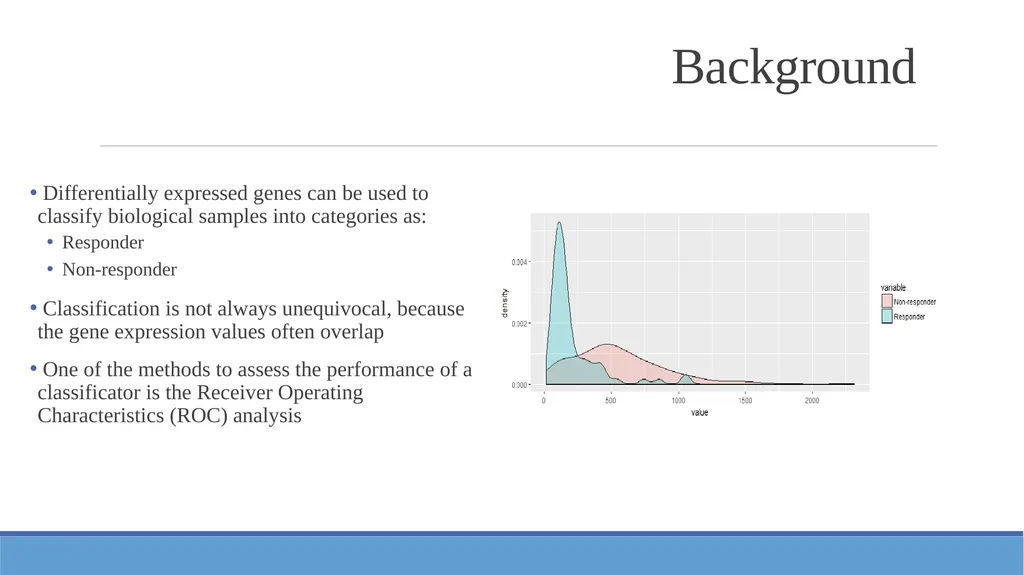
Background Differentially expressed genes can be used to classify biological samples into categories as:
Responder
Non-responder
Classification is not always unequivocal, because the gene expression values often overlap
One of the methods to assess the performance of a classificator is the Receiver Operating Characteristics (ROC) analysis<br>
03
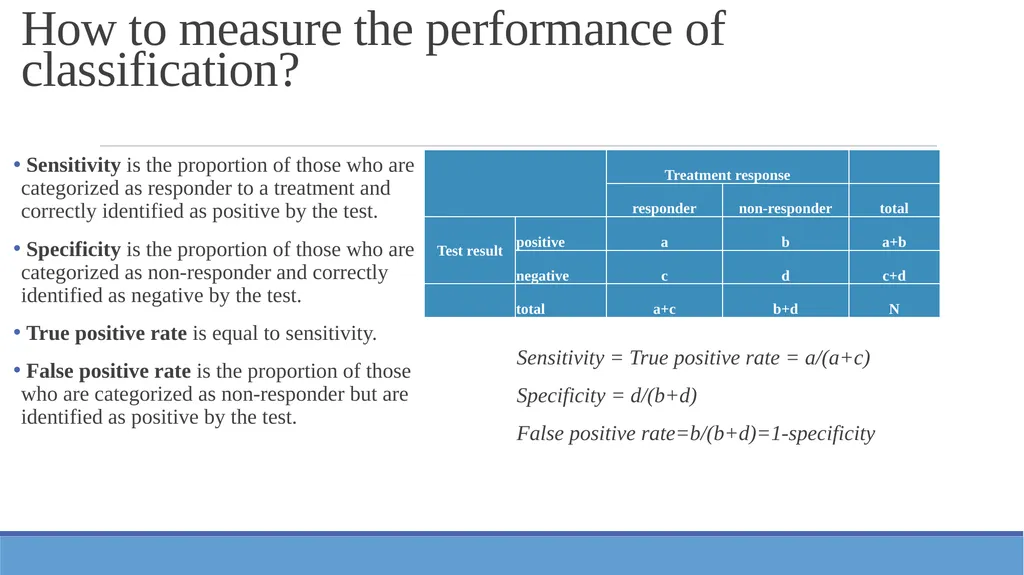
How to measure the performance of classification? Sensitivity is the proportion of those who are categorized as responder to a treatment and correctly identified as positive by the test.
Specificity is the proportion of those who are categorized as non-responder and correctly identified as negative by the test.
True positive rate is equal to sensitivity.
False positive rate is the proportion of those who are categorized as non-responder but are identified as positive by the test. Sensitivity = True positive rate = a/(a+c)
Specificity = d/(b+d)
False positive rate=b/(b+d)=1-specificity<br>
04
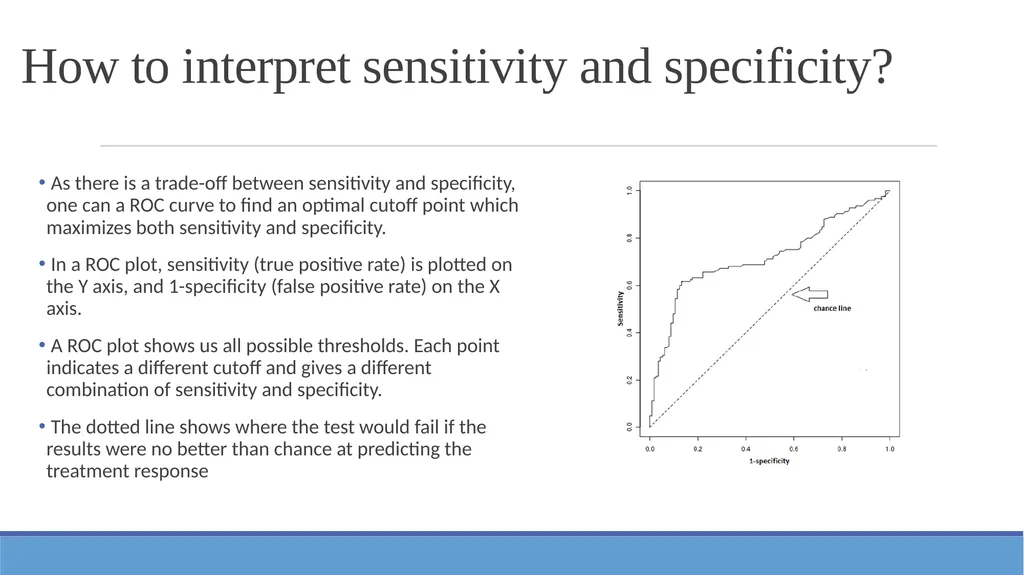
How to interpret sensitivity and specificity? As there is a trade-off between sensitivity and specificity, one can a ROC curve to find an optimal cutoff point which maximizes both sensitivity and specificity.
In a ROC plot, sensitivity (true positive rate) is plotted on the Y axis, and 1-specificity (false positive rate) on the X axis.
A ROC plot shows us all possible thresholds. Each point indicates a different cutoff and gives a different combination of sensitivity and specificity.
The dotted line shows where the test would fail if the results were no better than chance at predicting the treatment response<br>
05
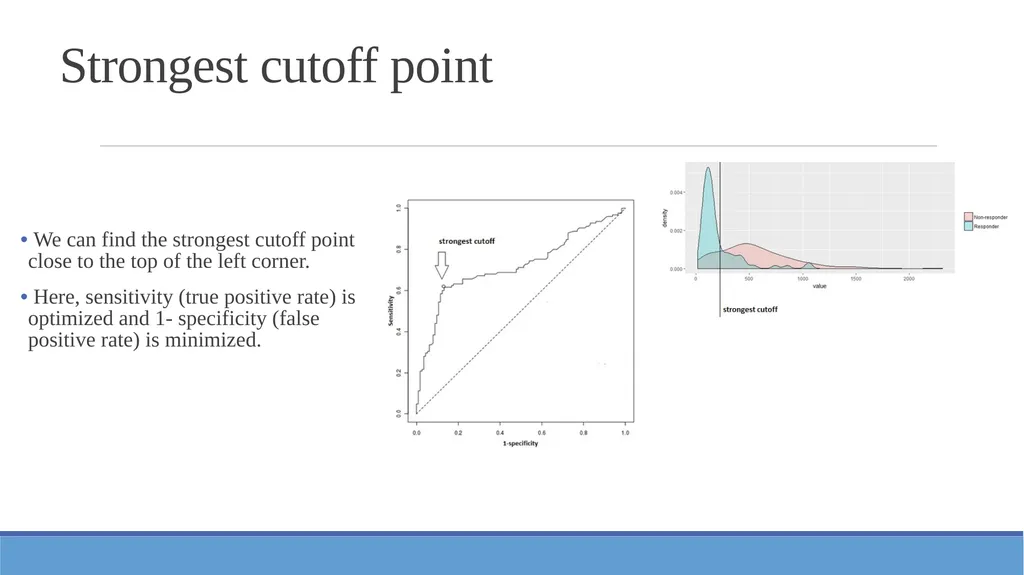
Strongest cutoff point We can find the strongest cutoff point close to the top of the left corner.
Here, sensitivity (true positive rate) is optimized and 1- specificity (false positive rate) is minimized.<br>
06
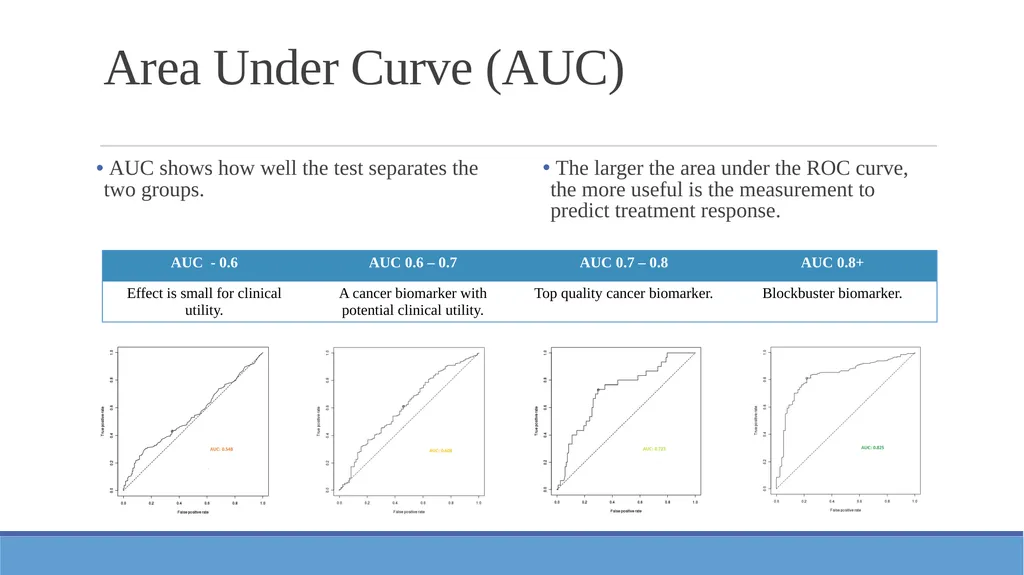
Area Under Curve (AUC) AUC shows how well the test separates the two groups. The larger the area under the ROC curve, the more useful is the measurement to predict treatment response.<br>
07
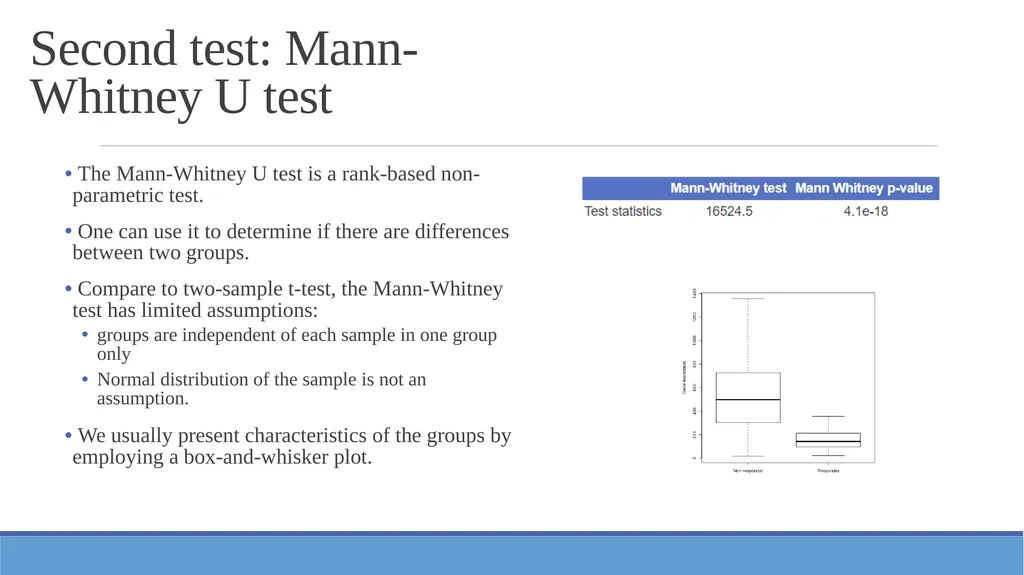
Second test: Mann-Whitney U test The Mann-Whitney U test is a rank-based non-parametric test.
One can use it to determine if there are differences between two groups.
Compare to two-sample t-test, the Mann-Whitney test has limited assumptions:
groups are independent of each sample in one group only
Normal distribution of the sample is not an assumption.
We usually present characteristics of the groups by employing a box-and-whisker plot.<br>
08
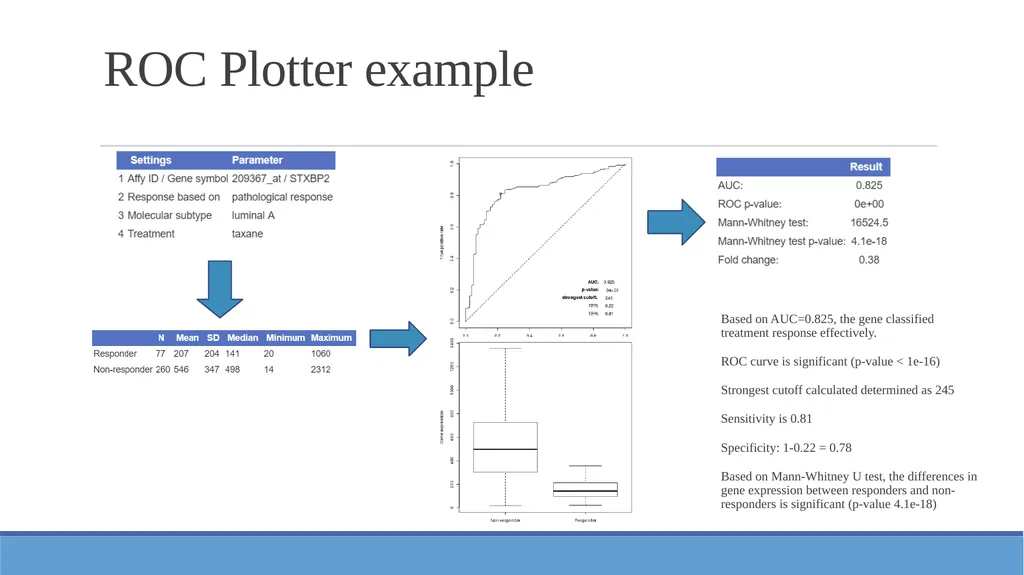
ROC Plotter example Based on AUC=0.825, the gene classified treatment response effectively.
ROC curve is significant (p-value < 1e-16)
Strongest cutoff calculated determined as 245
Sensitivity is 0.81
Specificity: 1-0.22 = 0.78
Based on Mann-Whitney U test, the differences in gene expression between responders and non-responders is significant (p-value 4.1e-18)<br>