PPT-1 Identifying differentially expressed genes from RNA-
Author : liane-varnes | Published Date : 2018-02-03
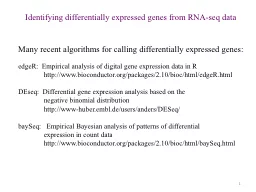
seq data Many recent algorithms for calling differentially expressed genes edgeR Empirical analysis of digital gene expression data in R http wwwbioconductororg
Presentation Embed Code
Download Presentation
Download Presentation The PPT/PDF document "1 Identifying differentially expressed g..." is the property of its rightful owner. Permission is granted to download and print the materials on this website for personal, non-commercial use only, and to display it on your personal computer provided you do not modify the materials and that you retain all copyright notices contained in the materials. By downloading content from our website, you accept the terms of this agreement.
1 Identifying differentially expressed genes from RNA-: Transcript
Download Rules Of Document
"1 Identifying differentially expressed genes from RNA-"The content belongs to its owner. You may download and print it for personal use, without modification, and keep all copyright notices. By downloading, you agree to these terms.
Related Documents