Sales Tax Forecasting Does One Size Fit All? Town
Author : myesha-ticknor | Published Date : 2025-06-27
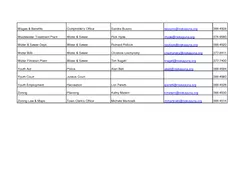
Description: Sales Tax Forecasting Does One Size Fit All Town of Queen Creek City of Phoenix City of Glendale 1 Queen Creek 2 Introduction Scott McCarty Finance Director scottmccartyqueencreekorg 4803583170 3 Data Sources Demographic Information
Presentation Embed Code
Download Presentation
Download
Presentation The PPT/PDF document
"Sales Tax Forecasting Does One Size Fit All? Town" is the property of its rightful owner.
Permission is granted to download and print the materials on this website for personal, non-commercial use only,
and to display it on your personal computer provided you do not modify the materials and that you retain all
copyright notices contained in the materials. By downloading content from our website, you accept the terms of
this agreement.
Transcript:Sales Tax Forecasting Does One Size Fit All? Town:
Sales Tax Forecasting Does One Size Fit All? Town of Queen Creek City of Phoenix City of Glendale 1 Queen Creek 2 Introduction Scott McCarty, Finance Director scott.mccarty@queencreek.org 480-358-3170 3 Data Sources Demographic Information Population Projections DOR Community and Economic Development departments External analyses RL Brown Housing Data – Magic Tool Subscription Joint Legislative Budget Committee City of Phoenix Tax B.I. 4 5 Demographic Overview Population Projections Fast Growing Community Current Population = 52K Buildout Population = 175K 10-Year Projection = 88K (+36K, 70%) 6 Models, Tools, and Processes Fast Growing Community Sales Tax is Our Largest Revenue Source Utilize additional sales taxes for CIP needs 7 Models, Tools, and Processes (continued) Non-Residential Taxable Retail and Restaurant and Bar Study Potential Impact Fee Credit Analysis (per Impact Fee law) Recessionary Sensitivity Analysis Annexation Economic Impact Studies Encanterra – Occupied Subdivision Arizona State Lands 8 Models, Tools, and Processes (continued) Non-Residential Spending Study conclusions (2018 data) Evaluated taxable retail and restaurant and bar sales in Queen Creek and how much spending is occurring by non-residents Non-residents contributed approximately $5.4 million in sales tax revenue in fiscal year 2018 38% of taxable retail sales and 47% of restaurant and bar sales are estimated to come from non-residents Leakage of spending by Town residents for electronics, autos, furniture, and entertainment 9 Models, Tools, and Processes (continued) Development Fee Credit Analysis Assess potential revenue that may be generated from new development within the Town – should that revenue be viewed as a credit against imposed development fees Any revenue generated from new development will be used for operations, maintenance, repair, and replacement of existing facilities New development occurring in the Town will not pay twice for the cost of growth-related facilities Receipt of new revenue does not mean it’s net new revenue 10 Models, Tools, and Processes (continued) Recessionary Sensitivity Analysis & Strategic Planning Sales taxes are largest revenue source – how to improve/maintain sales tax growth Rate comparisons with surrounding communities – examine opportunities to prevent leakage Strategies Median forecast and recessionary forecast Zoning Incentives 11 Collaboration with Other Departments Strong emphasis on construction sales tax activity & permitting Community Development New development projections Track permits on monthly basis, certificates of occupancy for revenue collections Analyze potential annexations and impacts of zoning changes Economic Development New development economic impact studies Potential commercial development permits and square footage 12 Sales Tax Database Access database