Sir, could you explain the SIR? Dana Burshell, MPH, CPH, CIC Andrea Alvarez, MPH Healthcare-Associated Infections Program Virginia Department of Health June 2012 What is a standardized infection ratio? The standardized infection ratio (SIR)
"Sir, could you explain the SIR? Dana Burshell," is the property of its rightful owner. Permission is granted to
download and print the materials on this website for personal, non-commercial use only, and to display it
on your personal computer provided you do not modify the materials and that you retain all copyright
notices contained in the materials. By downloading content from our website, you accept the terms of this
agreement.
Presentation Transcript
01
Sir, could you explain the SIR? Dana Burshell, MPH, CPH, CIC
Andrea Alvarez, MPH
Healthcare-Associated Infections Program
Virginia Department of Health
June 2012<br>
02
What is a standardized infection ratio? The standardized infection ratio (SIR) is a summary measure used to track healthcare-associated infections (HAIs) at a national, state, or local level over time. The SIR adjusts for patients of varying risk within each facility.
- The National Healthcare Safety Network (NHSN)<br>
03
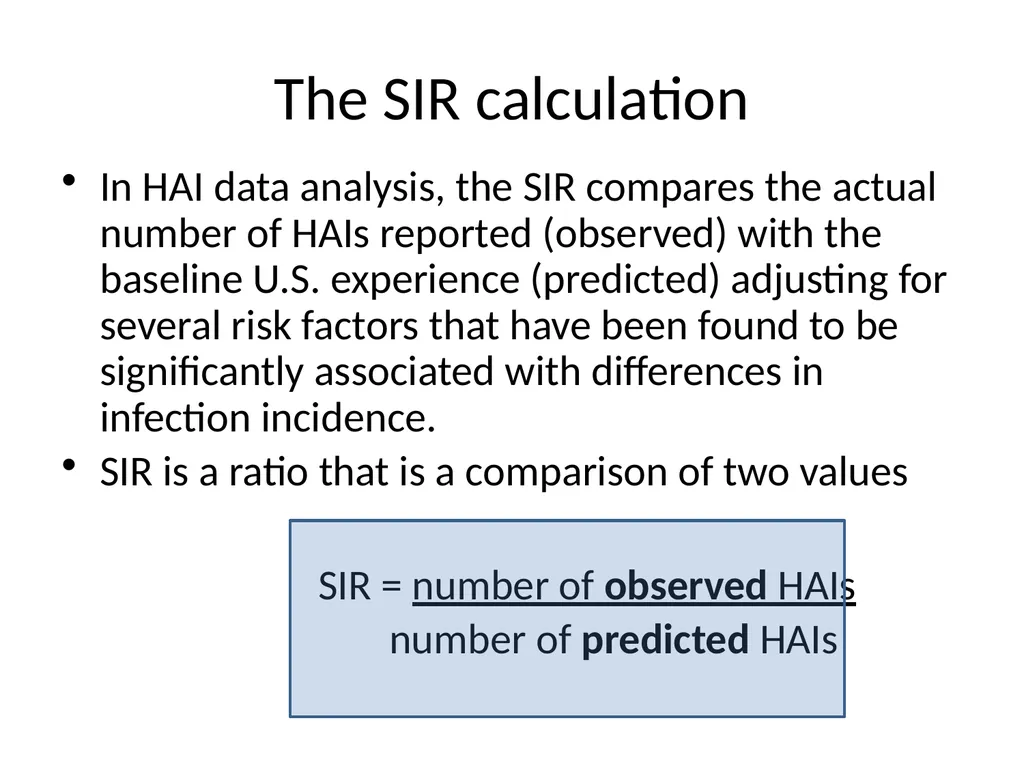
The SIR calculation In HAI data analysis, the SIR compares the actual number of HAIs reported (observed) with the baseline U.S. experience (predicted) adjusting for several risk factors that have been found to be significantly associated with differences in infection incidence.
SIR is a ratio that is a comparison of two values
SIR = number of observed HAIs
number of predicted HAIs<br>
04
What is the “baseline U.S. experience”? 2006-2008 NHSN aggregate data are used as the standard population and considered to be the baseline U.S. experience for the SIR calculations.
NHSN baseline data used in an SIR are used to calculate the predicted number of HAIs adjusting for the identified risk factors.<br>
05
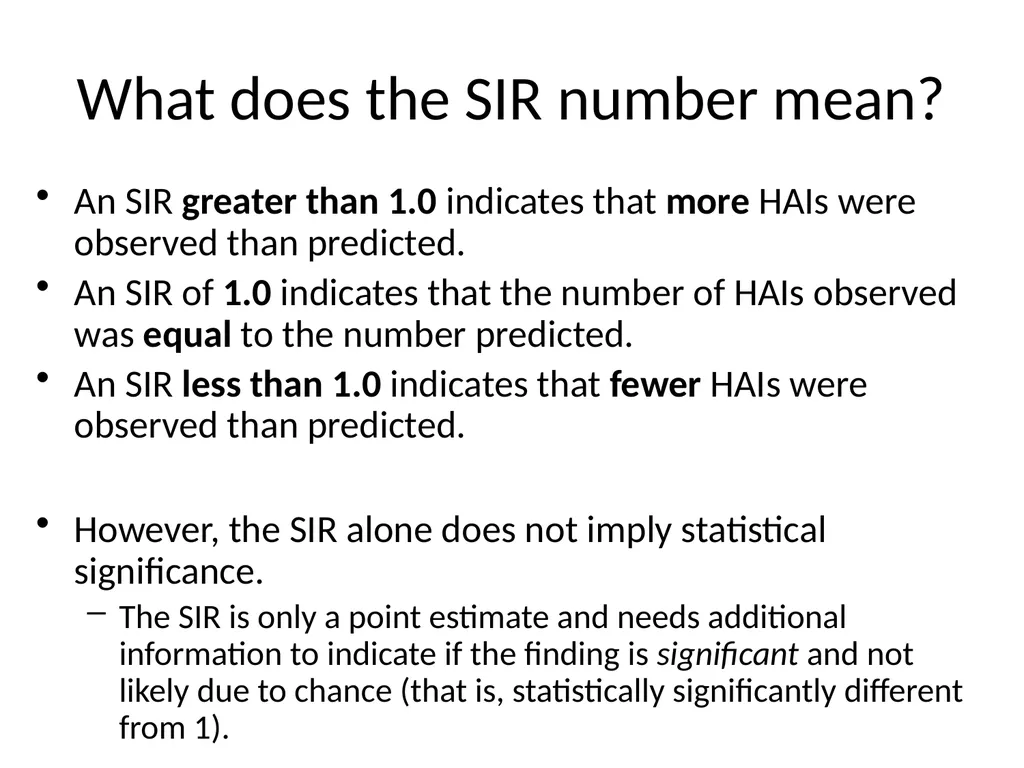
What does the SIR number mean? An SIR greater than 1.0 indicates that more HAIs were observed than predicted.
An SIR of 1.0 indicates that the number of HAIs observed was equal to the number predicted.
An SIR less than 1.0 indicates that fewer HAIs were observed than predicted.
However, the SIR alone does not imply statistical significance.
The SIR is only a point estimate and needs additional information to indicate if the finding is significant and not likely due to chance (that is, statistically significantly different from 1).<br>
06
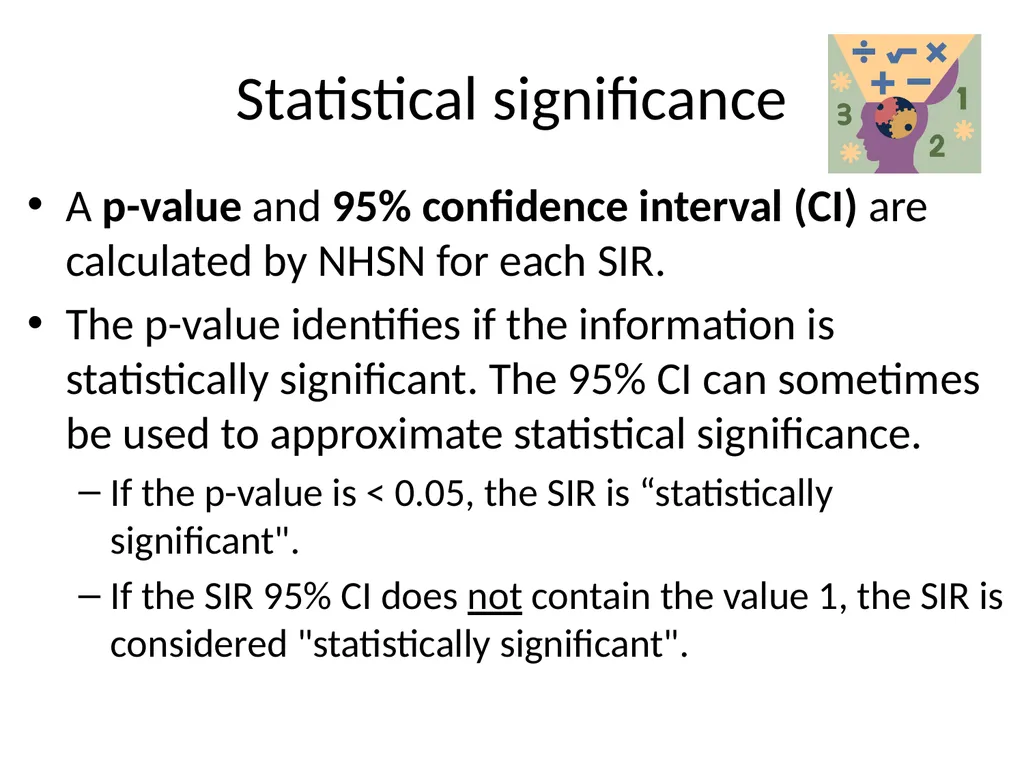
Statistical significance A p-value and 95% confidence interval (CI) are calculated by NHSN for each SIR.
The p-value identifies if the information is statistically significant. The 95% CI can sometimes be used to approximate statistical significance.
If the p-value is < 0.05, the SIR is “statistically significant".
If the SIR 95% CI does not contain the value 1, the SIR is considered "statistically significant".<br>
07
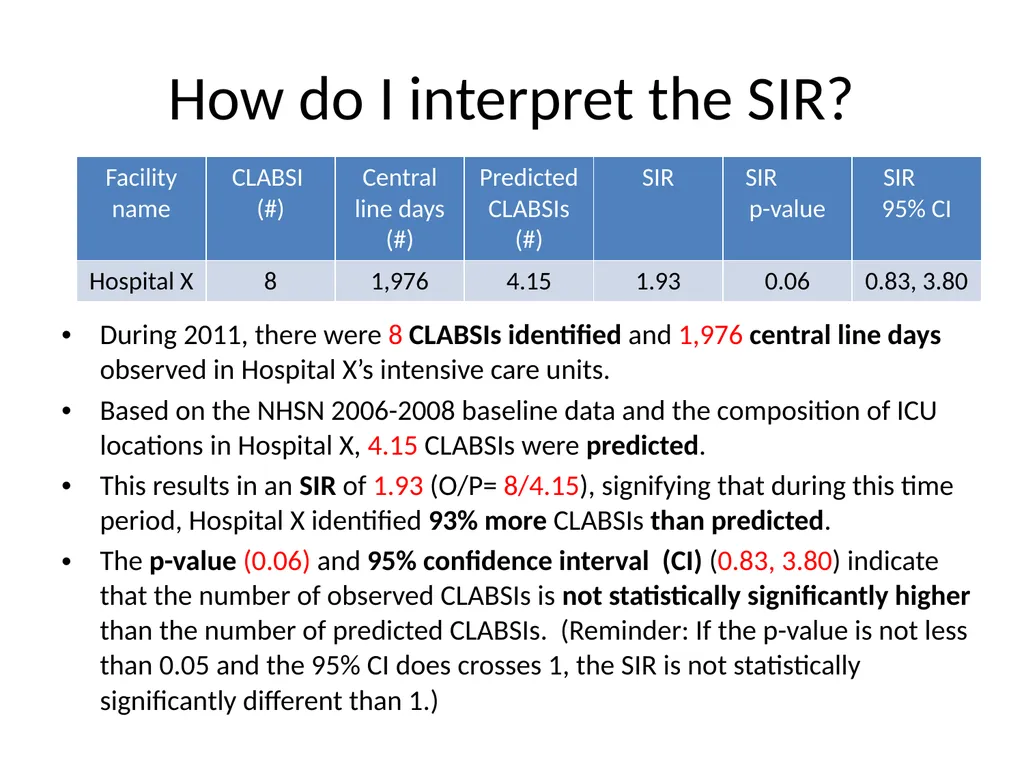
How do I interpret the SIR? During 2011, there were 8 CLABSIs identified and 1,976 central line days observed in Hospital X’s intensive care units.
Based on the NHSN 2006-2008 baseline data and the composition of ICU locations in Hospital X, 4.15 CLABSIs were predicted.
This results in an SIR of 1.93 (O/P= 8/4.15), signifying that during this time period, Hospital X identified 93% more CLABSIs than predicted.
The p-value (0.06) and 95% confidence interval (CI) (0.83, 3.80) indicate that the number of observed CLABSIs is not statistically significantly higher than the number of predicted CLABSIs. (Reminder: If the p-value is not less than 0.05 and the 95% CI does crosses 1, the SIR is not statistically significantly different than 1.)<br>
08
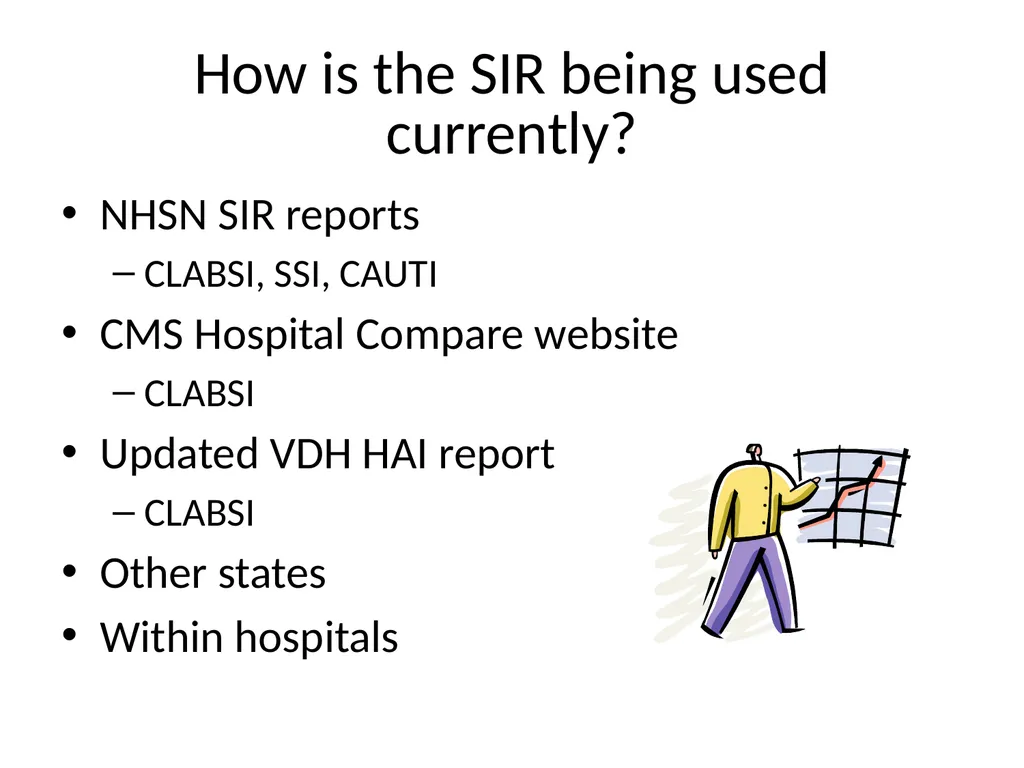
How is the SIR being used currently? NHSN SIR reports
CLABSI, SSI, CAUTI
CMS Hospital Compare website
CLABSI
Updated VDH HAI report
CLABSI
Other states
Within hospitals<br>
09
Benefits of using the SIR Single metric
One number that can be used to make comparisons
Scalable
National, regional, facility-wide, location-specific, by surgeon for SSIs, etc.
Can combine the SIR values at any level of aggregation
Can perform more detailed comparisons within any individual risk group
Risk-adjusted
Adjusts for factors known to be associated with differences in HAI rates
Risk-adjustment differs between types of HAIs and types of surgical procedures - HHS HAI Action Plan - http://www.hhs.gov/ash/initiatives/hai/appendices.html#appendix_g_comparison<br>
10
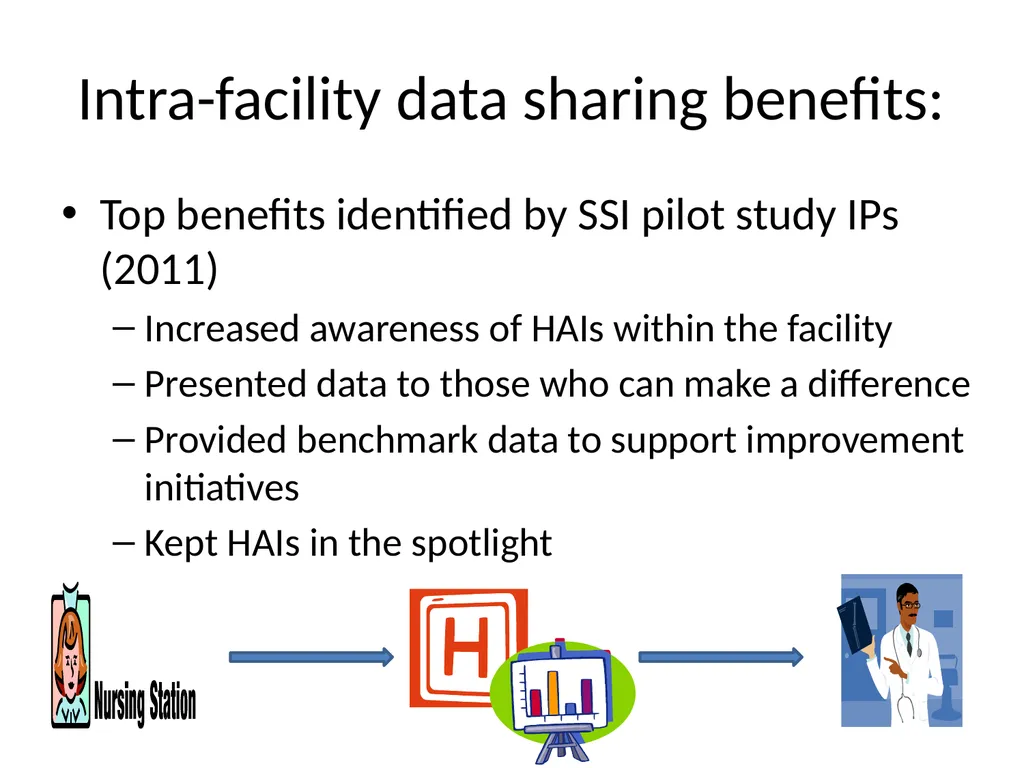
Intra-facility data sharing benefits: Top benefits identified by SSI pilot study IPs (2011)
Increased awareness of HAIs within the facility
Presented data to those who can make a difference
Provided benchmark data to support improvement initiatives
Kept HAIs in the spotlight<br>
11
Sharing the SIR with hospital leadership: One IP’s experience Reasons IP decided to educate hospital staff:
Hospital Compare website was using the SIR
VDH had started using the SIR
Corporate 2011 report used SIR
Important leadership staff members to educate:
Leadership in IP (Chairman, Chief Nursing personnel, Quality Director)
Presentation included:
Explanation of SIR and example calculation
Hospital Compare screenshot
Examples of CLABSI corporate SIRs compared with CLABSI rates
Tables from VDH newsletter comparing CLABSI rates from 2009-11 next to SIRs.
NHSN data summary reports to show where comparative data comes from<br>
12
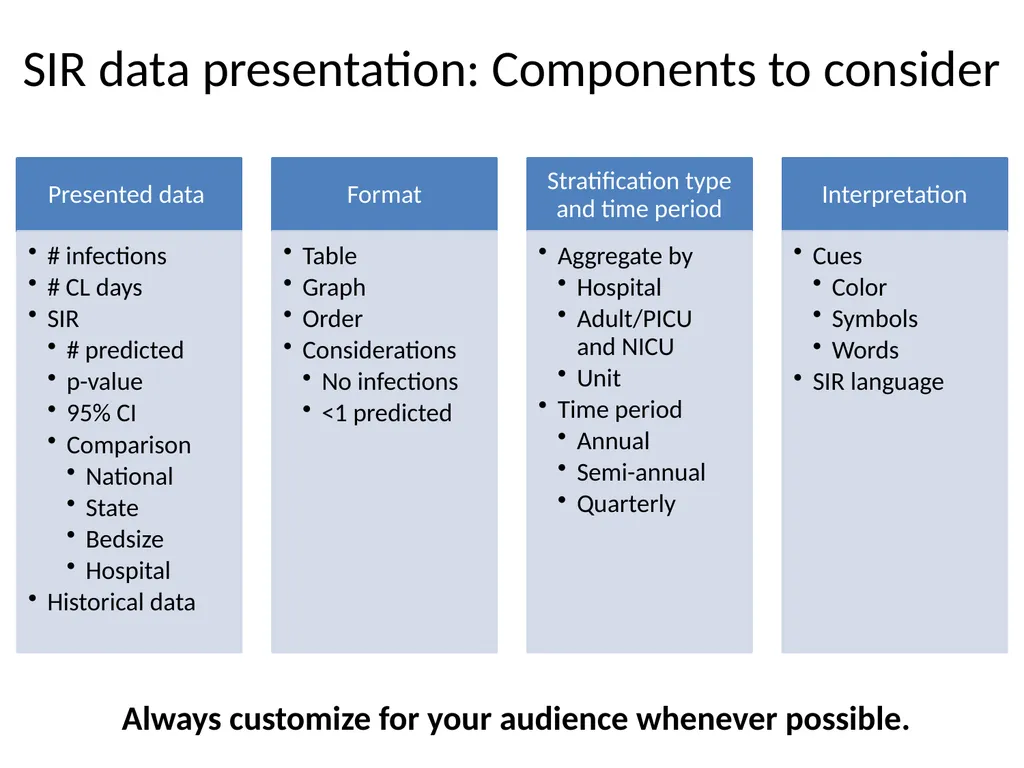
SIR data presentation: Components to consider Always customize for your audience whenever possible.<br>
13
Customizing the data: What numbers? Number of infections
Number of central line days
SIR
Number of infections predicted
p-value
95% confidence interval
Comparison data
National
State
Other hospitals in same bedsize category
Hospital
Historical data<br>
14
Customizing the data: What format? Table
Graph
Order
Alphabetical by unit
Highest to lowest SIR
How will you account for the situation where:
There are no infections?
<1 infection is predicted?<br>
15
Customizing the data: What setting and time period? Setting
Hospital
Adult/pediatric ICU and neonatal ICU
Unit
Time period
Annual
Semi-annual
Quarterly
Monthly<br>
16
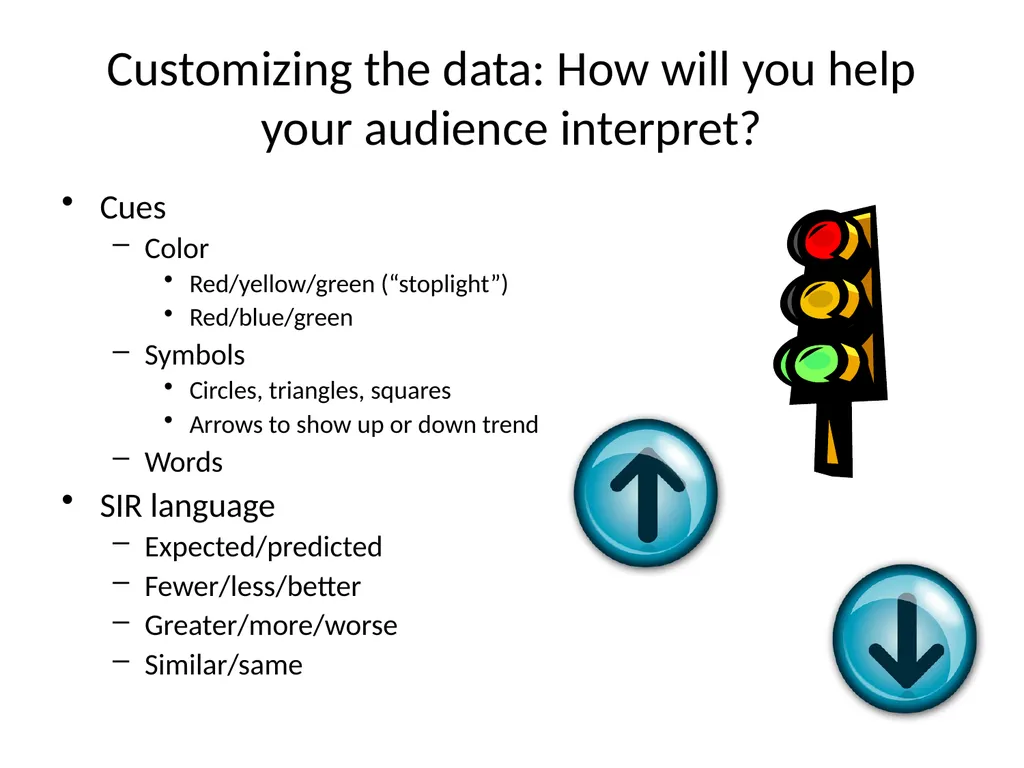
Customizing the data: How will you help your audience interpret? Cues
Color
Red/yellow/green (“stoplight”)
Red/blue/green
Symbols
Circles, triangles, squares
Arrows to show up or down trend
Words
SIR language
Expected/predicted
Fewer/less/better
Greater/more/worse
Similar/same<br>
17
Questions? Dana.Burshell@vdh.virginia.gov Andrea.Alvarez@vdh.virginia.gov To speak to any member of the VDH HAI Team: 804-864-8141<br>
18
SIR 101 and 201 available online SIR 101: Interpretation and public reporting
Reviewed basic SIR calculation and interpretation
Introduced publicly available SIR reports
NHSN, Hospital Compare, Virginia Department of Health
SIR 201: Calculating the measure, generating reports, and presenting the data
Nuts and bolts, step-by-step presentation for IPs
Archived and available at: http://www.vdh.virginia.gov/epidemiology/ surveillance/hai/communication.htm<br>
19
SIR and surveillance resources NHSN e-News: SIRs Special Edition
http://www.cdc.gov/nhsn/PDFs/Newsletters/ NHSN_NL_OCT_2010SE_final.pdf
VDH HAI website – Surveillance
http://www.vdh.virginia.gov/Epidemiology/ Surveillance/HAI/SurveillanceReporting.htm<br>