So You Want To Perform Internal Benchmarking Presentation Series: The Effective Use of Workload and Productivity Systems in Health-System Pharmacy Prepared for ASHP members by the Section of Pharmacy Practice Managers Advisory Group on
"So You Want To Perform Internal Benchmarking" is the property of its rightful owner. Permission is granted to
download and print the materials on this website for personal, non-commercial use only, and to display it
on your personal computer provided you do not modify the materials and that you retain all copyright
notices contained in the materials. By downloading content from our website, you accept the terms of this
agreement.
Presentation Transcript
01
So You Want To Perform Internal Benchmarking Presentation Series: The Effective Use of Workload and Productivity Systems in Health-System Pharmacy<br>
02
Prepared for ASHP members by the Section of Pharmacy Practice Managers Advisory Group on Pharmacy Business Management<br>
03
Objective The objective of this presentation is to create a list of actions for a pharmacy director to perform to implement or improve an internal benchmarking system<br>
04
Goals To be able to define what internal benchmarking is, and what advantages can be derived from performing this function
To be able to develop the data sources necessary
To be able to use the data to develop operational information, to track and trend workload
To be able to communicate the outcomes of internal benchmarking to senior leadership<br>
05
Step 1 – What is Internal Benchmarking? Internal benchmarking is best defined as the process of measuring your current performance against your historical performance
Provides a measure of self-comparison over time
Internal benchmarking can be done against
Quality measures
Workload measures
Financial measures<br>
06
Step 2 – Why Internal Benchmarking? This is the ONLY process that compares your performance to a known entity – you!
Minimizes the variables
Allows for control of some of the variables
Allows measurement of issues unique to you and your shop
Allows you to measure the impact of changes over time thus allowing for the elimination of changes that failed to product the desired level of change<br>
07
Step 3 - Barriers Requires commitment and work
Acquisition of data – baseline and ongoing
Development of a consistent set of measurements
You must determine
What you MUST measure
What you CAN measure
How to deal with variables
You must develop a framework within which to
Store the data
Assess and analyze the data
Make decisions based on the data
Implement changes to drive the data in desired directions
How to communicate identified trends or issues to your department, and to senior leadership<br>
08
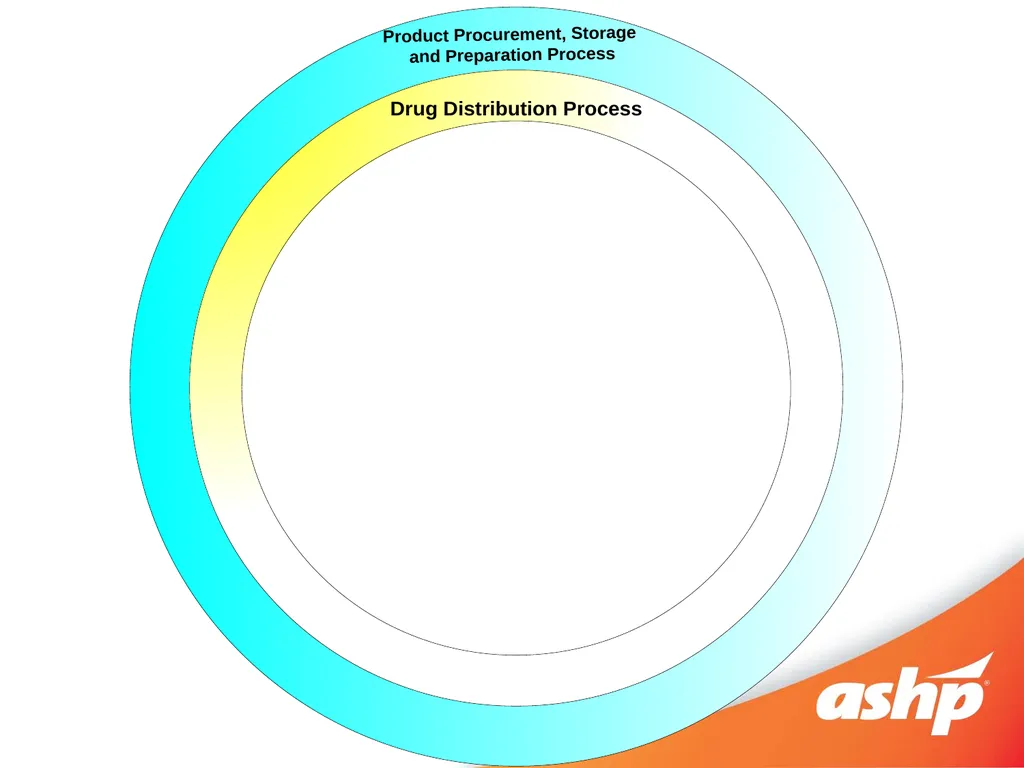
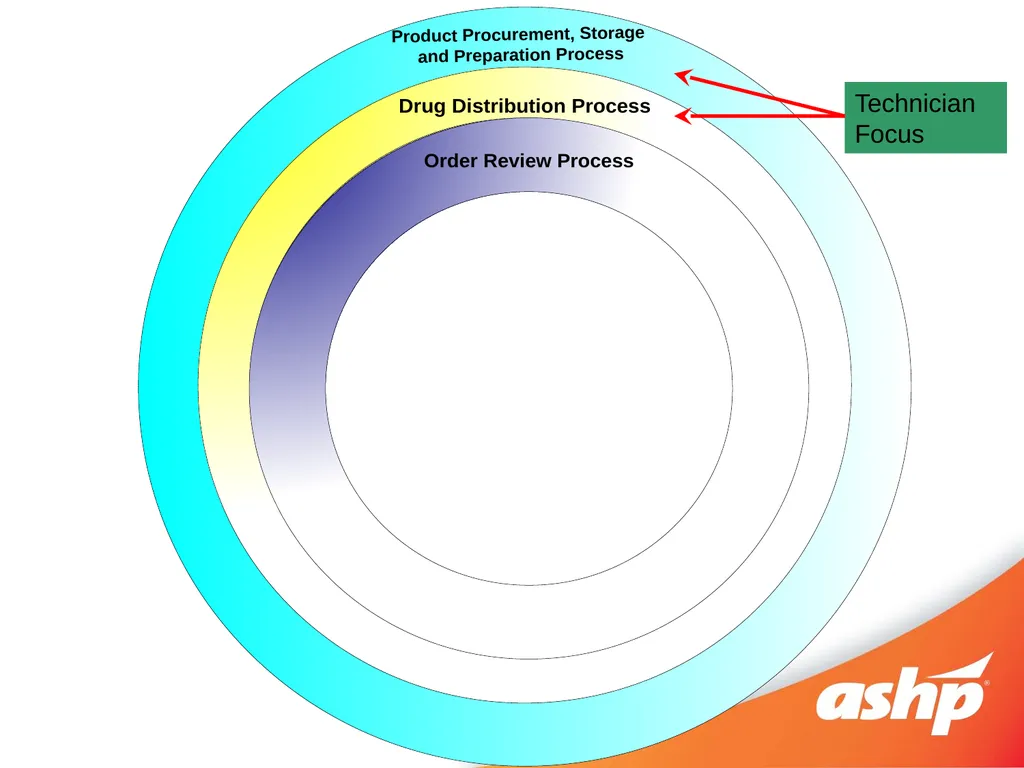
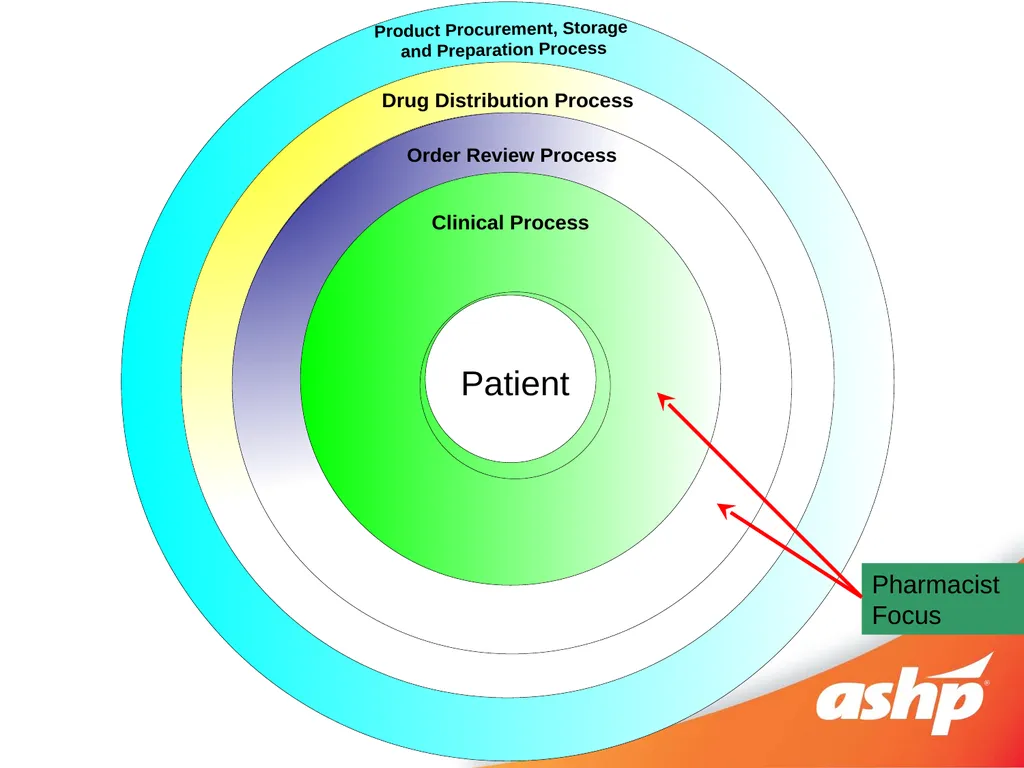
Step 4 – A Recommended Framework Consider measures that address the Four Core Processes on a hospital pharmacy
Product Procurement, Storage and Preparation Process
Drug Distribution
Order Management
Clinical Involvement
Know the processes and how to measure the various components of each<br>
09
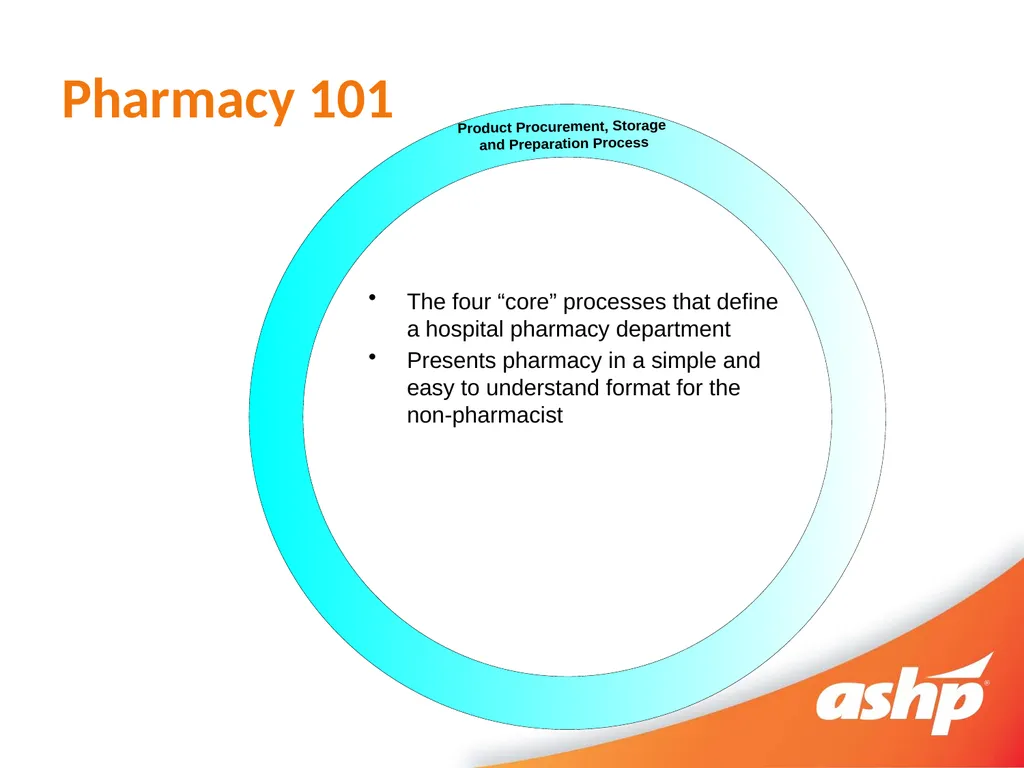
Pharmacy 101 The four “core” processes that define a hospital pharmacy department
Presents pharmacy in a simple and easy to understand format for the non-pharmacist<br>
10
Technician Focus<br>
11
Pharmacist Focus<br>
12
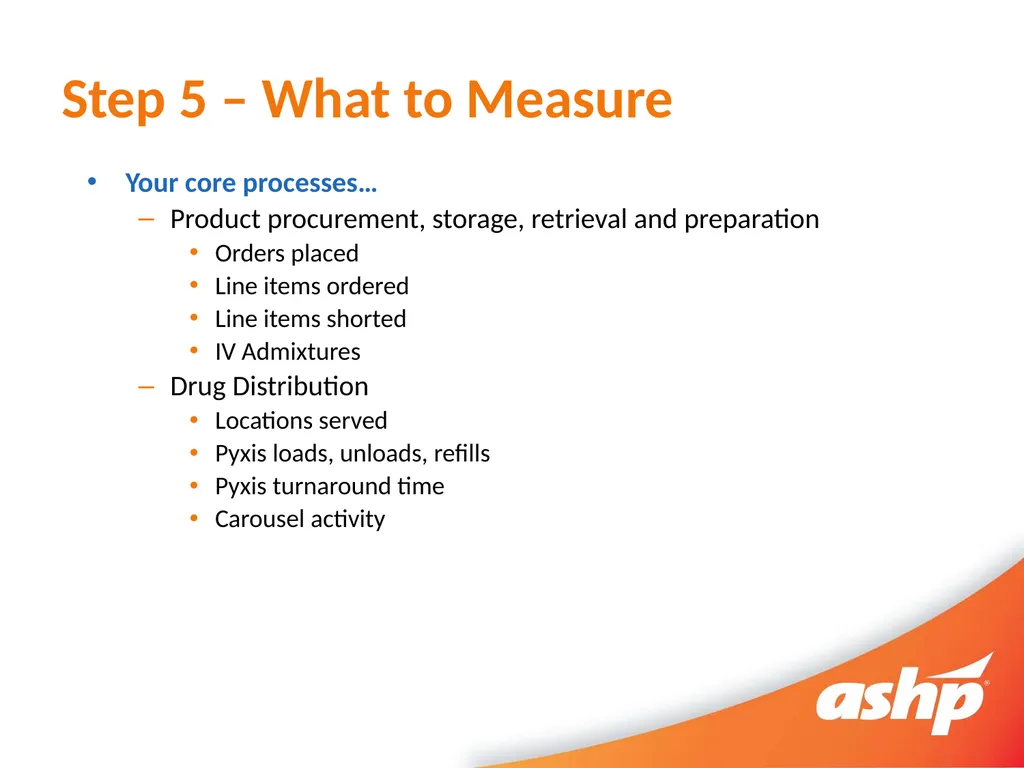
Step 5 – What to Measure Your core processes…
Product procurement, storage, retrieval and preparation
Orders placed
Line items ordered
Line items shorted
IV Admixtures
Drug Distribution
Locations served
Pyxis loads, unloads, refills
Pyxis turnaround time
Carousel activity<br>
13
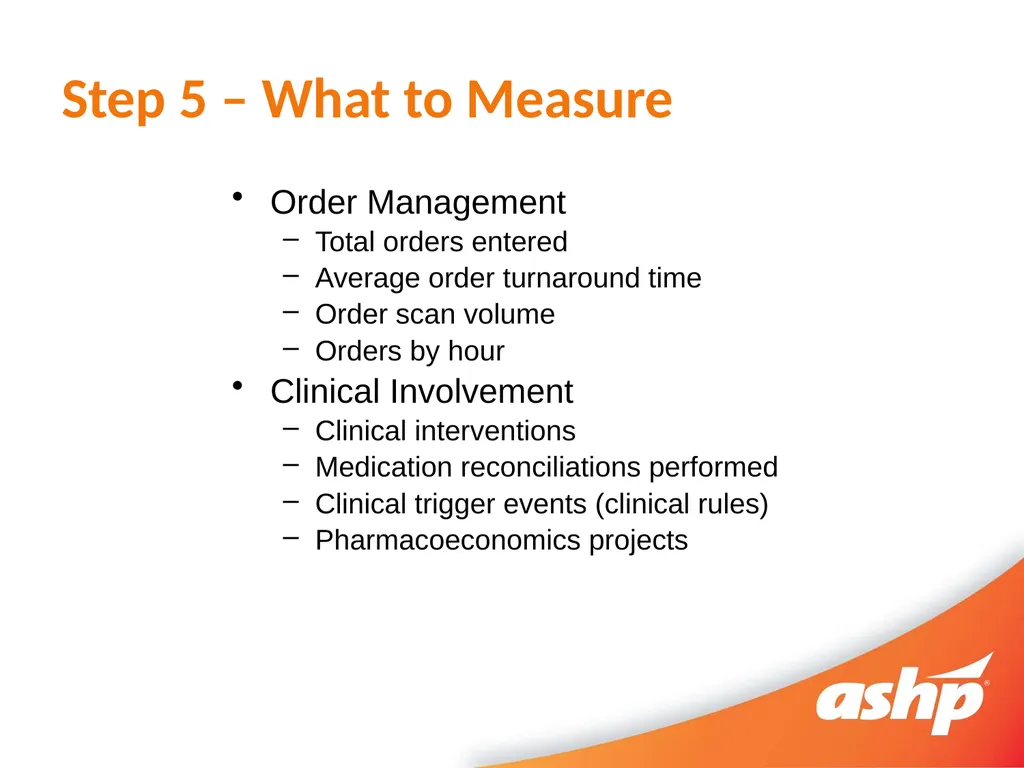
Step 5 – What to Measure Order Management
Total orders entered
Average order turnaround time
Order scan volume
Orders by hour
Clinical Involvement
Clinical interventions
Medication reconciliations performed
Clinical trigger events (clinical rules)
Pharmacoeconomics projects<br>
14
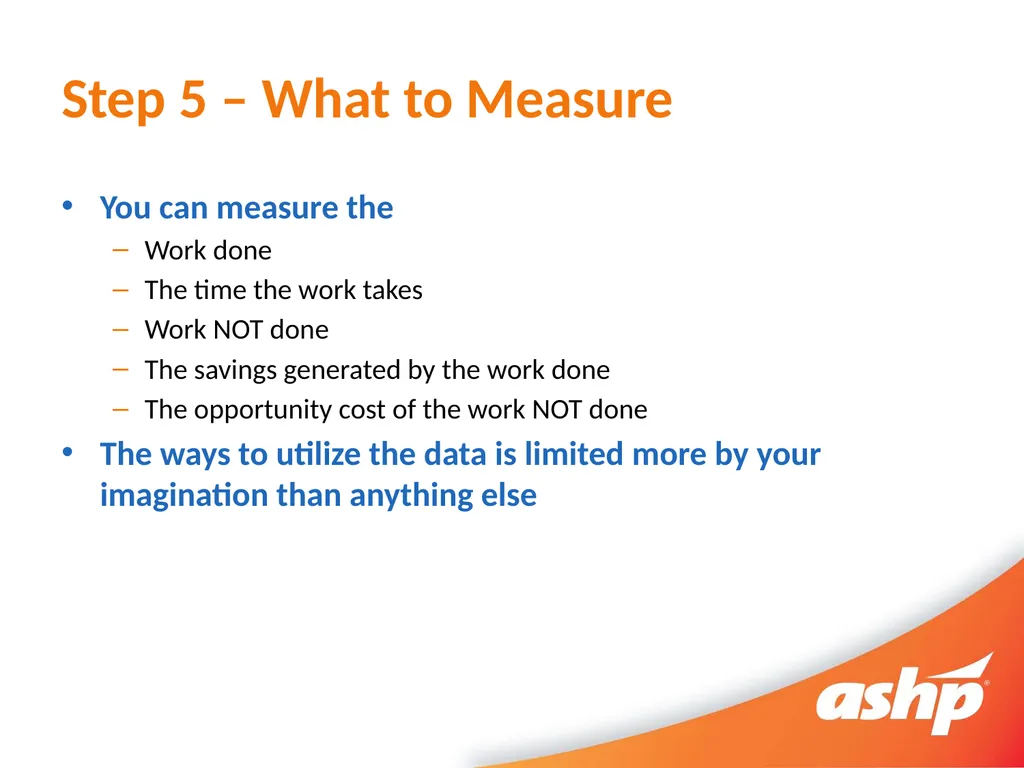
Step 5 – What to Measure You can measure the
Work done
The time the work takes
Work NOT done
The savings generated by the work done
The opportunity cost of the work NOT done
The ways to utilize the data is limited more by your imagination than anything else<br>
15
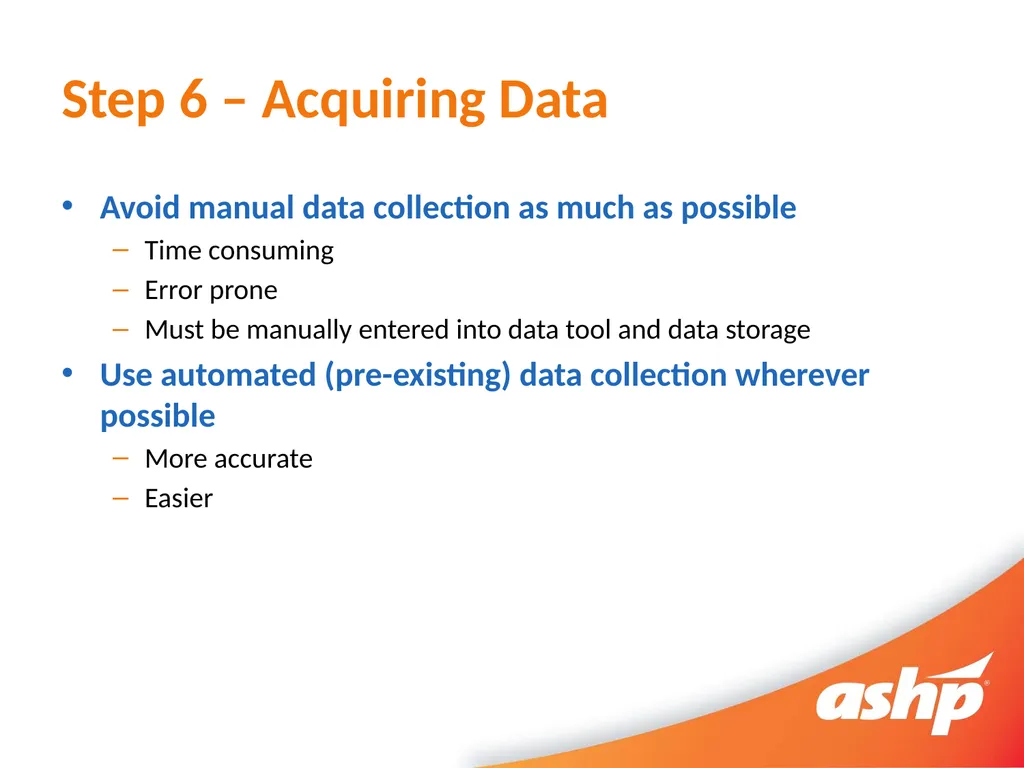
Step 6 – Acquiring Data Avoid manual data collection as much as possible
Time consuming
Error prone
Must be manually entered into data tool and data storage
Use automated (pre-existing) data collection wherever possible
More accurate
Easier<br>
16
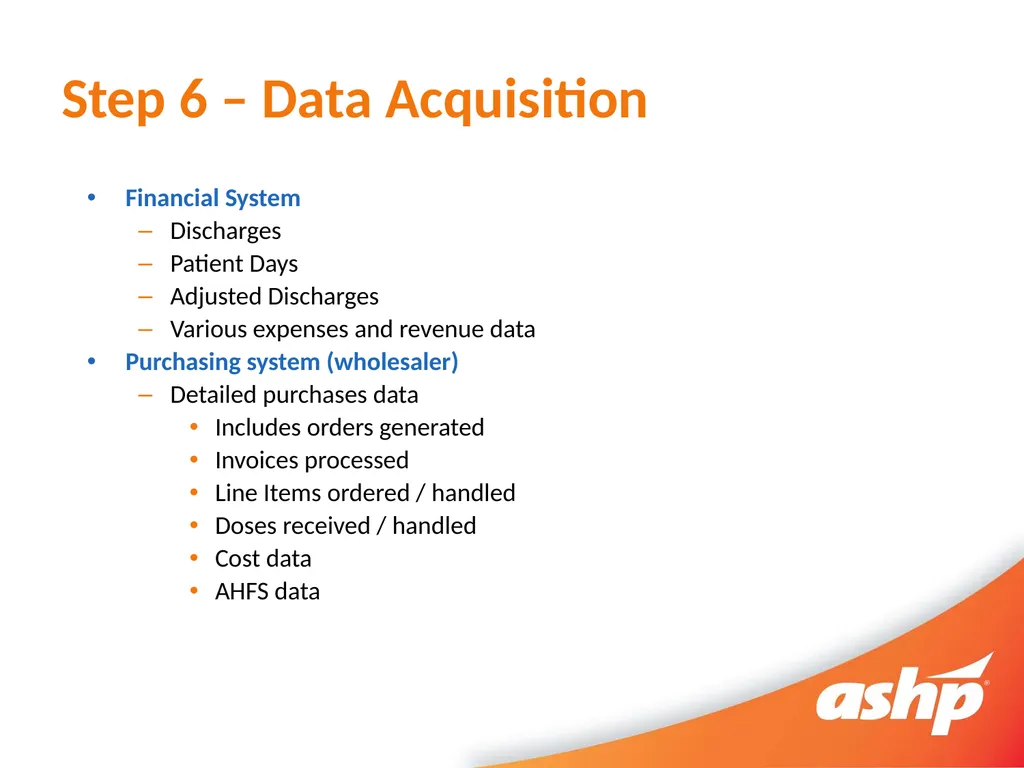
Step 6 – Data Acquisition Financial System
Discharges
Patient Days
Adjusted Discharges
Various expenses and revenue data
Purchasing system (wholesaler)
Detailed purchases data
Includes orders generated
Invoices processed
Line Items ordered / handled
Doses received / handled
Cost data
AHFS data<br>
17
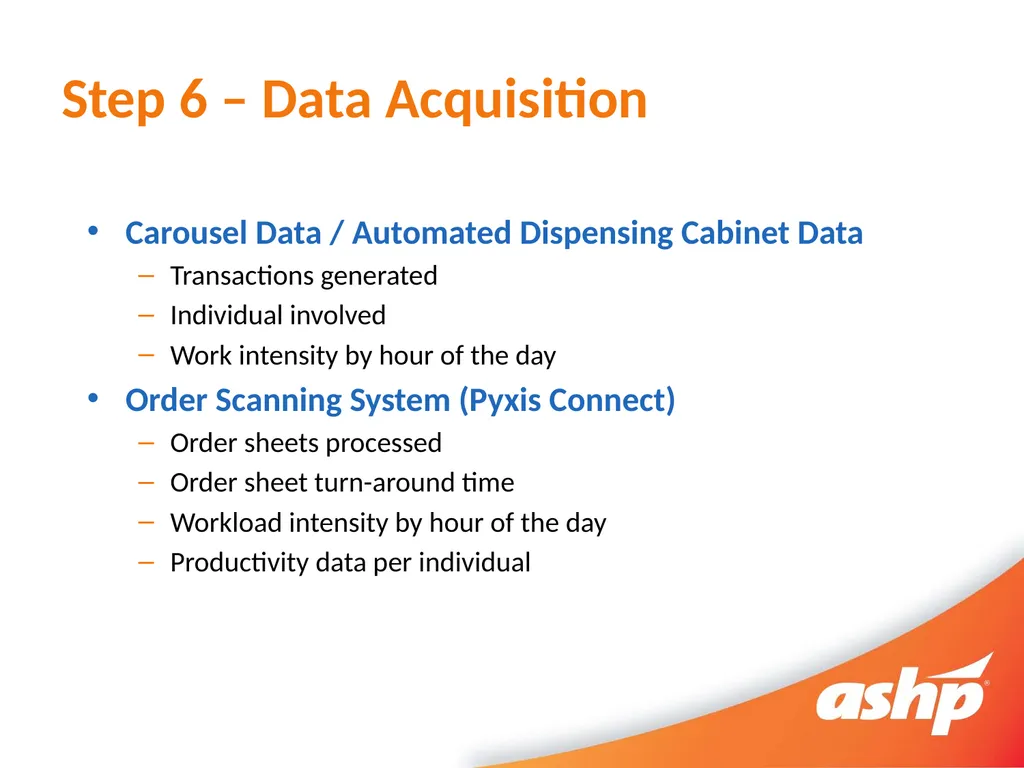
Step 6 – Data Acquisition Carousel Data / Automated Dispensing Cabinet Data
Transactions generated
Individual involved
Work intensity by hour of the day
Order Scanning System (Pyxis Connect)
Order sheets processed
Order sheet turn-around time
Workload intensity by hour of the day
Productivity data per individual<br>
18
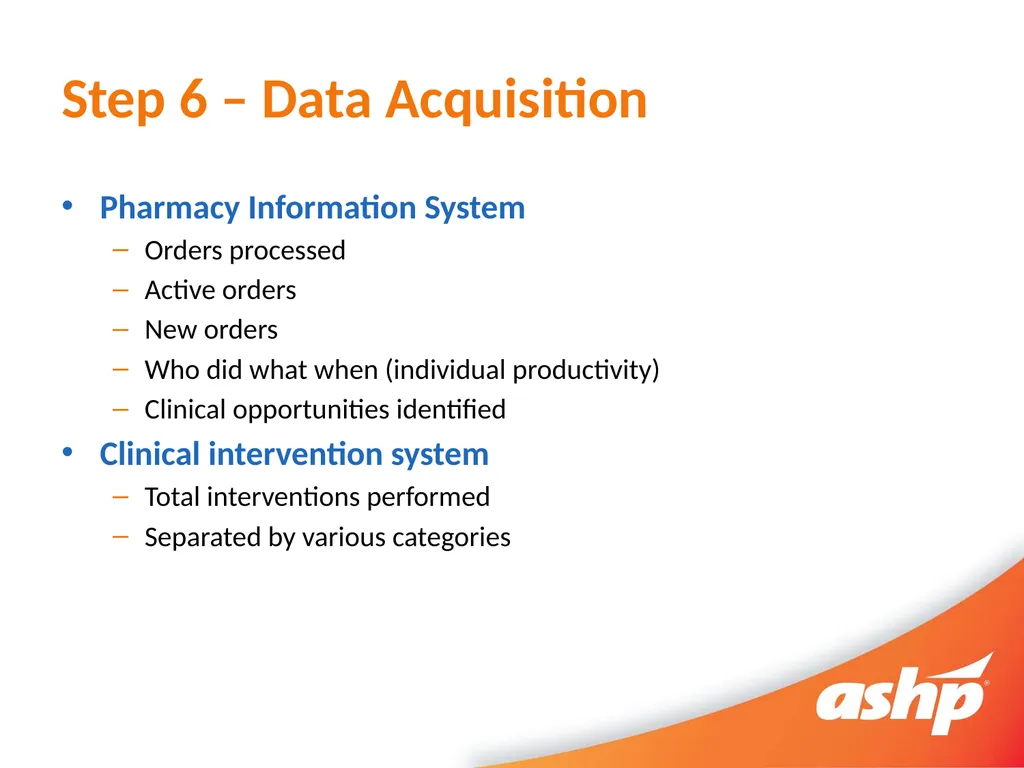
Step 6 – Data Acquisition Pharmacy Information System
Orders processed
Active orders
New orders
Who did what when (individual productivity)
Clinical opportunities identified
Clinical intervention system
Total interventions performed
Separated by various categories<br>
19
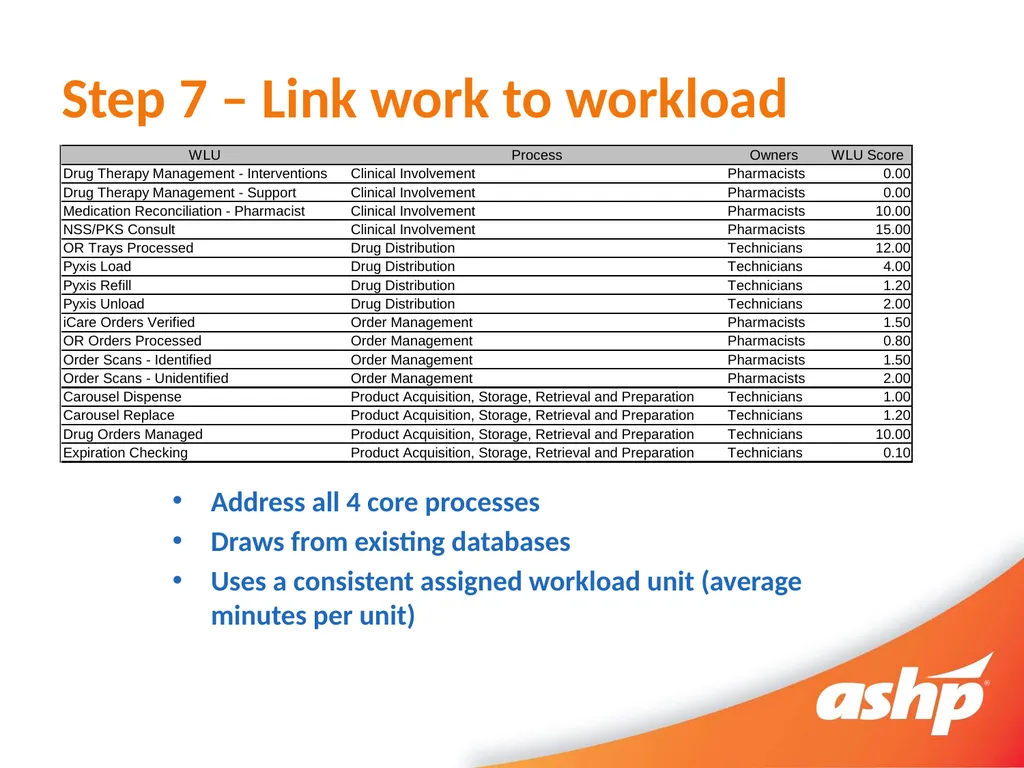
Step 7 – Link work to workload Address all 4 core processes
Draws from existing databases
Uses a consistent assigned workload unit (average minutes per unit)<br>
20
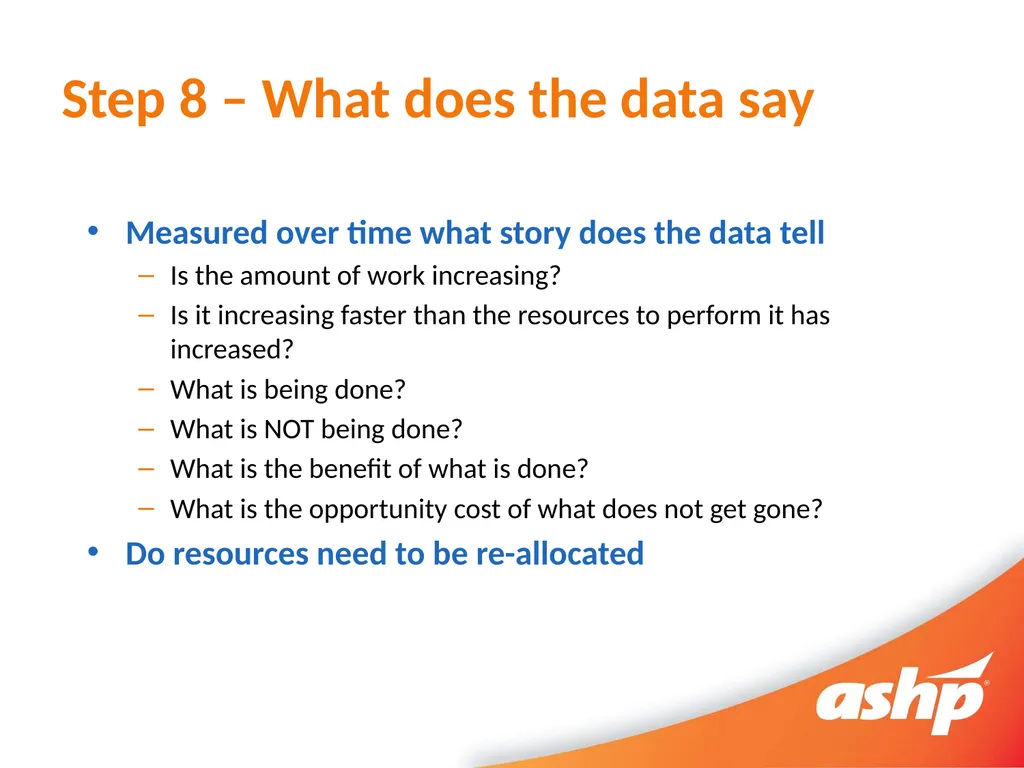
Step 8 – What does the data say Measured over time what story does the data tell
Is the amount of work increasing?
Is it increasing faster than the resources to perform it has increased?
What is being done?
What is NOT being done?
What is the benefit of what is done?
What is the opportunity cost of what does not get gone?
Do resources need to be re-allocated<br>
21
Step 9 - Communicate The point of any data collection should be to eventually share the data
Determine what the message of the data analysis is
Use the results of the data analysis to
Improve processes that need to be improved
Tell the success stories uncovered
Identify areas for action
If needed action requires a re-allocation of resources, then do so
If needed action required additional resources, then share the data<br>
22
Step 10 – Senior Leadership At some point, you will eventually uncover a need for additional resources
This will require the involvement of senior leadership
Use your data and the results of your data analysis to
Show that you understand the issue
Detail the magnitude of the issue
Show what options were considered
Resource re-allocation
Capitol options (automation / renovation)
Additional Manpower<br>
23
Step 10 – Senior Leadership Present the selected option
Use the data to make your point
Know your audience
Executive summary approach
Less is more
Deal with biases
Cover the opportunity costs of NOT doing something
Know how to counter the “data” that may be mentioned about external benchmarking processes
Be able to completely explain the working of your internal benchmarking process<br>
24
Summary Be familiar with the AHSP White Paper “The Effective Use of Workload and Productivity Systems in Health-System Pharmacy”
Understand how external and internal benchmarking works, the advantages and disadvantages of each
Understand how to collect, analyze and share data / information
Keep your leadership “in the loop”!<br>