04
Standardized infection ratio�Standardized utilization ratio 4<br>
05
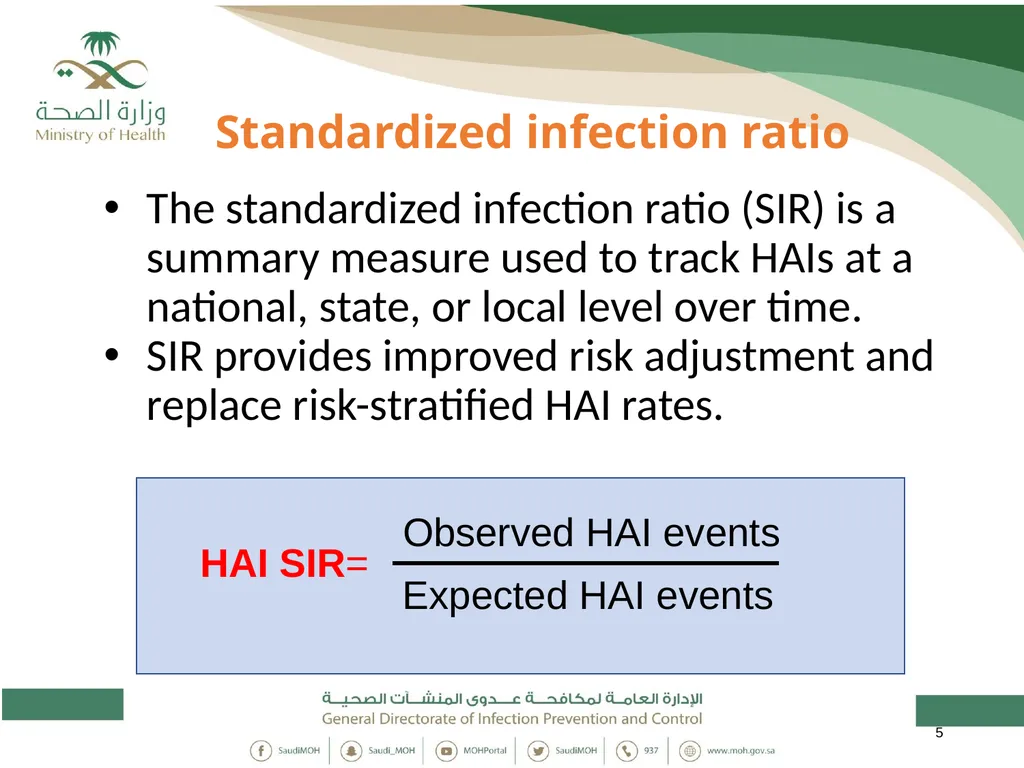
Standardized infection ratio The standardized infection ratio (SIR) is a summary measure used to track HAIs at a national, state, or local level over time.
SIR provides improved risk adjustment and replace risk-stratified HAI rates. 5 Observed HAI events Expected HAI events HAI SIR=<br>
06
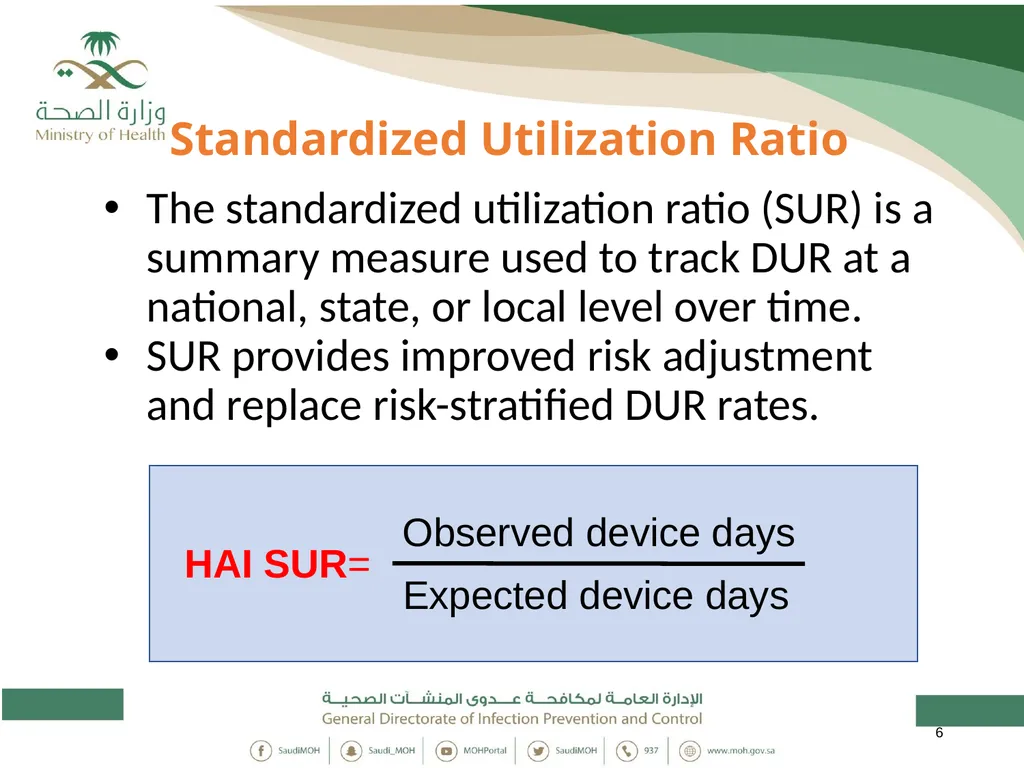
Standardized Utilization Ratio The standardized utilization ratio (SUR) is a summary measure used to track DUR at a national, state, or local level over time.
SUR provides improved risk adjustment and replace risk-stratified DUR rates. 6 Observed device days Expected device days HAI SUR=<br>
07
Standardized infection ratio 7<br>
08
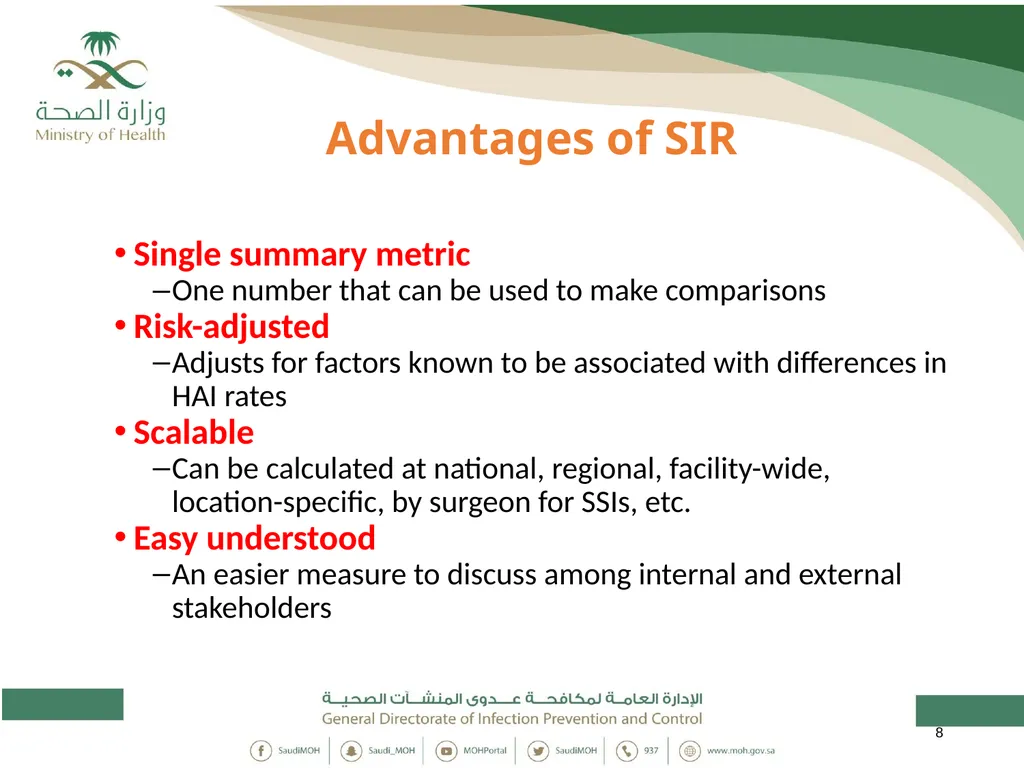
Advantages of SIR Single summary metric
One number that can be used to make comparisons
Risk-adjusted
Adjusts for factors known to be associated with differences in HAI rates
Scalable
Can be calculated at national, regional, facility-wide, location-specific, by surgeon for SSIs, etc.
Easy understood
An easier measure to discuss among internal and external stakeholders 8<br>
09
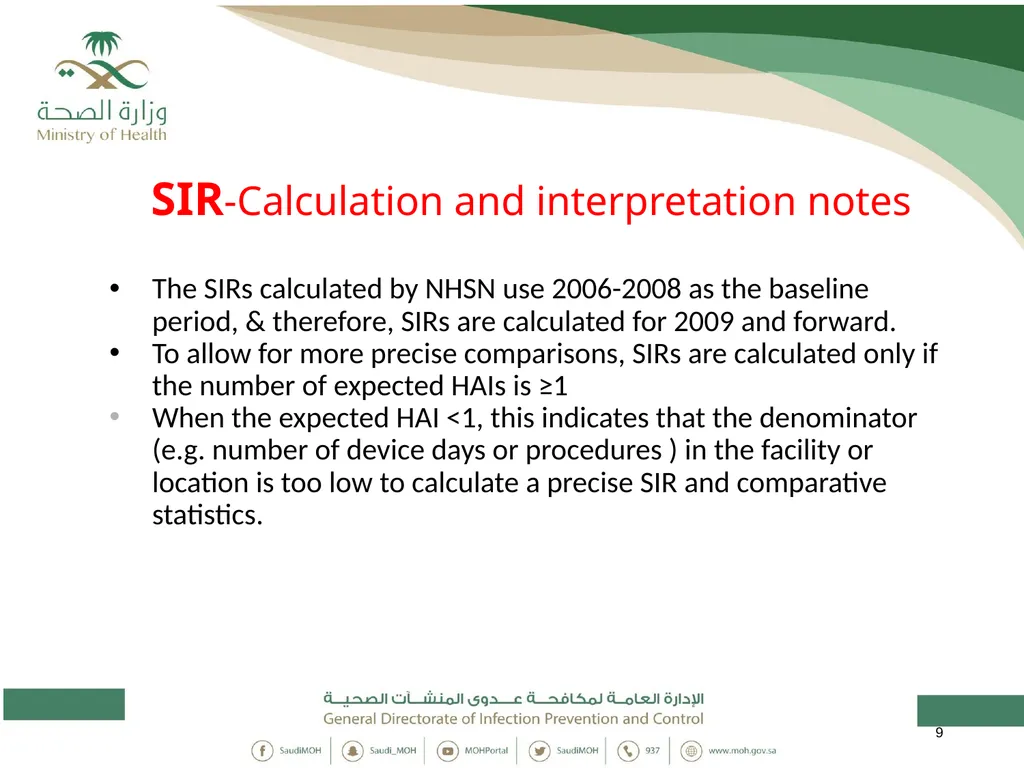
SIR-Calculation and interpretation notes The SIRs calculated by NHSN use 2006-2008 as the baseline period, & therefore, SIRs are calculated for 2009 and forward.
To allow for more precise comparisons, SIRs are calculated only if the number of expected HAIs is ≥1
When the expected HAI <1, this indicates that the denominator (e.g. number of device days or procedures ) in the facility or location is too low to calculate a precise SIR and comparative statistics. 9<br>
10
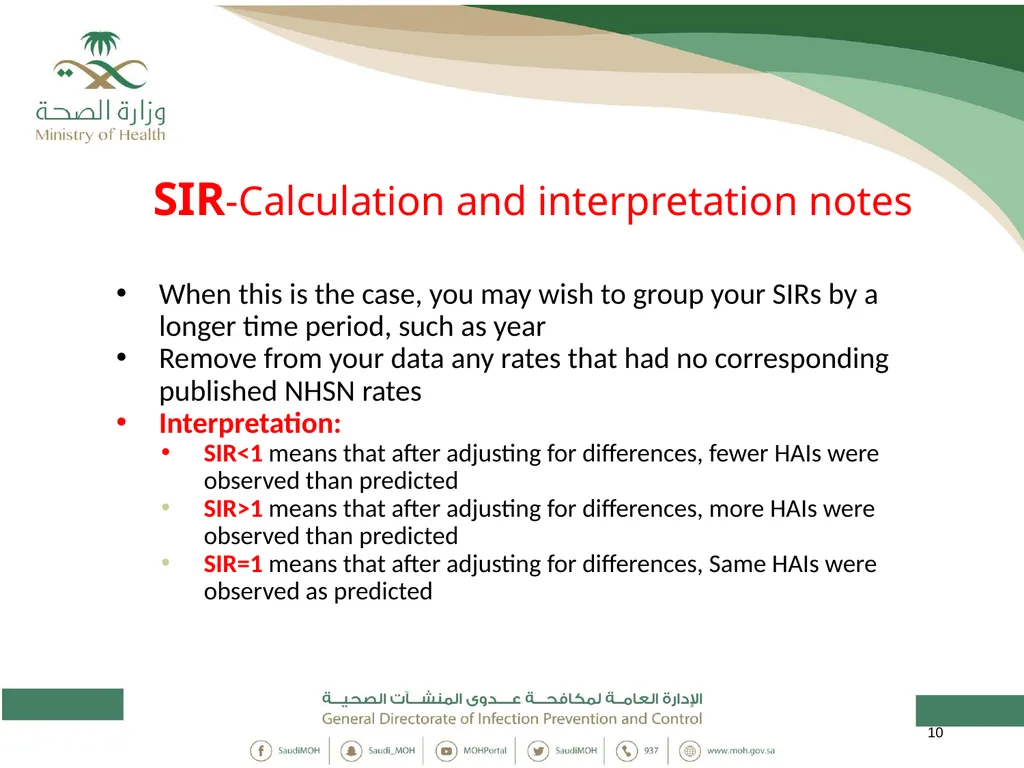
SIR-Calculation and interpretation notes When this is the case, you may wish to group your SIRs by a longer time period, such as year
Remove from your data any rates that had no corresponding published NHSN rates
Interpretation:
SIR<1 means that after adjusting for differences, fewer HAIs were observed than predicted
SIR>1 means that after adjusting for differences, more HAIs were observed than predicted
SIR=1 means that after adjusting for differences, Same HAIs were observed as predicted 10<br>
12
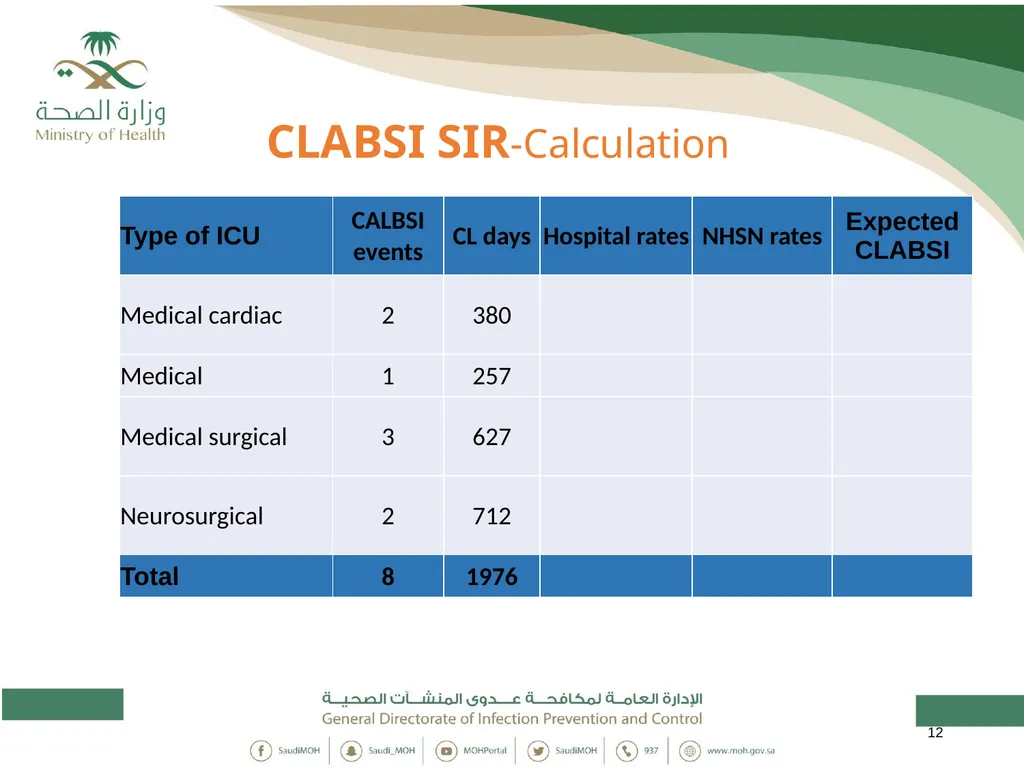
CLABSI SIR-Calculation 12<br>
13
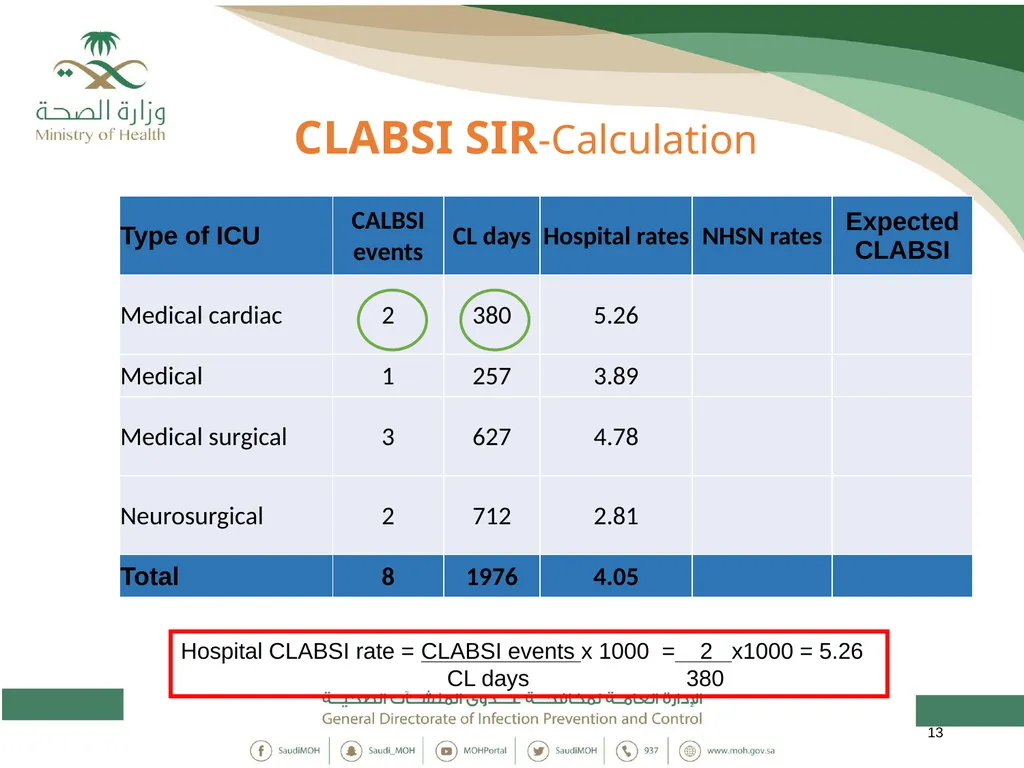
CLABSI SIR-Calculation 13 Hospital CLABSI rate = CLABSI events x 1000 = 2 x1000 = 5.26
CL days 380<br>
14
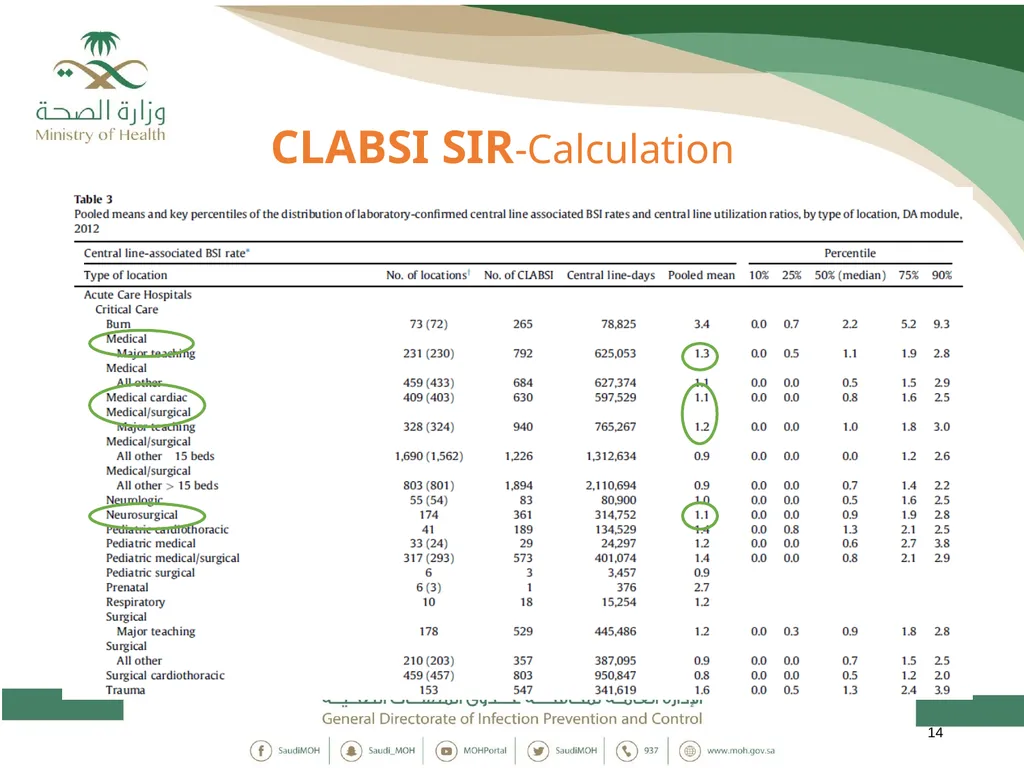
14 CLABSI SIR-Calculation<br>
15
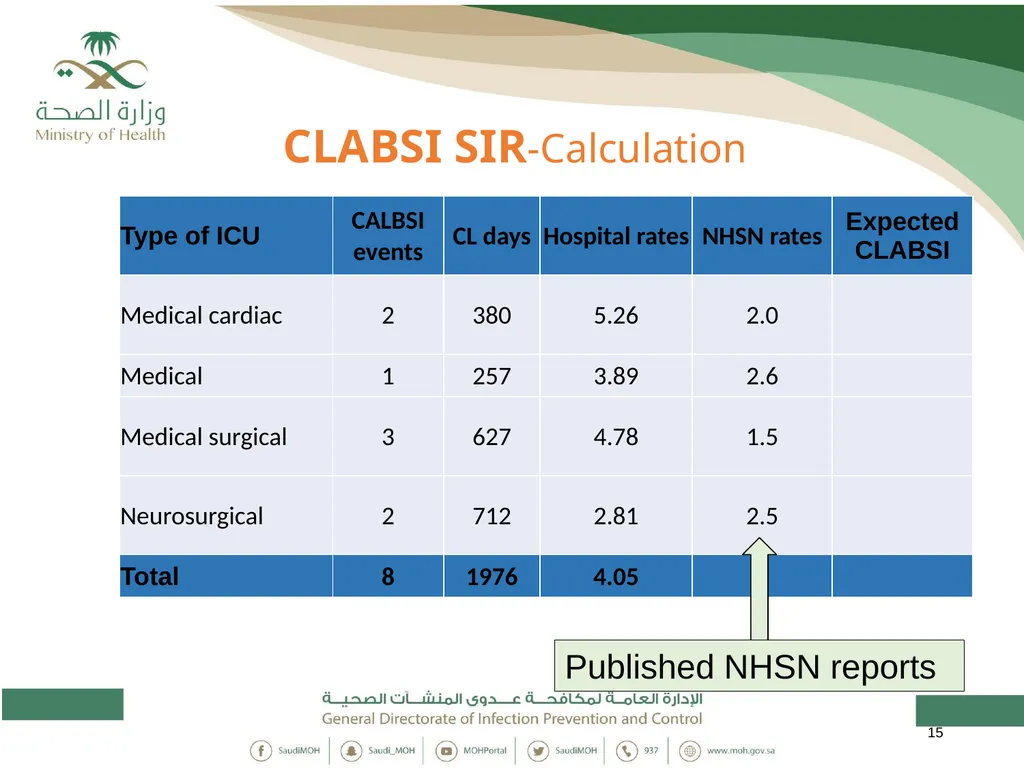
CLABSI SIR-Calculation 15 Published NHSN reports<br>
16
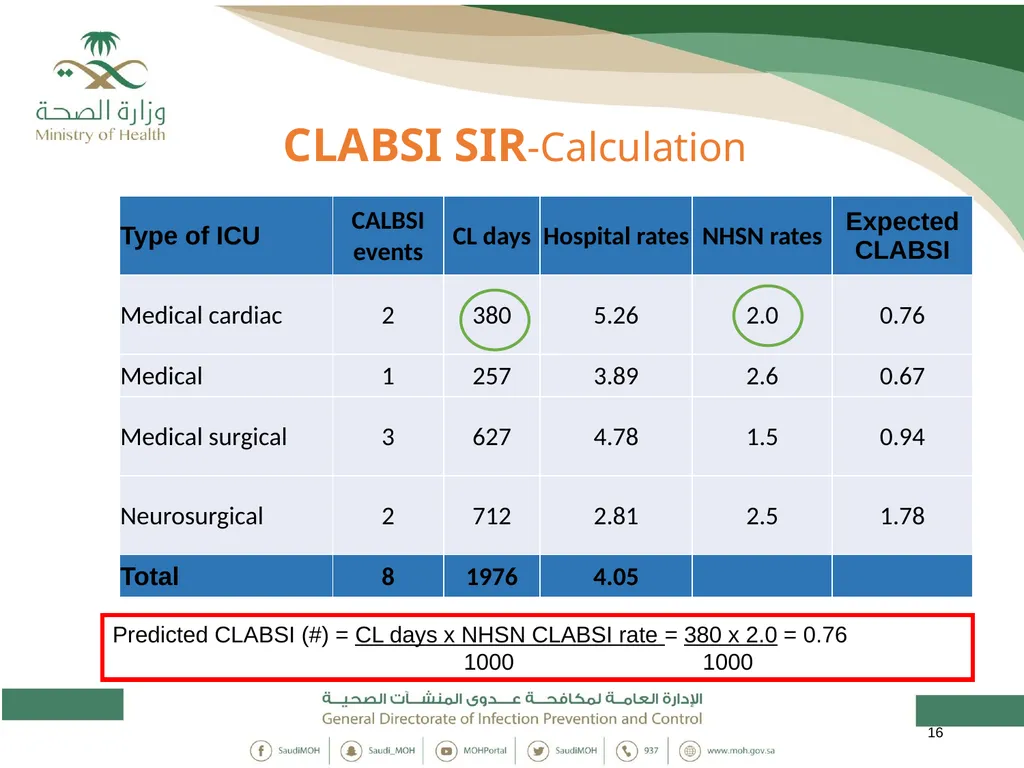
CLABSI SIR-Calculation 16 Predicted CLABSI (#) = CL days x NHSN CLABSI rate = 380 x 2.0 = 0.76
1000 1000<br>
17
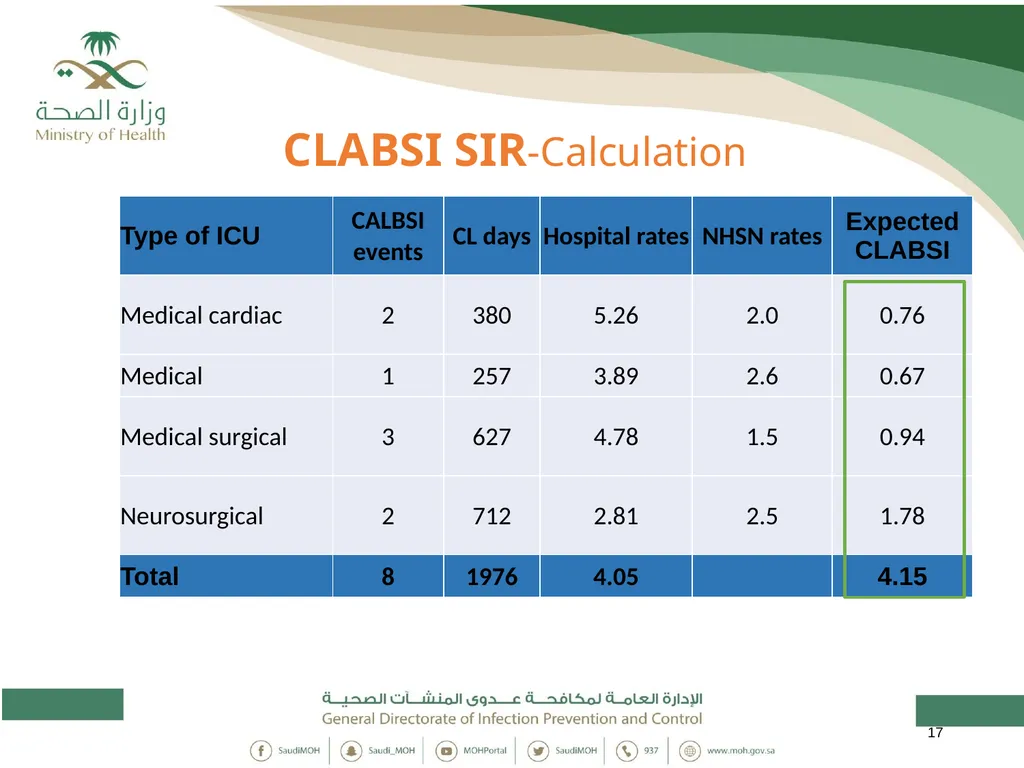
CLABSI SIR-Calculation 17<br>
18
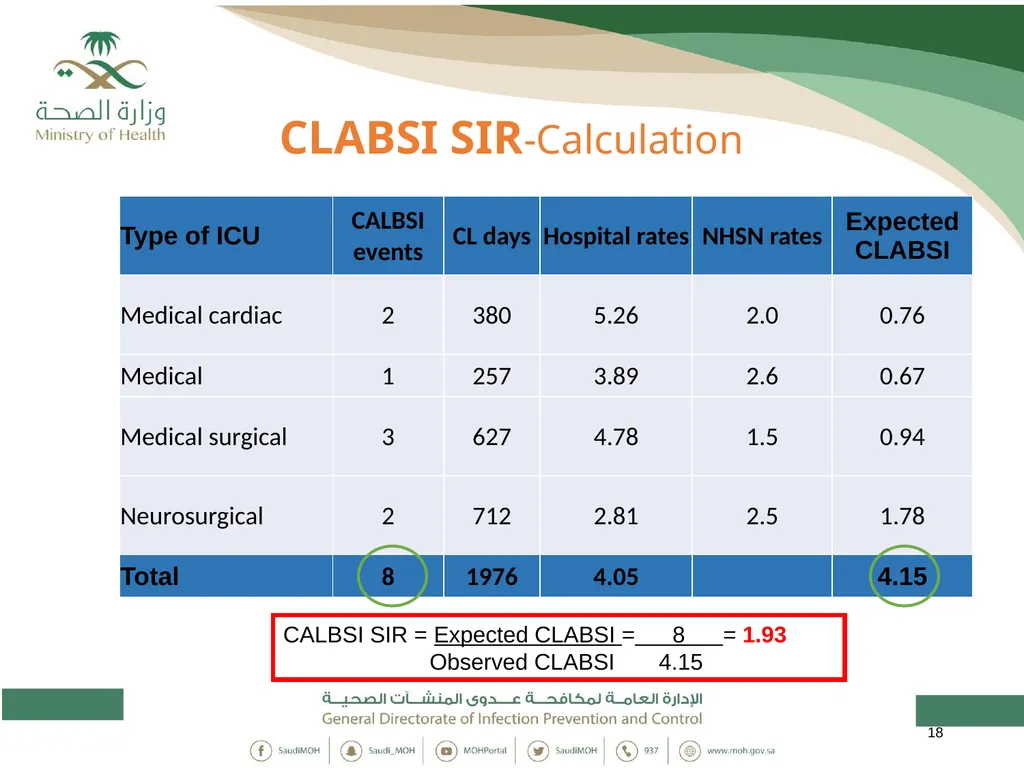
CLABSI SIR-Calculation 18 CALBSI SIR = Expected CLABSI = 8 = 1.93
Observed CLABSI 4.15<br>
19
CLABSI SIR-Calculation 19<br>
20
CLABSI SIR-Calculation 20<br>
21
CLABSI SIR-Calculation 21<br>
22
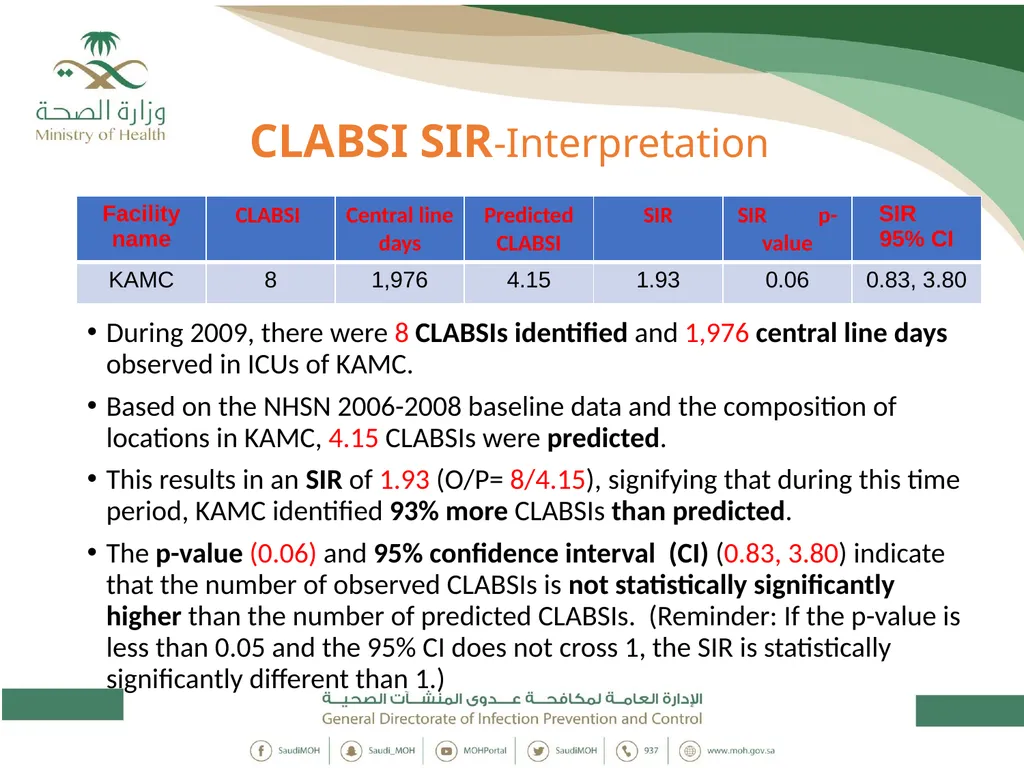
CLABSI SIR-Interpretation During 2009, there were 8 CLABSIs identified and 1,976 central line days observed in ICUs of KAMC.
Based on the NHSN 2006-2008 baseline data and the composition of locations in KAMC, 4.15 CLABSIs were predicted.
This results in an SIR of 1.93 (O/P= 8/4.15), signifying that during this time period, KAMC identified 93% more CLABSIs than predicted.
The p-value (0.06) and 95% confidence interval (CI) (0.83, 3.80) indicate that the number of observed CLABSIs is not statistically significantly higher than the number of predicted CLABSIs. (Reminder: If the p-value is less than 0.05 and the 95% CI does not cross 1, the SIR is statistically significantly different than 1.)<br>
24
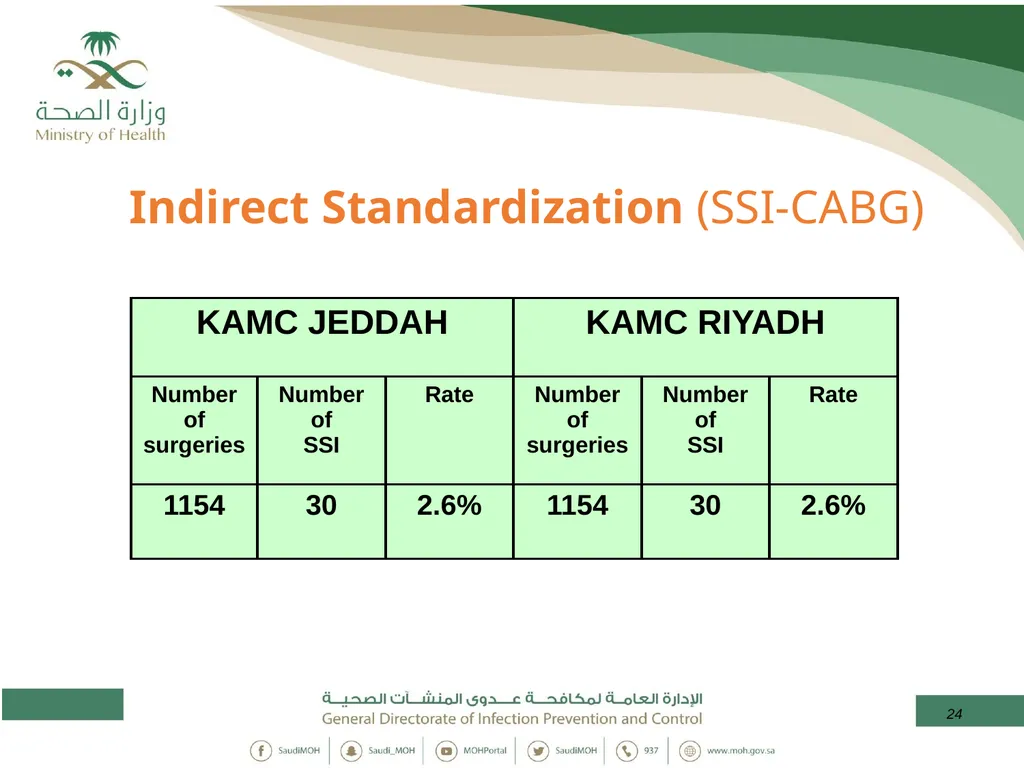
24 Indirect Standardization (SSI-CABG)<br>
25
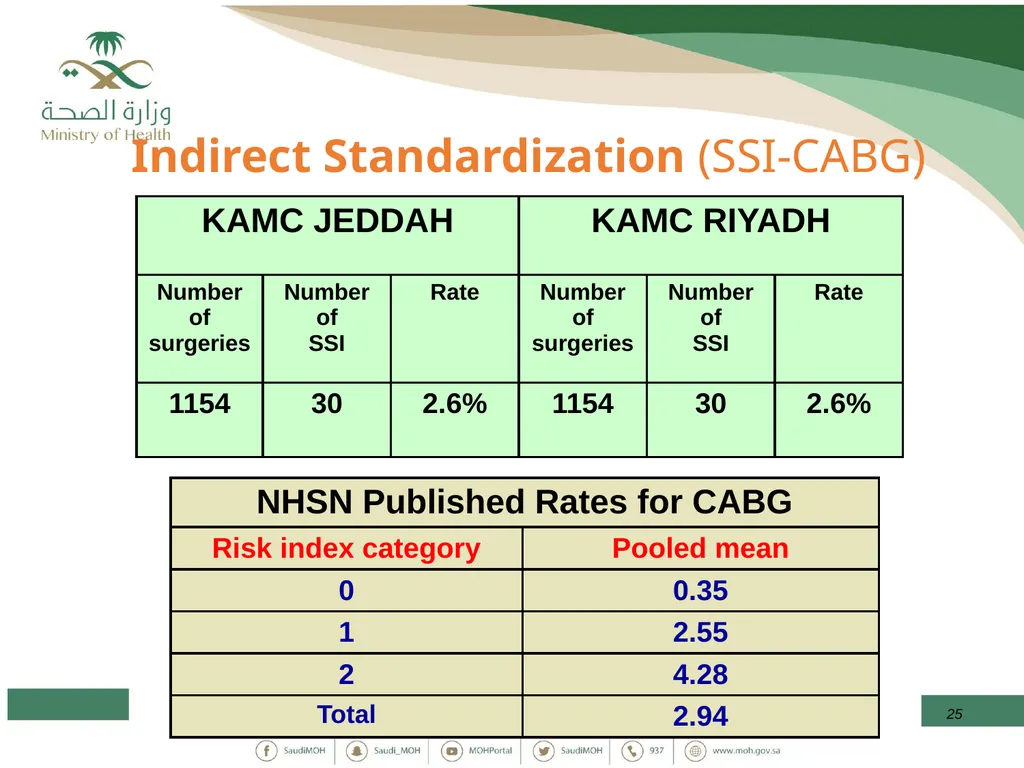
25 Indirect Standardization (SSI-CABG)<br>
26
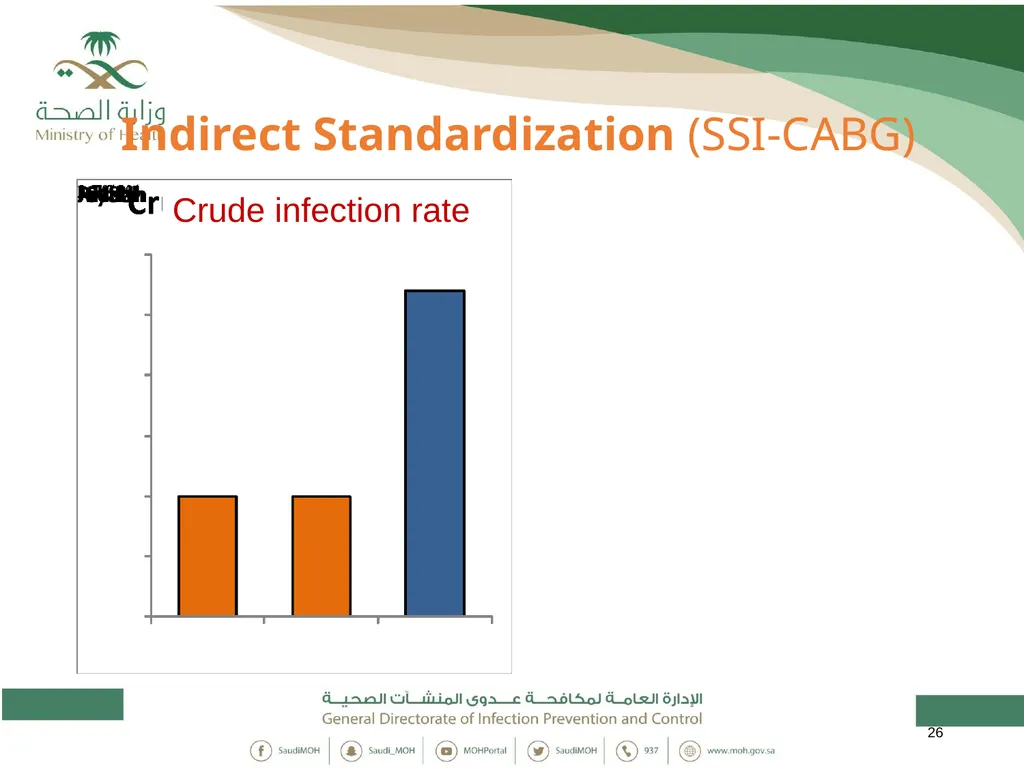
26 Indirect Standardization (SSI-CABG) Crude infection rate<br>
27
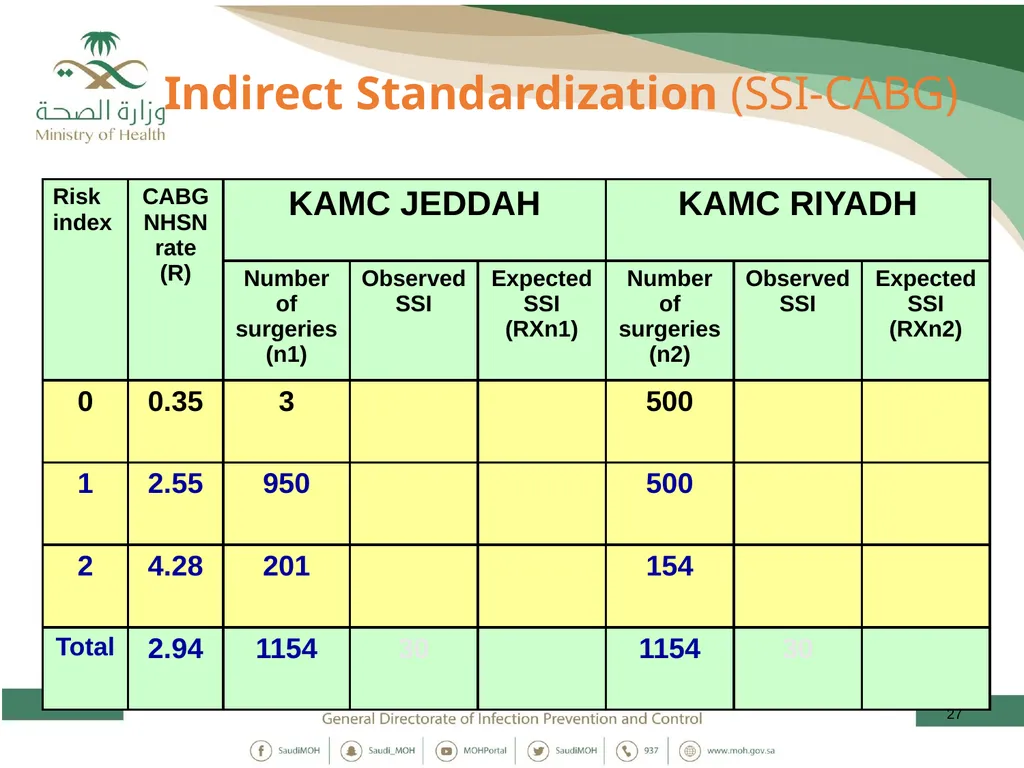
27 Indirect Standardization (SSI-CABG)<br>
28
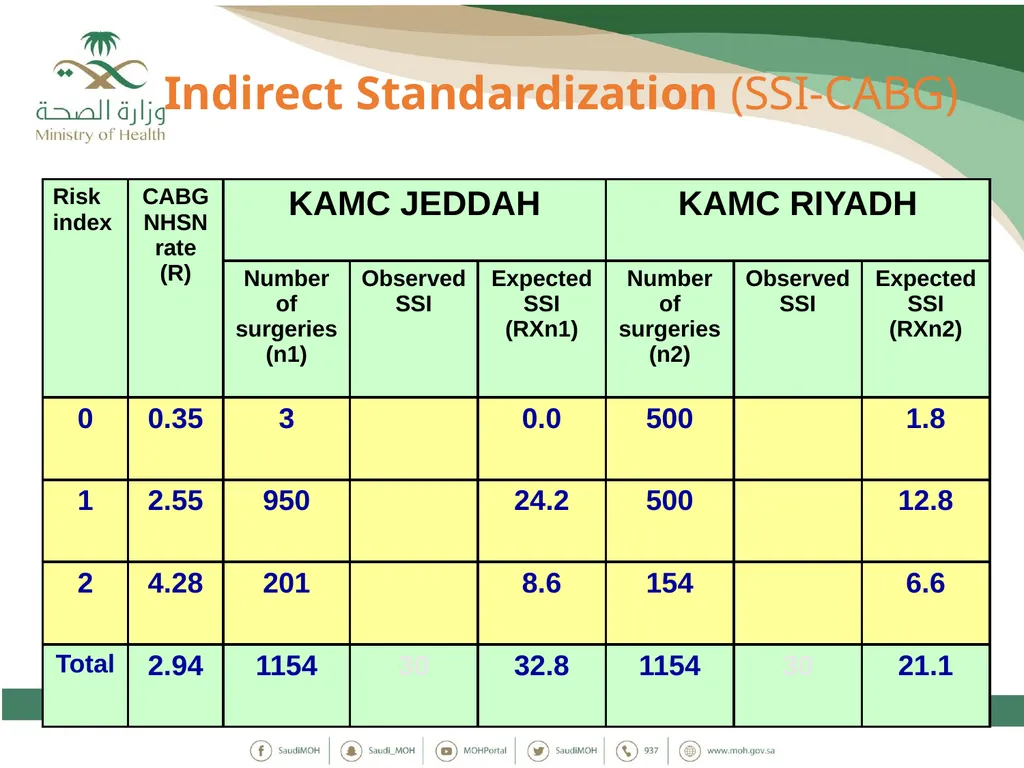
28 Indirect Standardization (SSI-CABG)<br>
29
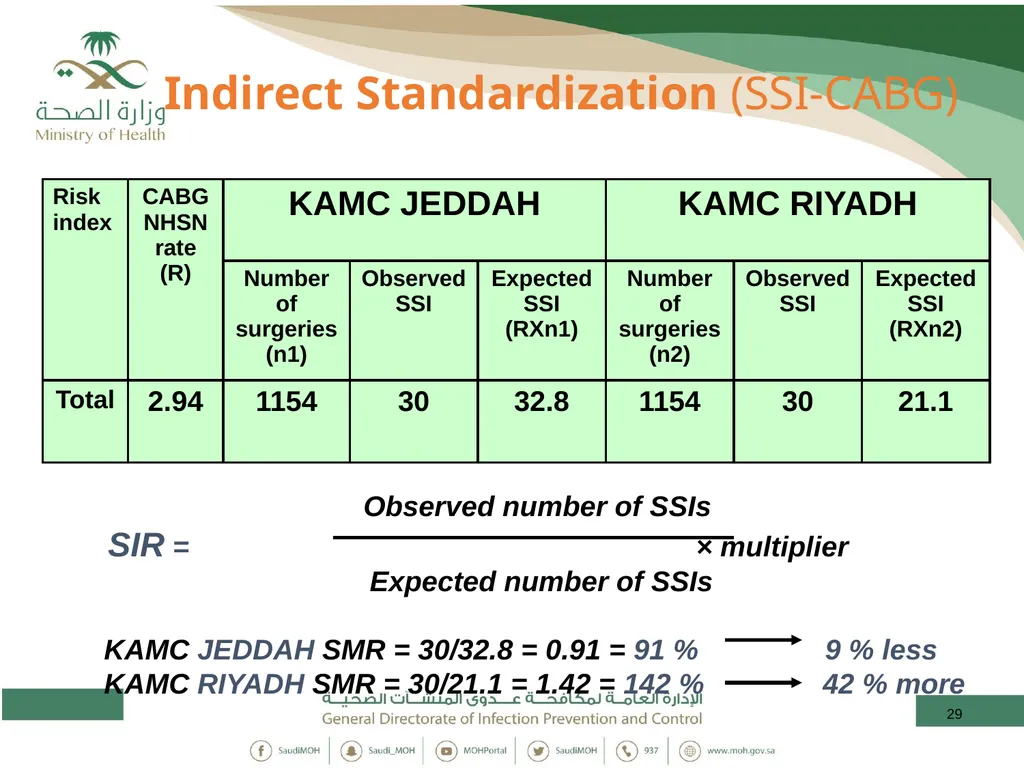
29 Indirect Standardization (SSI-CABG) Observed number of SSIs
SIR = × multiplier Expected number of SSIs
KAMC JEDDAH SMR = 30/32.8 = 0.91 = 91 % 9 % less
KAMC RIYADH SMR = 30/21.1 = 1.42 = 142 % 42 % more<br>
30
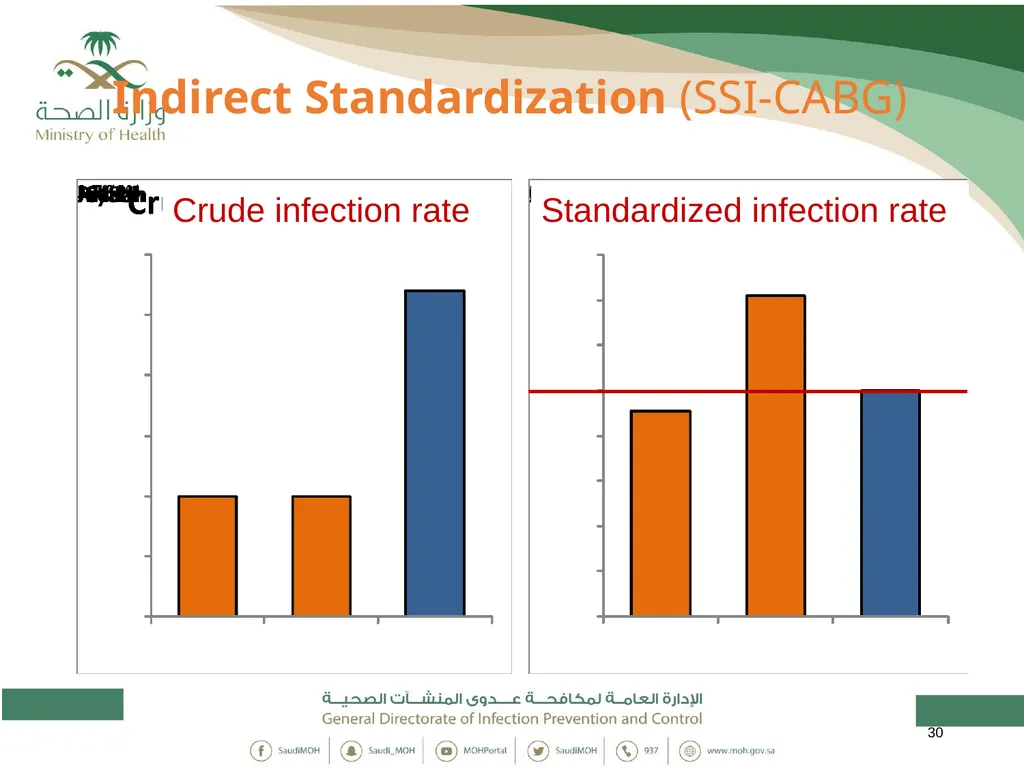
30 Indirect Standardization (SSI-CABG) Crude infection rate Standardized infection rate<br>
31
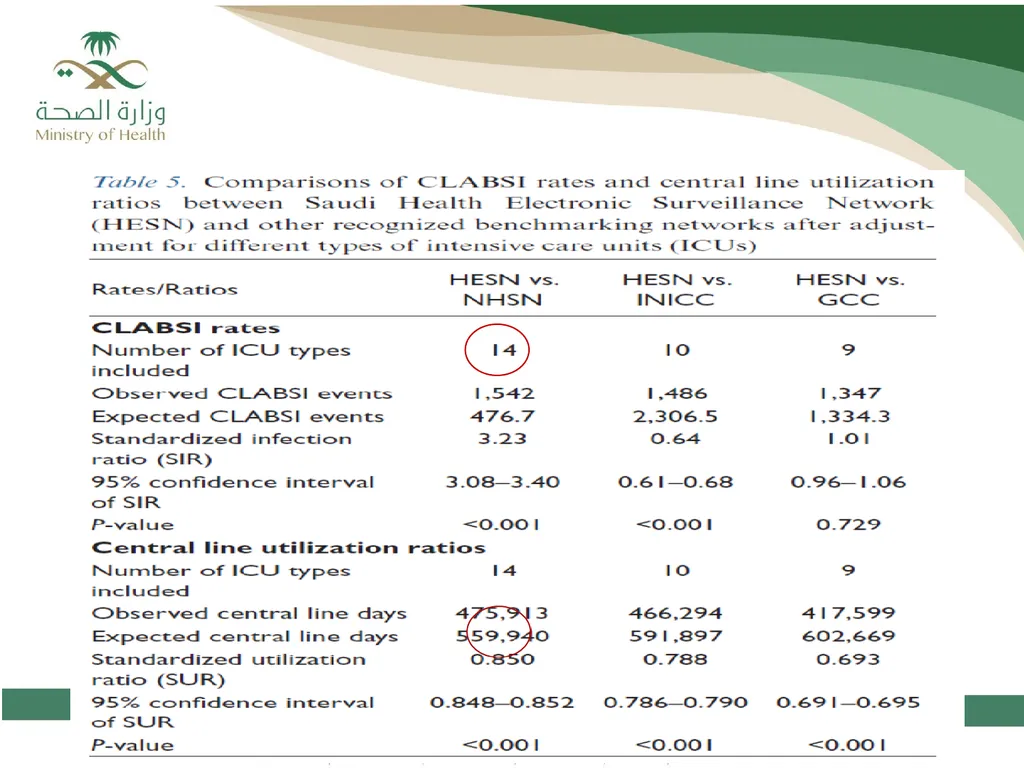
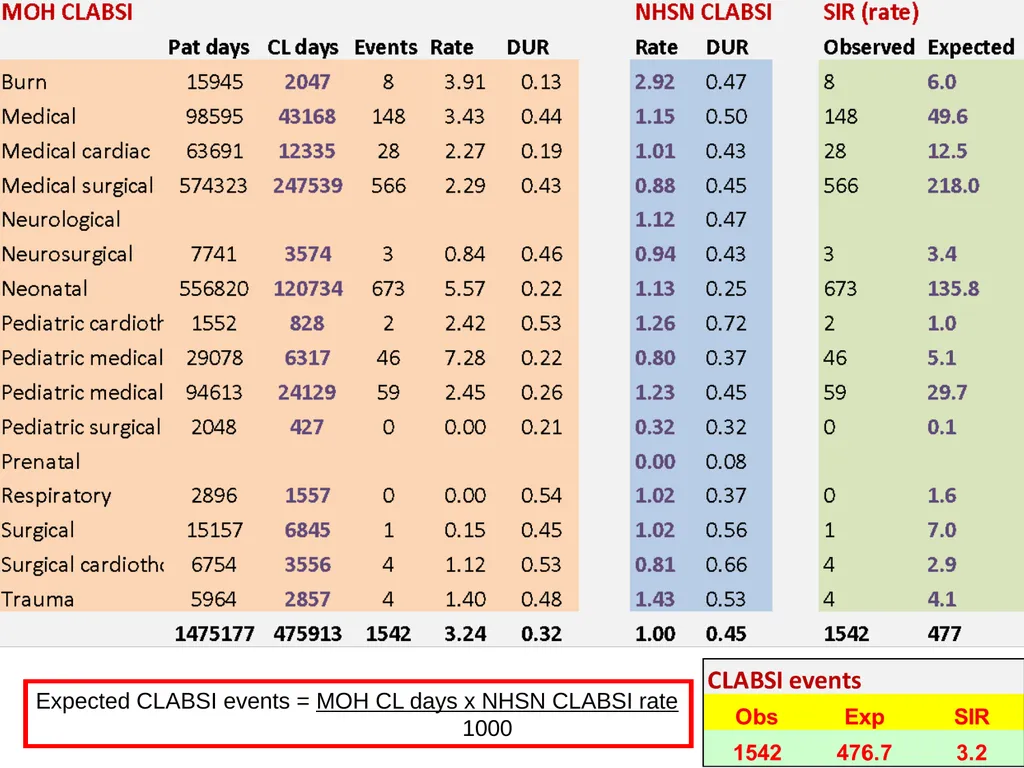
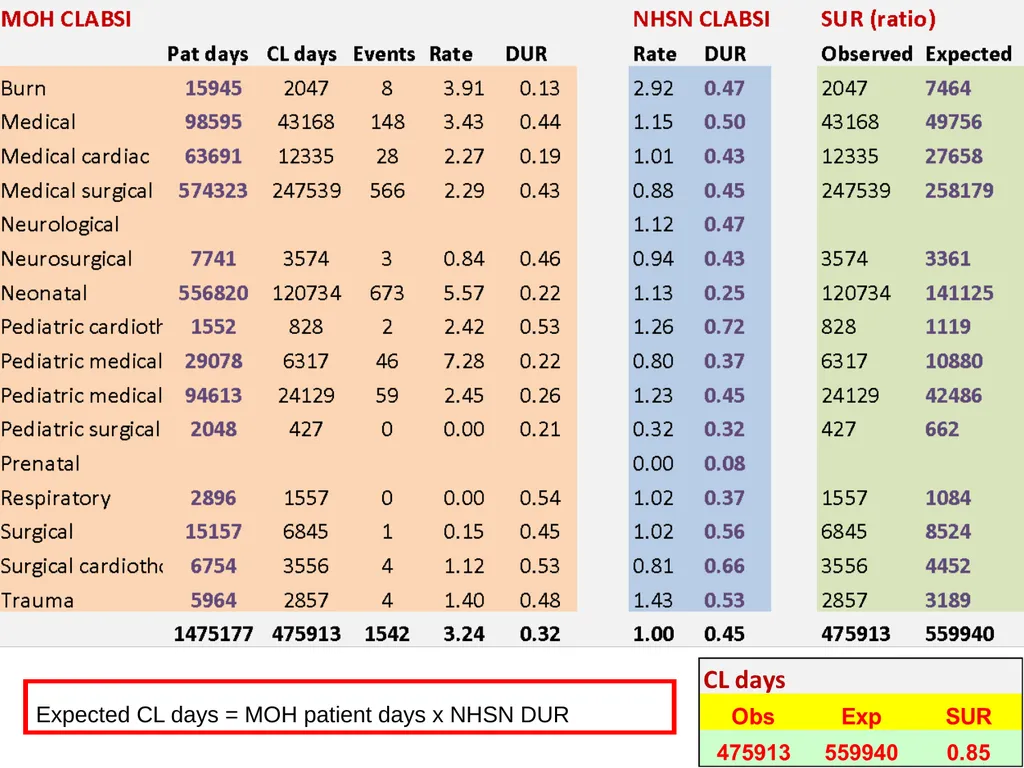
MOH CLABSI SIR/SUR 31<br>
34
34 Expected CLABSI events = MOH CL days x NHSN CLABSI rate 1000<br>
35
35 Expected CL days = MOH patient days x NHSN DUR<br>
36
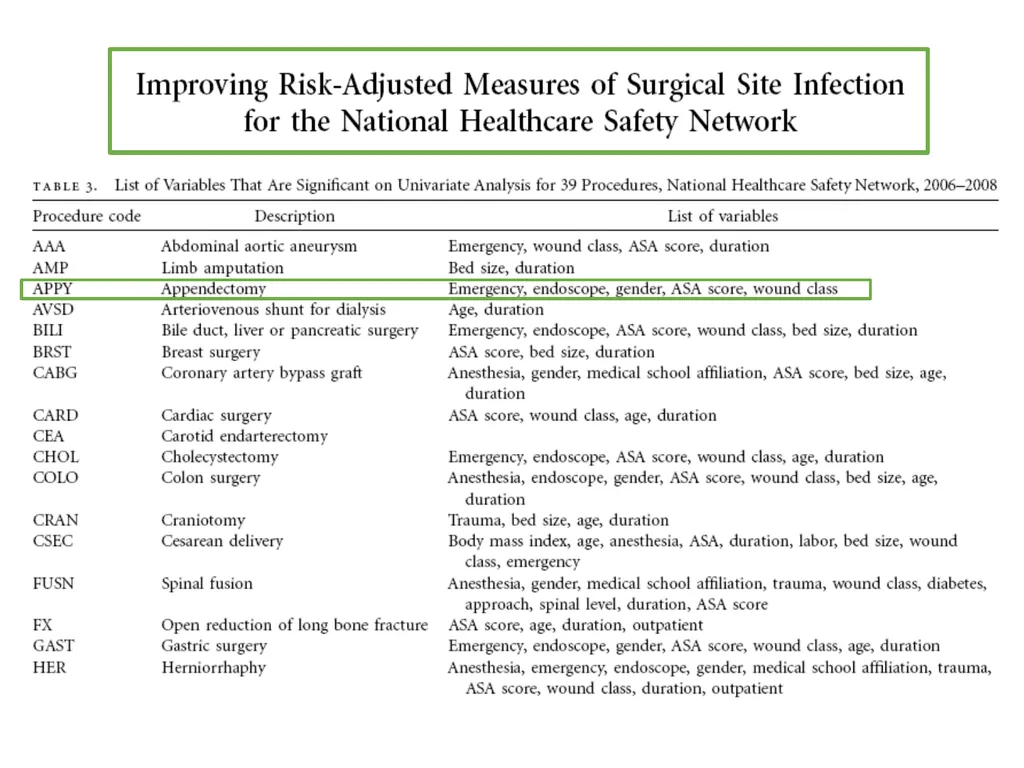
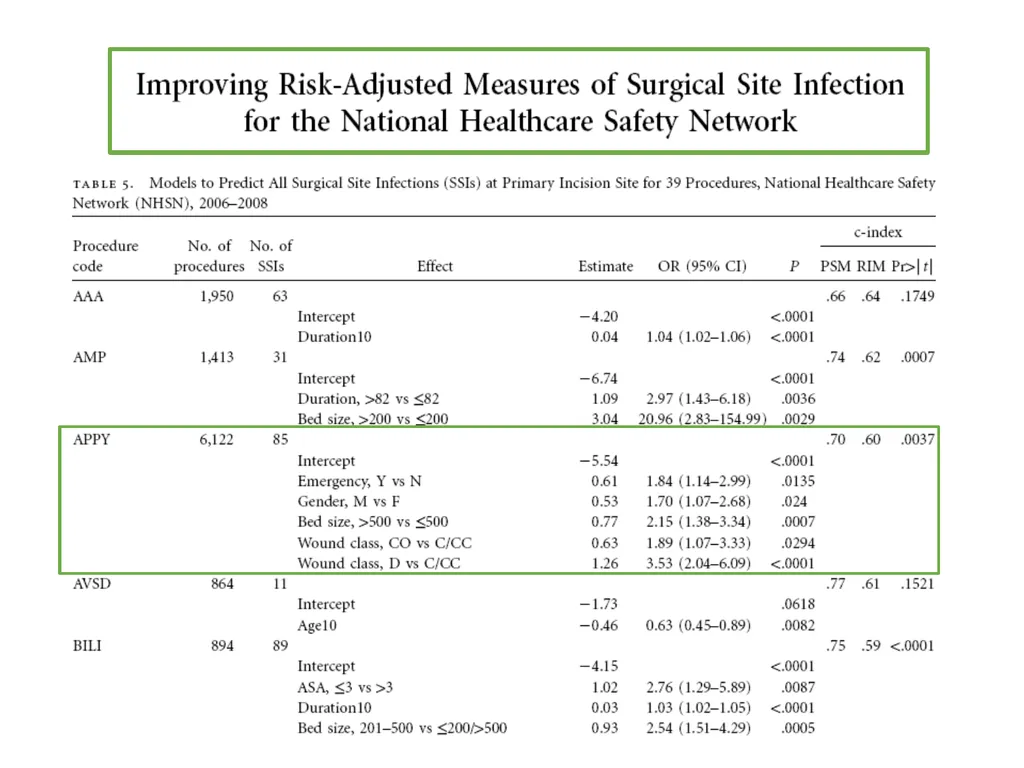
Multi-adjusted SSI SIR 36<br>
37
Deriving the SSI SIR �Improved risk adjustment No longer based on the basic risk index
Therefore, recent risk-stratified SSI rates not published
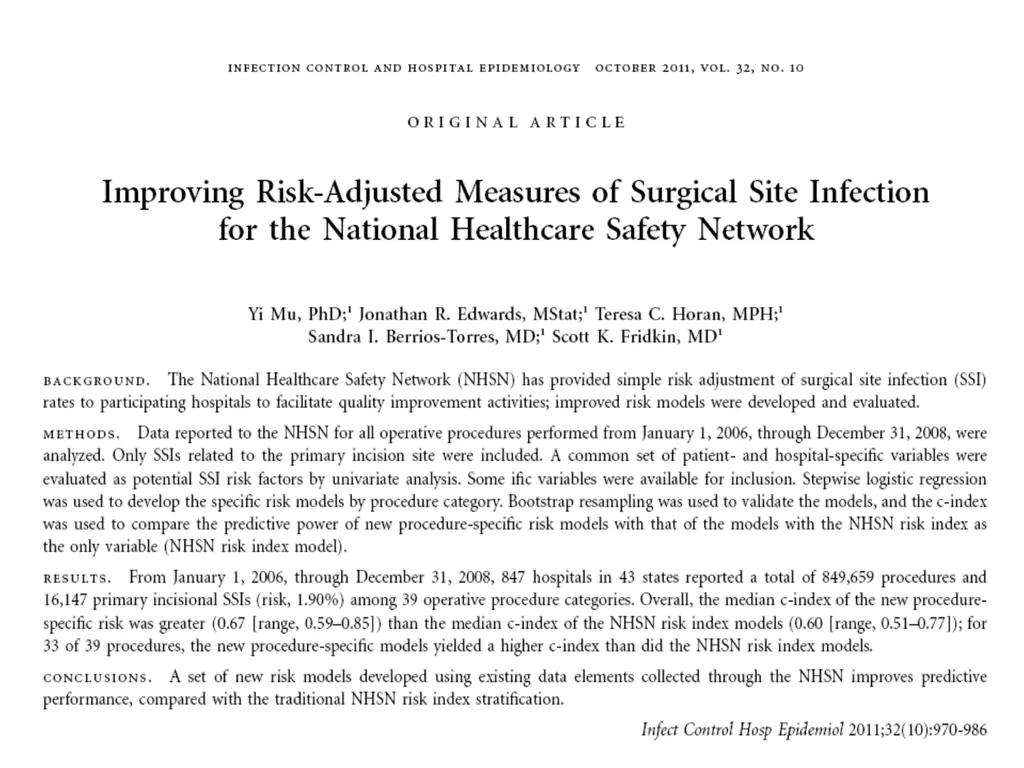
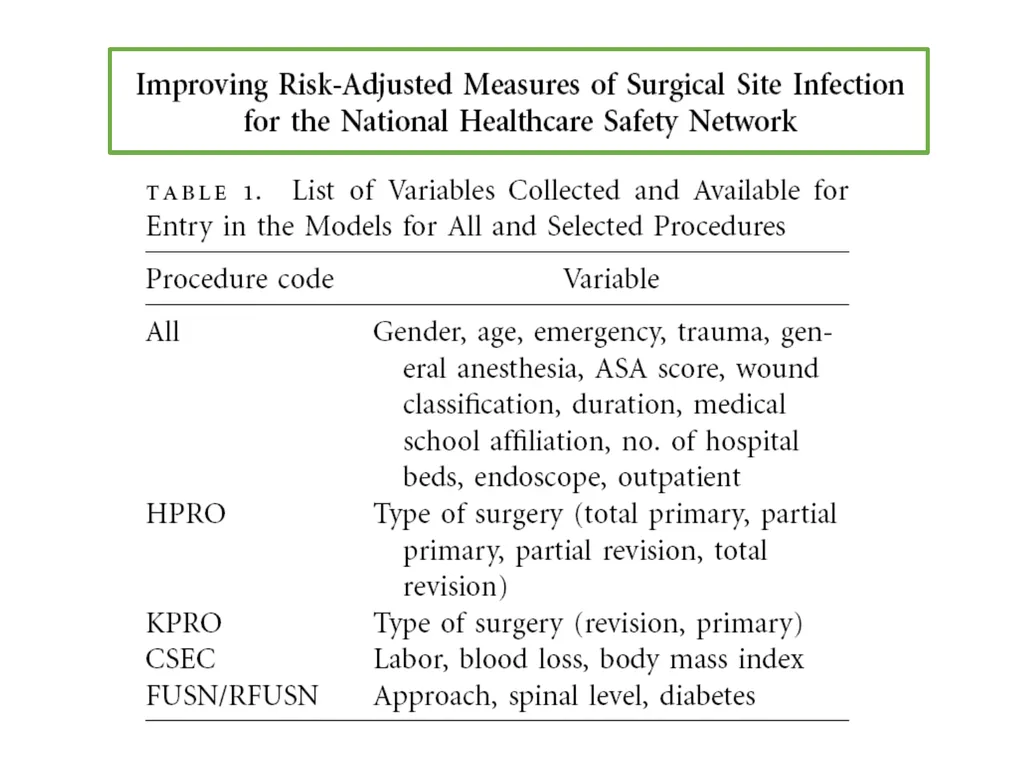
New method uses an improved risk adjustment calculated through logistic regression modeling.
Used for prediction of the probability of occurrence of an event by fitting data
Allows specified risk factors to be considered
Allows risk factors to be procedure-specific
Allows each factor’s contribution to vary according to its association with risk<br>
38
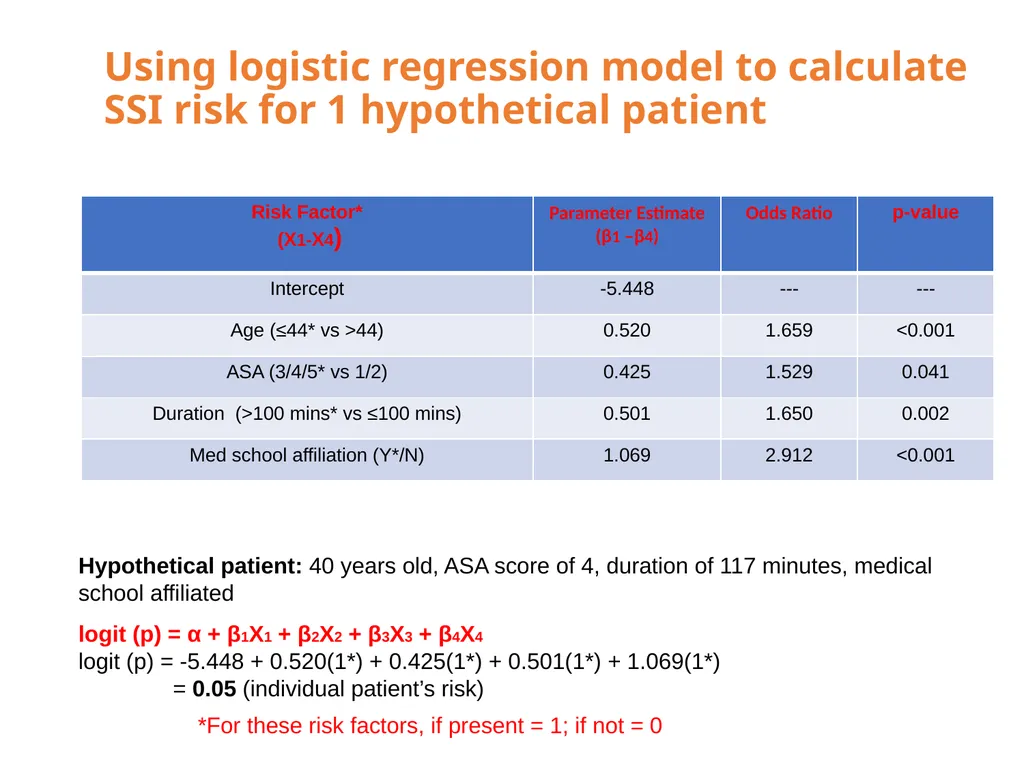
Using logistic regression model to calculate SSI risk for 1 hypothetical patient Hypothetical patient: 40 years old, ASA score of 4, duration of 117 minutes, medical school affiliated
logit (p) = α + β1X1 + β2X2 + β3X3 + β4X4
logit (p) = -5.448 + 0.520(1*) + 0.425(1*) + 0.501(1*) + 1.069(1*)
= 0.05 (individual patient’s risk) *For these risk factors, if present = 1; if not = 0<br>
39
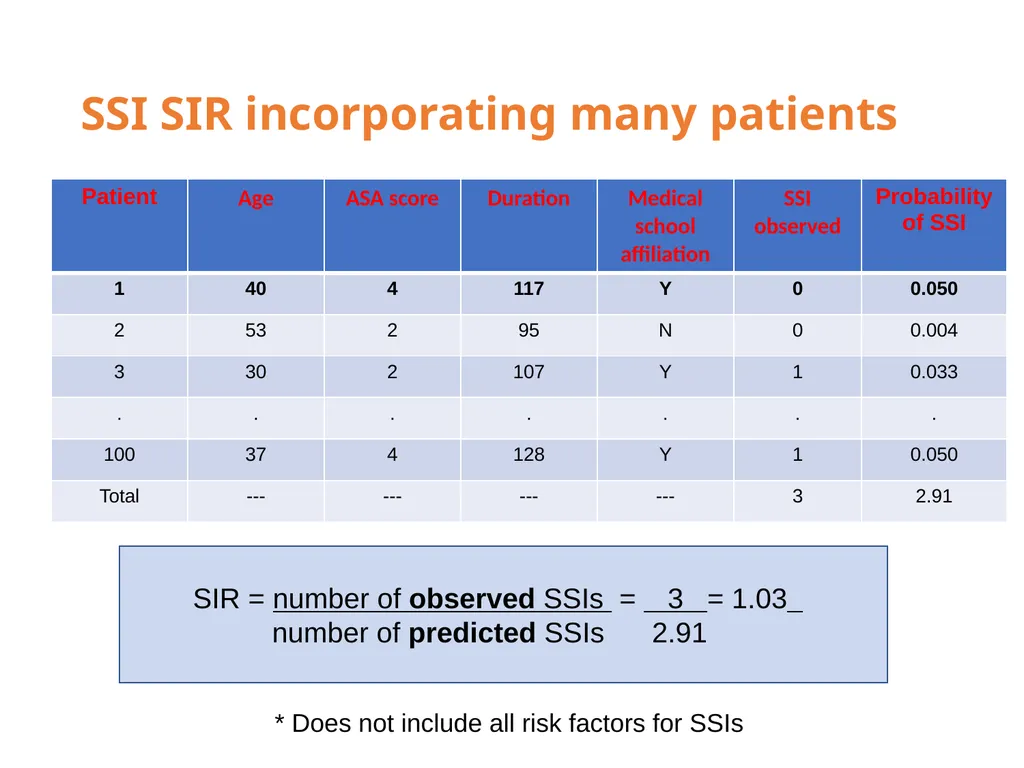
SSI SIR incorporating many patients SIR = number of observed SSIs = 3 = 1.03
number of predicted SSIs 2.91 * Does not include all risk factors for SSIs<br>