Stata Conference 2022 August 4 Washington, DC
Description: Stata Conference 2022 August 4 Washington, DC Slide Deck: PowerPoint Presentations within Stata Tim Schmidt Treasurer Discover Financial Services Slide Deck is a suite of Stata programs in two Stata classes: slide.class deck.class
Related Topics
Download Presentation
"Stata Conference 2022 August 4 Washington, DC" is the property of its rightful owner. Permission is granted to download and print the materials on this website for personal, non-commercial use only, and to display it on your personal computer provided you do not modify the materials and that you retain all copyright notices contained in the materials. By downloading content from our website, you accept the terms of this agreement.
Presentation Transcript
slide1. Stata Conference 2022
August 4
Washington, DC Slide Deck: PowerPoint Presentations within Stata Tim Schmidt
Treasurer
Discover Financial Services<br>
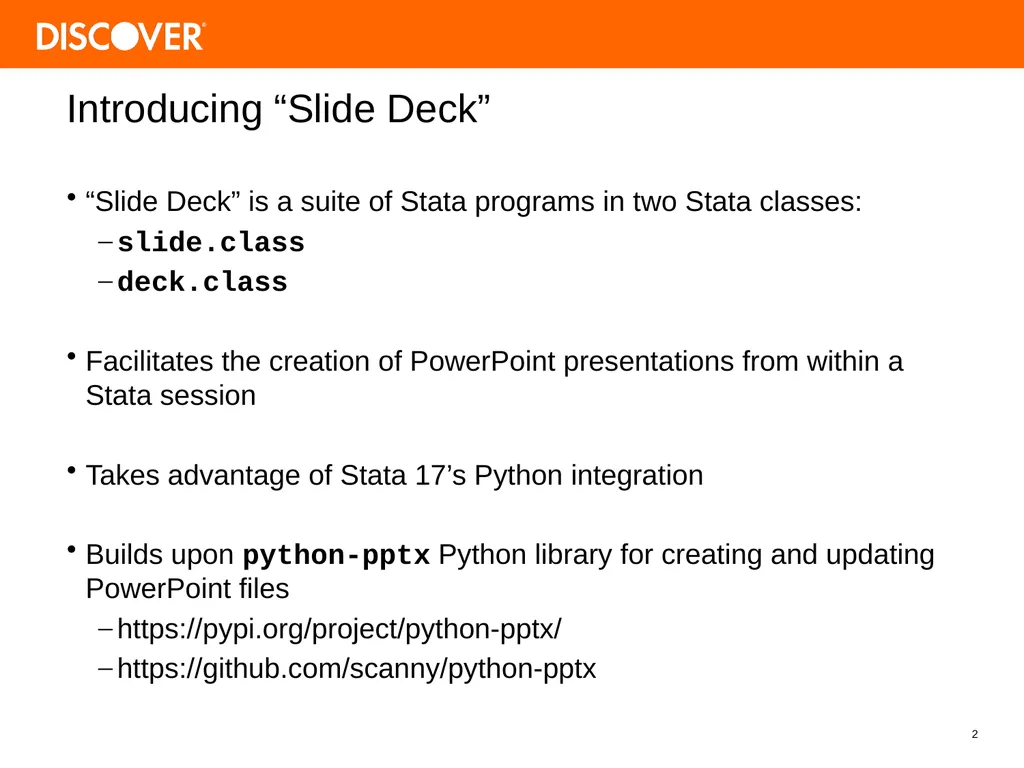
slide2. “Slide Deck” is a suite of Stata programs in two Stata classes:
slide.class
deck.class
Facilitates the creation of PowerPoint presentations from within a Stata session
Takes advantage of Stata 17’s Python integration
Builds upon python-pptx Python library for creating and updating PowerPoint files
https://pypi.org/project/python-pptx/
https://github.com/scanny/python-pptx 2 Introducing “Slide Deck”<br>
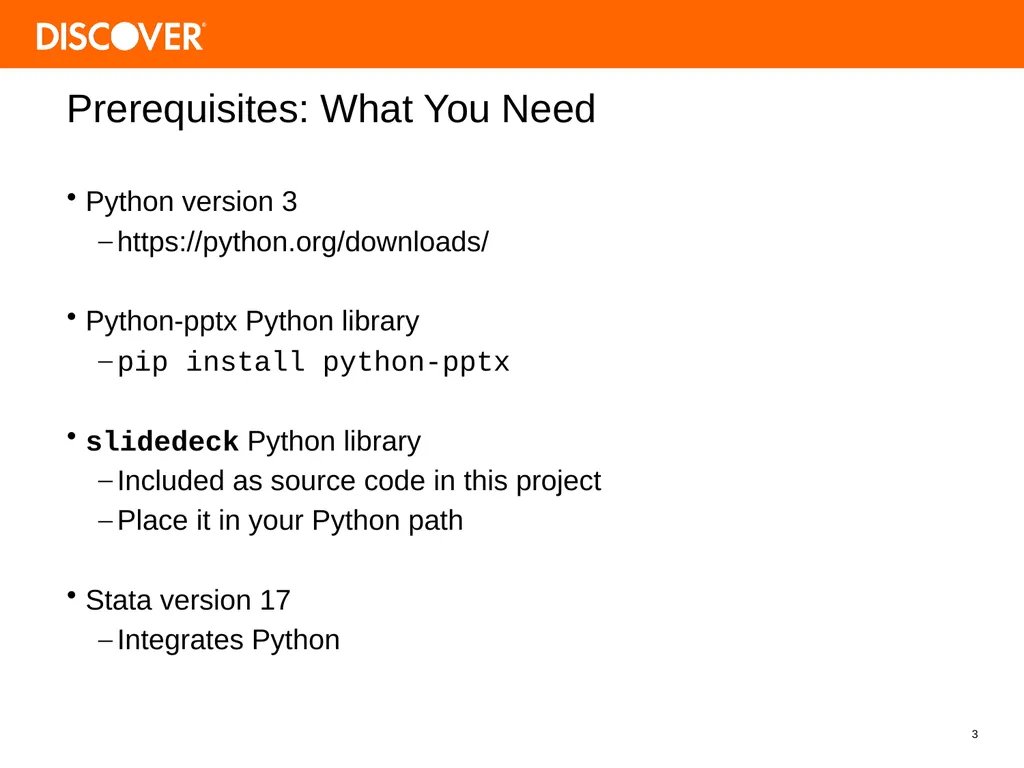
slide3. Python version 3
https://python.org/downloads/
Python-pptx Python library
pip install python-pptx
slidedeck Python library
Included as source code in this project
Place it in your Python path
Stata version 17
Integrates Python 3 Prerequisites: What You Need<br>
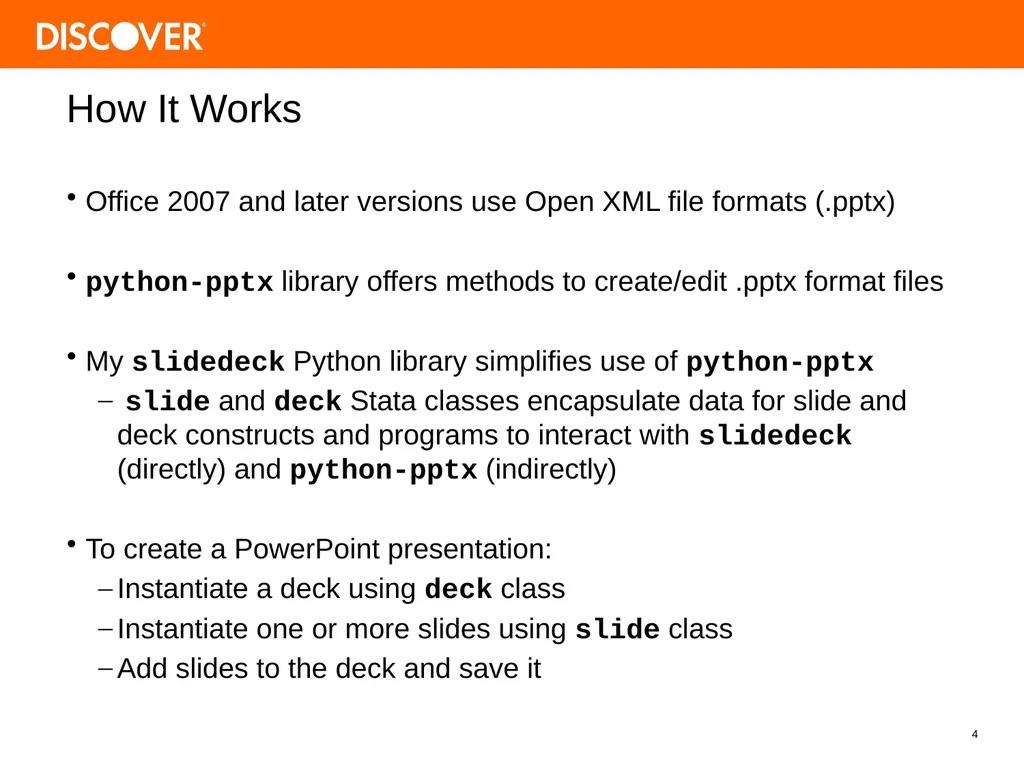
slide4. Office 2007 and later versions use Open XML file formats (.pptx)
python-pptx library offers methods to create/edit .pptx format files
My slidedeck Python library simplifies use of python-pptx
slide and deck Stata classes encapsulate data for slide and deck constructs and programs to interact with slidedeck (directly) and python-pptx (indirectly)
To create a PowerPoint presentation:
Instantiate a deck using deck class
Instantiate one or more slides using slide class
Add slides to the deck and save it 4 How It Works<br>
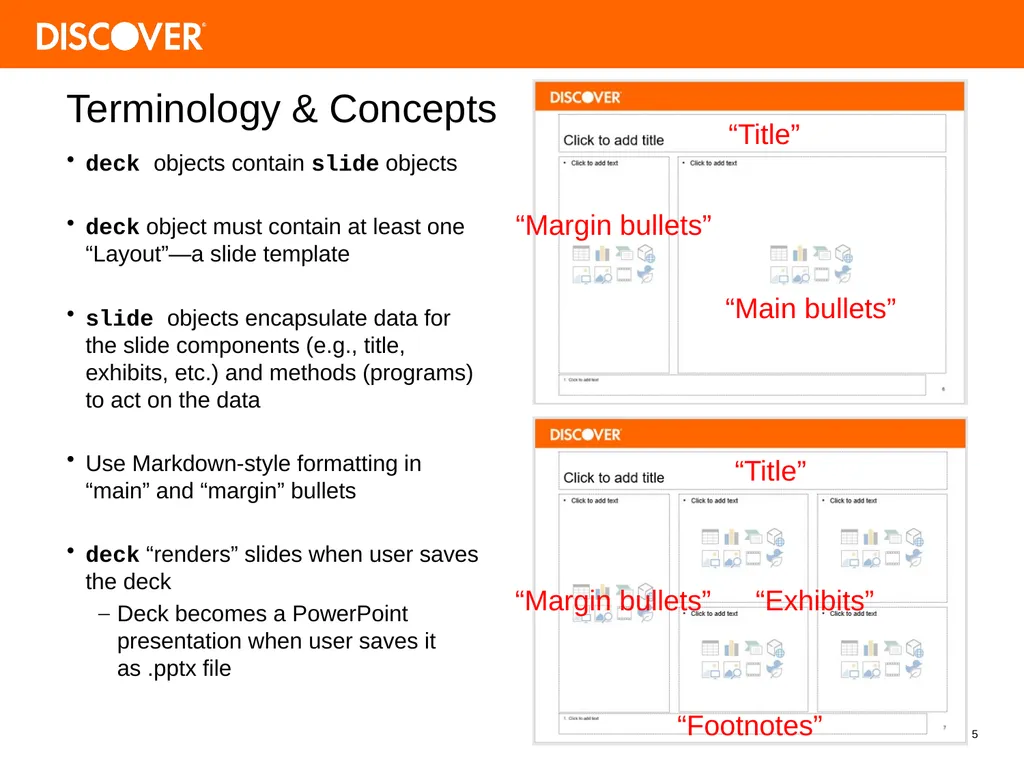
slide5. 5 Terminology & Concepts deck objects contain slide objects
deck object must contain at least one “Layout”—a slide template
slide objects encapsulate data for the slide components (e.g., title, exhibits, etc.) and methods (programs) to act on the data
Use Markdown-style formatting in “main” and “margin” bullets
deck “renders” slides when user saves the deck
Deck becomes a PowerPoint presentation when user saves it as .pptx file<br>
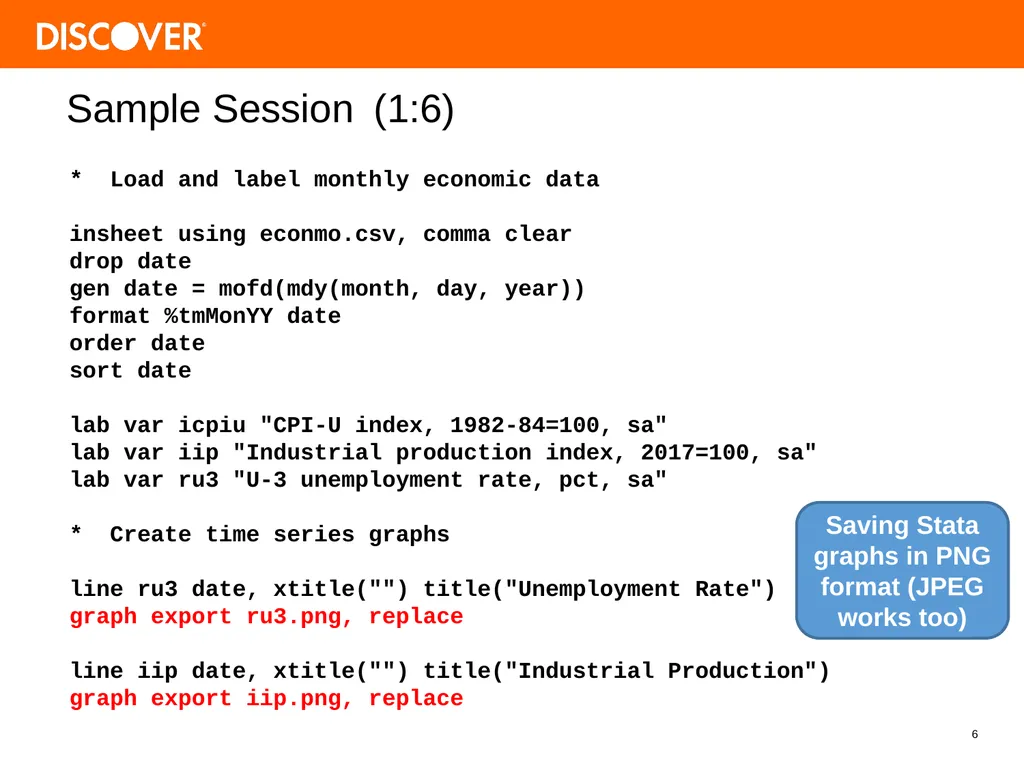
slide6. 6 Sample Session (1:6) * Load and label monthly economic data
insheet using econmo.csv, comma clear
drop date
gen date = mofd(mdy(month, day, year))
format %tmMonYY date
order date
sort date
lab var icpiu "CPI-U index, 1982-84=100, sa"
lab var iip "Industrial production index, 2017=100, sa"
lab var ru3 "U-3 unemployment rate, pct, sa"
* Create time series graphs
line ru3 date, xtitle("") title("Unemployment Rate")
graph export ru3.png, replace
line iip date, xtitle("") title("Industrial Production")
graph export iip.png, replace Saving Stata graphs in PNG format (JPEG works too)<br>
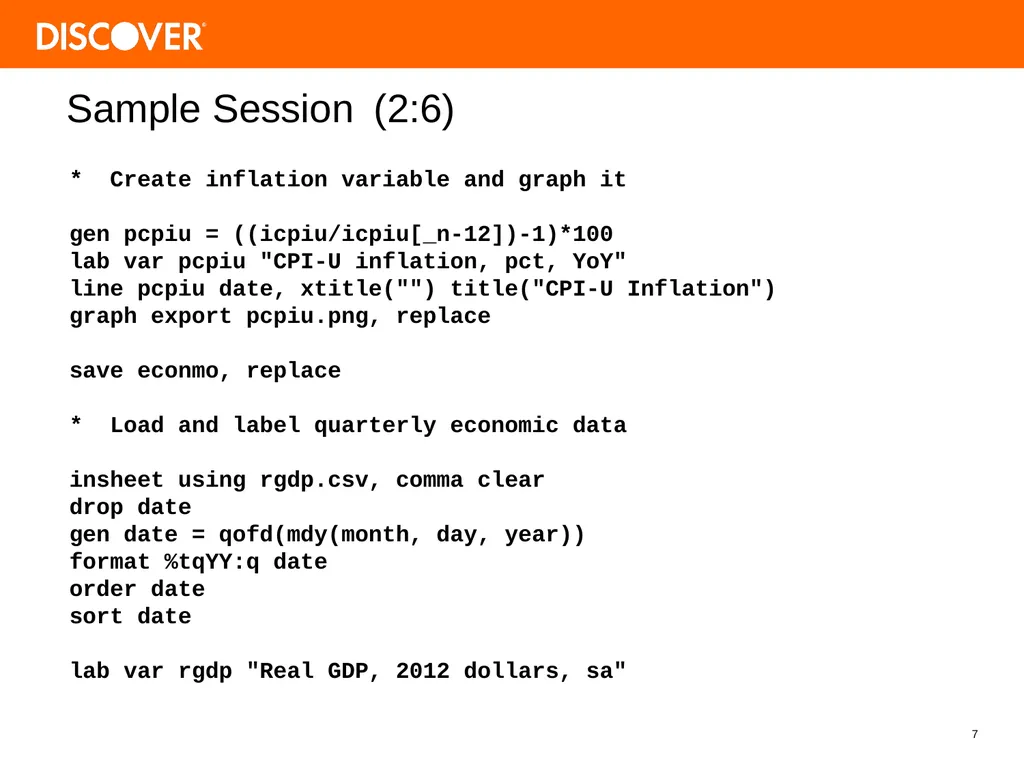
slide7. 7 Sample Session (2:6) * Create inflation variable and graph it
gen pcpiu = ((icpiu/icpiu[_n-12])-1)*100
lab var pcpiu "CPI-U inflation, pct, YoY"
line pcpiu date, xtitle("") title("CPI-U Inflation")
graph export pcpiu.png, replace
save econmo, replace
* Load and label quarterly economic data
insheet using rgdp.csv, comma clear
drop date
gen date = qofd(mdy(month, day, year))
format %tqYY:q date
order date
sort date
lab var rgdp "Real GDP, 2012 dollars, sa"<br>
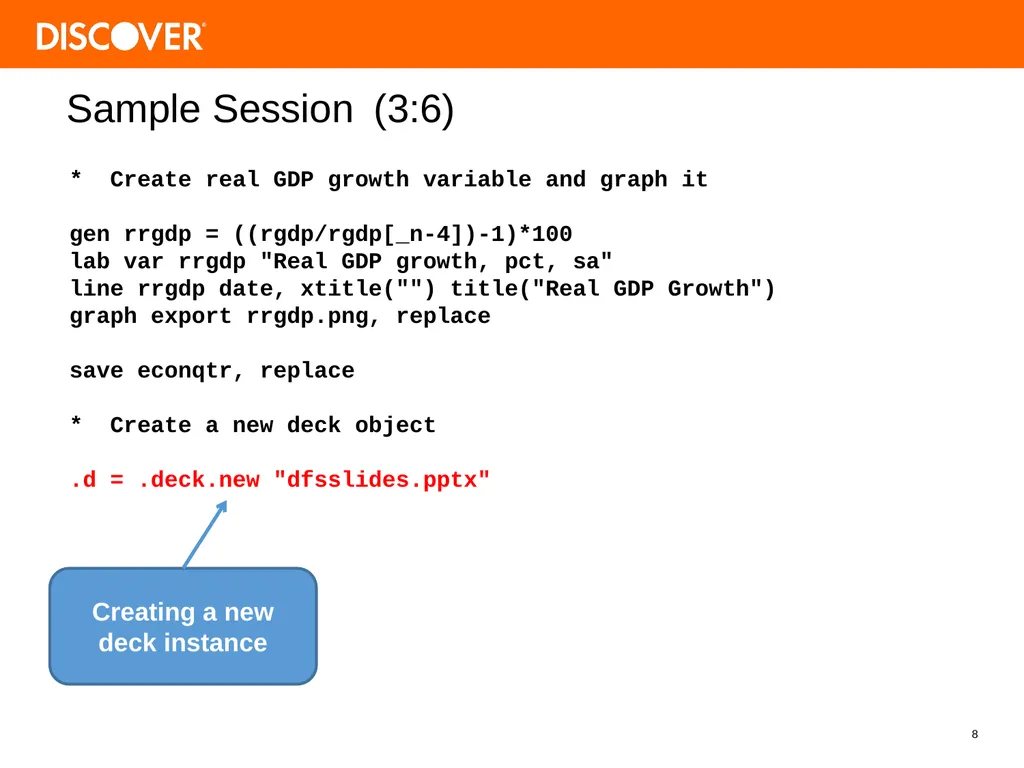
slide8. 8 Sample Session (3:6) * Create real GDP growth variable and graph it
gen rrgdp = ((rgdp/rgdp[_n-4])-1)*100
lab var rrgdp "Real GDP growth, pct, sa"
line rrgdp date, xtitle("") title("Real GDP Growth")
graph export rrgdp.png, replace
save econqtr, replace
* Create a new deck object
.d = .deck.new "dfsslides.pptx" Creating a new deck instance<br>
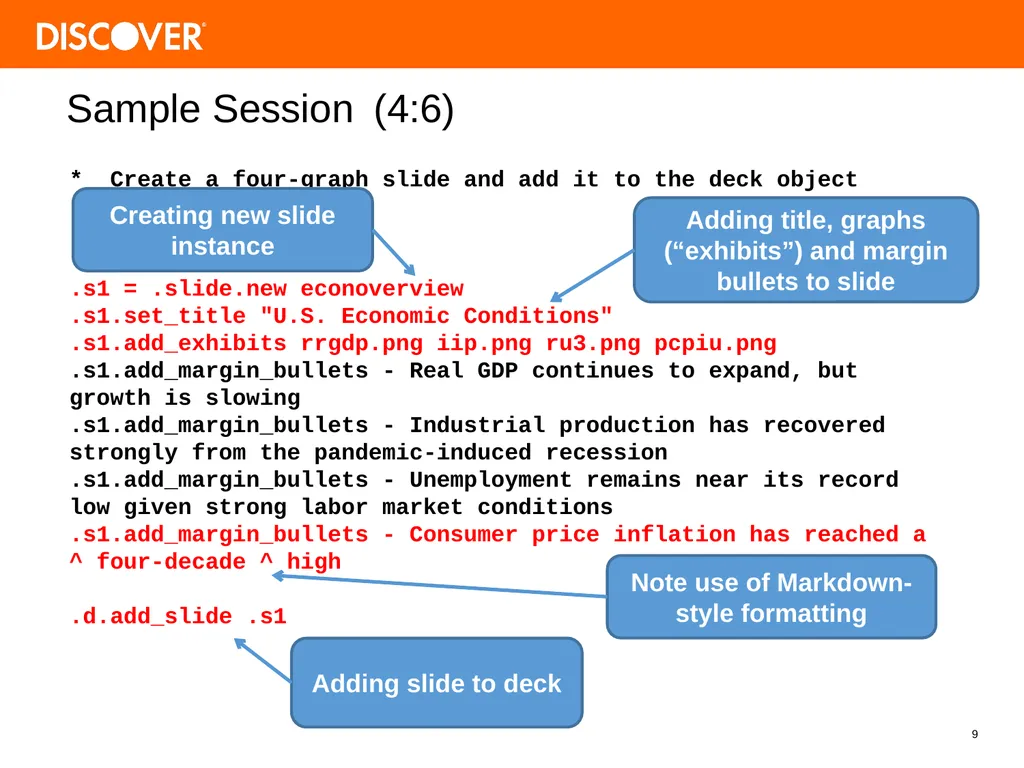
slide9. 9 Sample Session (4:6) * Create a four-graph slide and add it to the deck object
.s1 = .slide.new econoverview
.s1.set_title "U.S. Economic Conditions"
.s1.add_exhibits rrgdp.png iip.png ru3.png pcpiu.png
.s1.add_margin_bullets - Real GDP continues to expand, but growth is slowing
.s1.add_margin_bullets - Industrial production has recovered strongly from the pandemic-induced recession
.s1.add_margin_bullets - Unemployment remains near its record low given strong labor market conditions
.s1.add_margin_bullets - Consumer price inflation has reached a ^ four-decade ^ high
.d.add_slide .s1 Adding slide to deck Adding title, graphs (“exhibits”) and margin bullets to slide Note use of Markdown-style formatting Creating new slide instance<br>
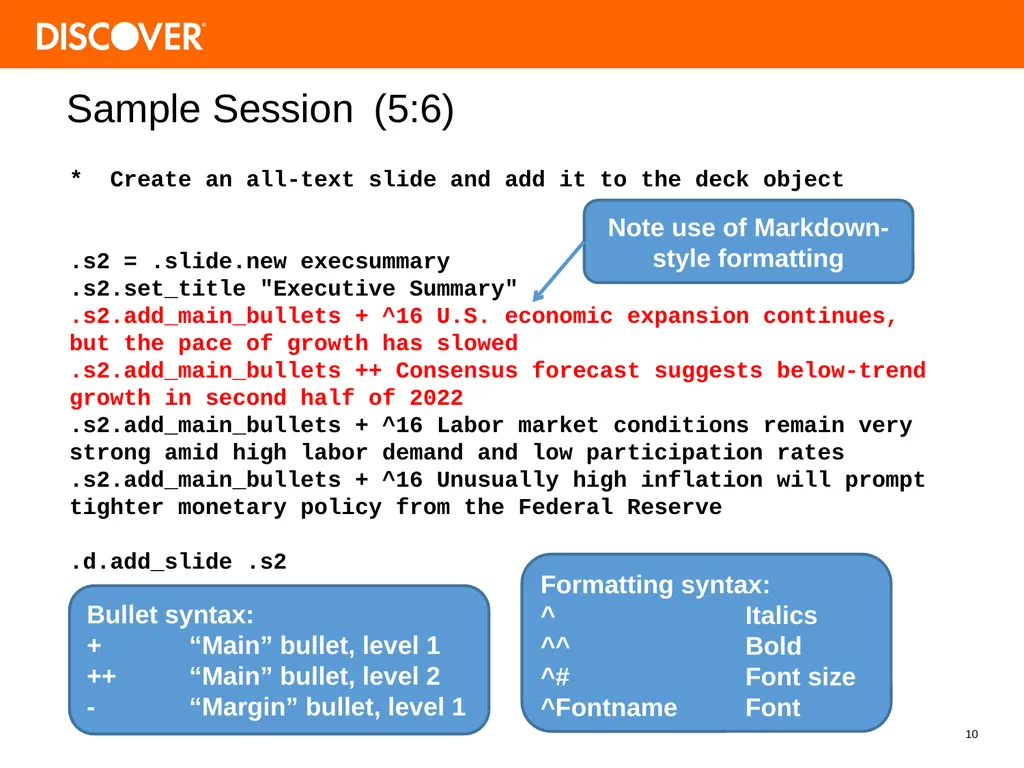
slide10. 10 Sample Session (5:6) * Create an all-text slide and add it to the deck object
.s2 = .slide.new execsummary
.s2.set_title "Executive Summary"
.s2.add_main_bullets + ^16 U.S. economic expansion continues, but the pace of growth has slowed
.s2.add_main_bullets ++ Consensus forecast suggests below-trend growth in second half of 2022
.s2.add_main_bullets + ^16 Labor market conditions remain very strong amid high labor demand and low participation rates
.s2.add_main_bullets + ^16 Unusually high inflation will prompt tighter monetary policy from the Federal Reserve
.d.add_slide .s2 Note use of Markdown-style formatting Formatting syntax:
^ Italics
^^ Bold
^# Font size
^Fontname Font Bullet syntax:
+ “Main” bullet, level 1
++ “Main” bullet, level 2
- “Margin” bullet, level 1<br>
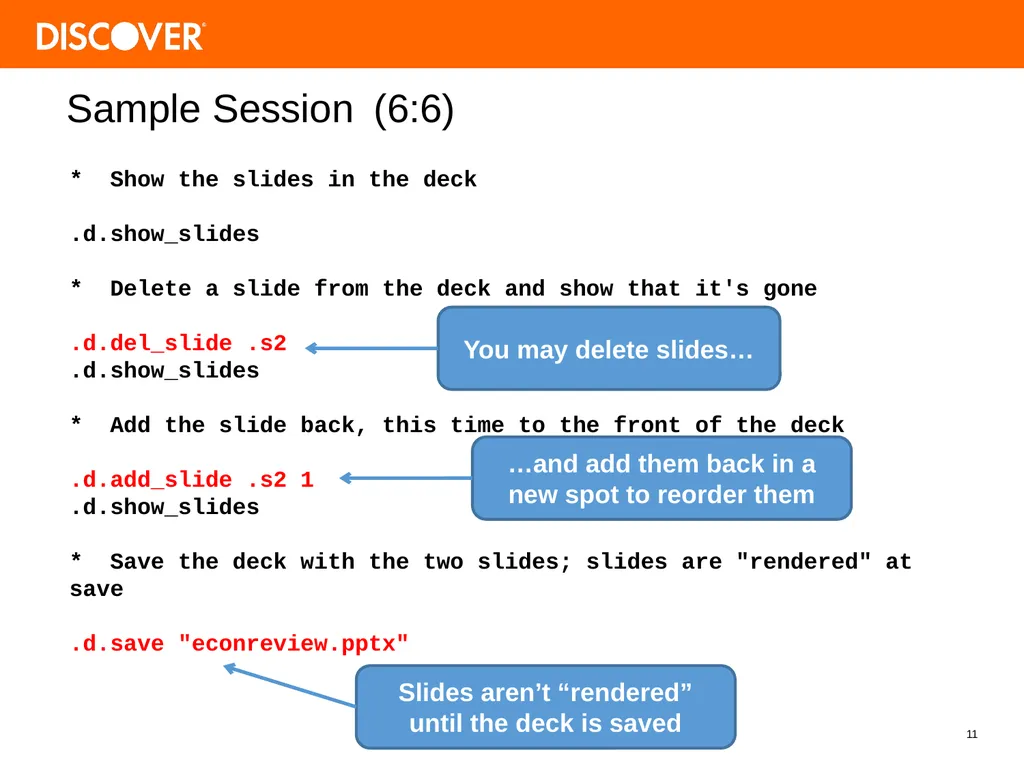
slide11. 11 Sample Session (6:6) * Show the slides in the deck
.d.show_slides
* Delete a slide from the deck and show that it's gone
.d.del_slide .s2
.d.show_slides
* Add the slide back, this time to the front of the deck
.d.add_slide .s2 1
.d.show_slides
* Save the deck with the two slides; slides are "rendered" at save
.d.save "econreview.pptx" You may delete slides… …and add them back in a new spot to reorder them Slides aren’t “rendered” until the deck is saved<br>
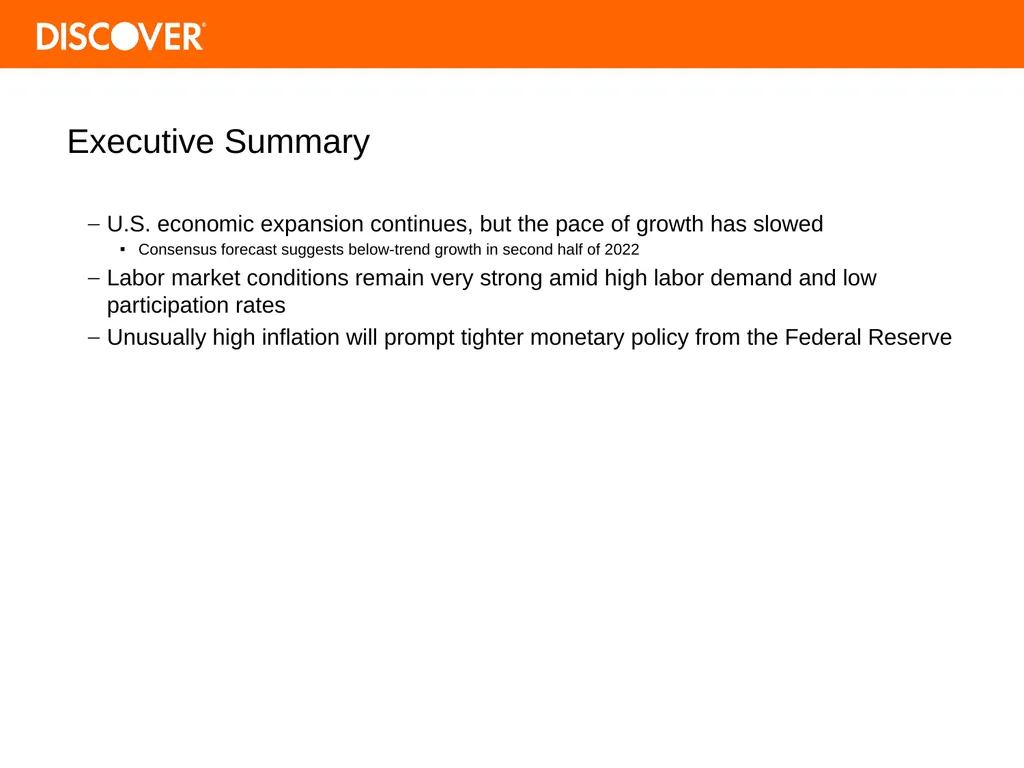
slide12. U.S. economic expansion continues, but the pace of growth has slowed
Consensus forecast suggests below-trend growth in second half of 2022
Labor market conditions remain very strong amid high labor demand and low participation rates
Unusually high inflation will prompt tighter monetary policy from the Federal Reserve Executive Summary<br>
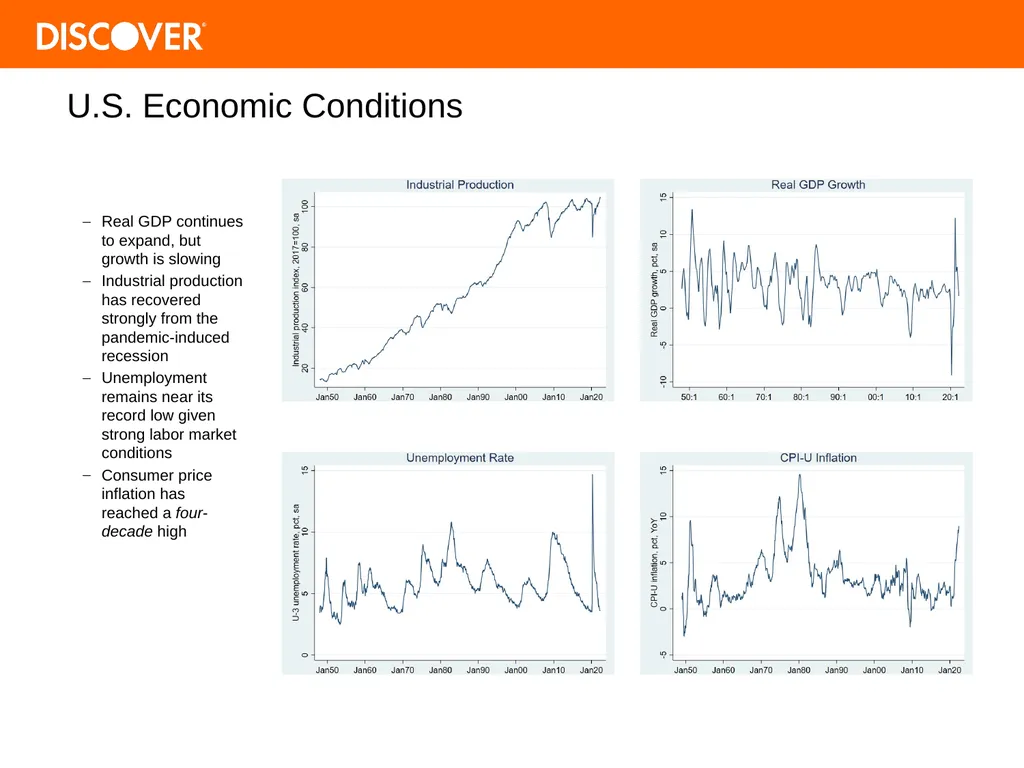
slide13. Real GDP continues to expand, but growth is slowing
Industrial production has recovered strongly from the pandemic-induced recession
Unemployment remains near its record low given strong labor market conditions
Consumer price inflation has reached a four-decade high U.S. Economic Conditions<br>

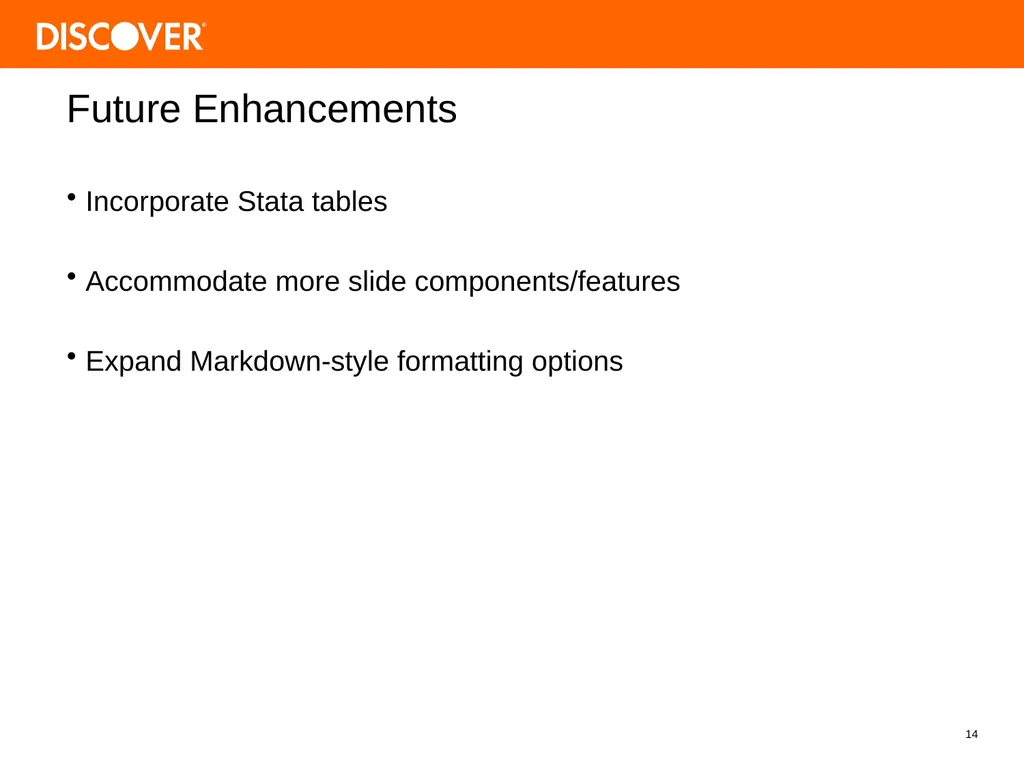
slide14. Incorporate Stata tables
Accommodate more slide components/features
Expand Markdown-style formatting options 14 Future Enhancements<br>
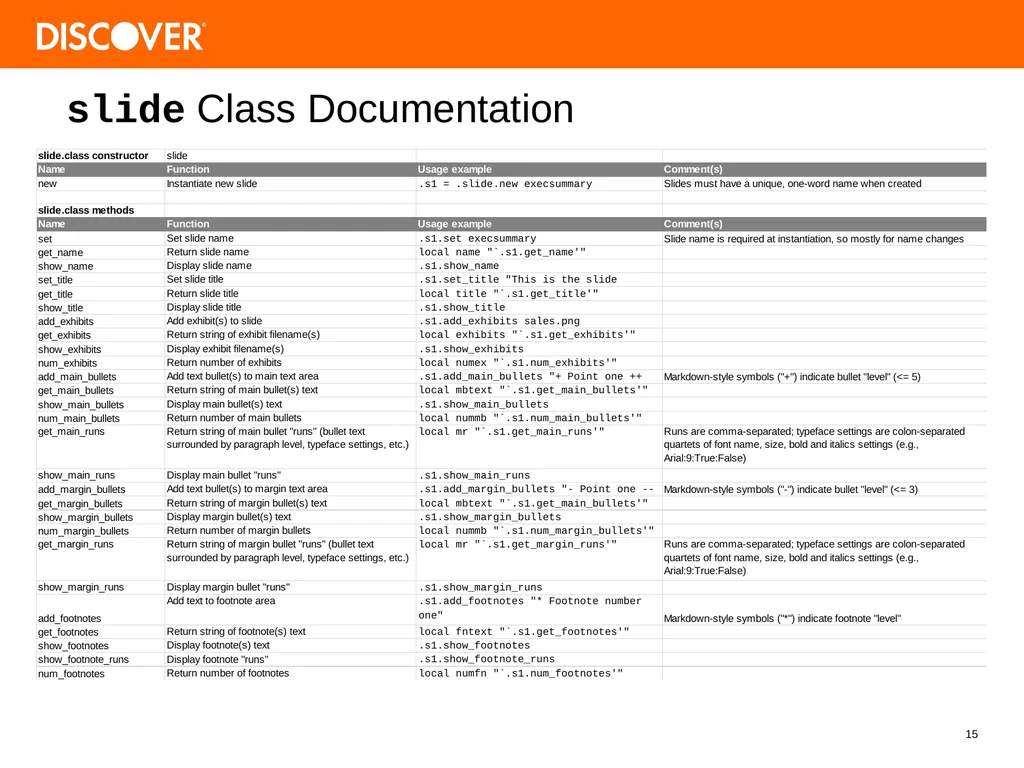
slide15. 15 slide Class Documentation<br>
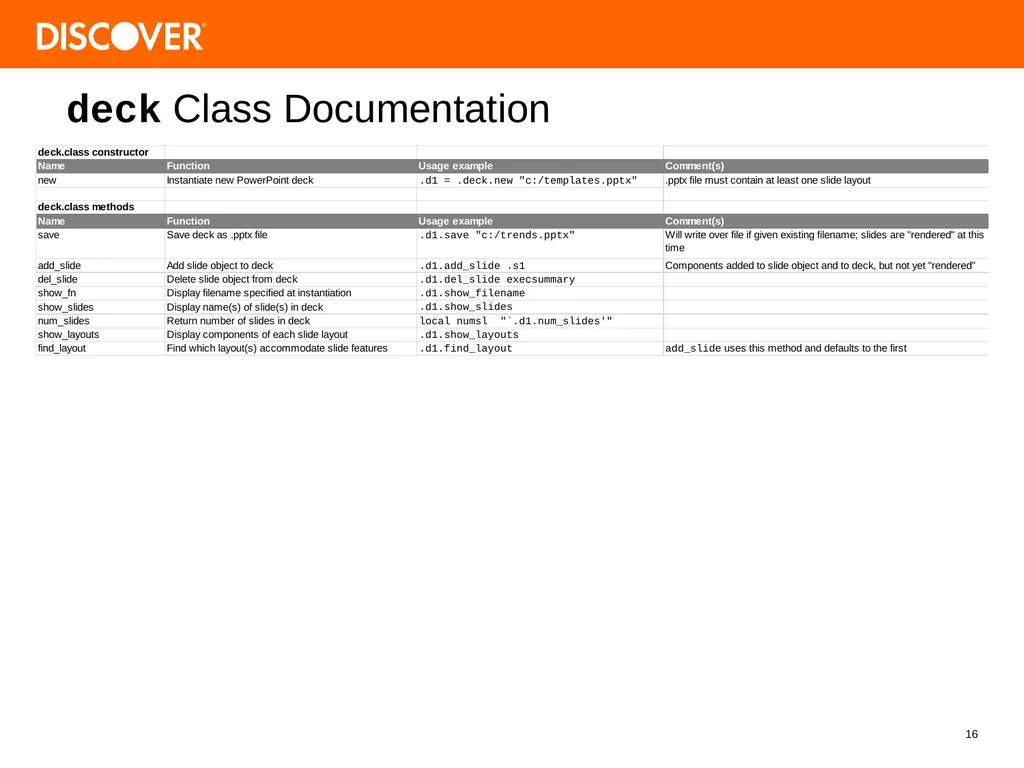
slide16. 16 deck Class Documentation<br>
August 4
Washington, DC Slide Deck: PowerPoint Presentations within Stata Tim Schmidt
Treasurer
Discover Financial Services<br>
slide2. “Slide Deck” is a suite of Stata programs in two Stata classes:
slide.class
deck.class
Facilitates the creation of PowerPoint presentations from within a Stata session
Takes advantage of Stata 17’s Python integration
Builds upon python-pptx Python library for creating and updating PowerPoint files
https://pypi.org/project/python-pptx/
https://github.com/scanny/python-pptx 2 Introducing “Slide Deck”<br>
slide3. Python version 3
https://python.org/downloads/
Python-pptx Python library
pip install python-pptx
slidedeck Python library
Included as source code in this project
Place it in your Python path
Stata version 17
Integrates Python 3 Prerequisites: What You Need<br>
slide4. Office 2007 and later versions use Open XML file formats (.pptx)
python-pptx library offers methods to create/edit .pptx format files
My slidedeck Python library simplifies use of python-pptx
slide and deck Stata classes encapsulate data for slide and deck constructs and programs to interact with slidedeck (directly) and python-pptx (indirectly)
To create a PowerPoint presentation:
Instantiate a deck using deck class
Instantiate one or more slides using slide class
Add slides to the deck and save it 4 How It Works<br>
slide5. 5 Terminology & Concepts deck objects contain slide objects
deck object must contain at least one “Layout”—a slide template
slide objects encapsulate data for the slide components (e.g., title, exhibits, etc.) and methods (programs) to act on the data
Use Markdown-style formatting in “main” and “margin” bullets
deck “renders” slides when user saves the deck
Deck becomes a PowerPoint presentation when user saves it as .pptx file<br>
slide6. 6 Sample Session (1:6) * Load and label monthly economic data
insheet using econmo.csv, comma clear
drop date
gen date = mofd(mdy(month, day, year))
format %tmMonYY date
order date
sort date
lab var icpiu "CPI-U index, 1982-84=100, sa"
lab var iip "Industrial production index, 2017=100, sa"
lab var ru3 "U-3 unemployment rate, pct, sa"
* Create time series graphs
line ru3 date, xtitle("") title("Unemployment Rate")
graph export ru3.png, replace
line iip date, xtitle("") title("Industrial Production")
graph export iip.png, replace Saving Stata graphs in PNG format (JPEG works too)<br>
slide7. 7 Sample Session (2:6) * Create inflation variable and graph it
gen pcpiu = ((icpiu/icpiu[_n-12])-1)*100
lab var pcpiu "CPI-U inflation, pct, YoY"
line pcpiu date, xtitle("") title("CPI-U Inflation")
graph export pcpiu.png, replace
save econmo, replace
* Load and label quarterly economic data
insheet using rgdp.csv, comma clear
drop date
gen date = qofd(mdy(month, day, year))
format %tqYY:q date
order date
sort date
lab var rgdp "Real GDP, 2012 dollars, sa"<br>
slide8. 8 Sample Session (3:6) * Create real GDP growth variable and graph it
gen rrgdp = ((rgdp/rgdp[_n-4])-1)*100
lab var rrgdp "Real GDP growth, pct, sa"
line rrgdp date, xtitle("") title("Real GDP Growth")
graph export rrgdp.png, replace
save econqtr, replace
* Create a new deck object
.d = .deck.new "dfsslides.pptx" Creating a new deck instance<br>
slide9. 9 Sample Session (4:6) * Create a four-graph slide and add it to the deck object
.s1 = .slide.new econoverview
.s1.set_title "U.S. Economic Conditions"
.s1.add_exhibits rrgdp.png iip.png ru3.png pcpiu.png
.s1.add_margin_bullets - Real GDP continues to expand, but growth is slowing
.s1.add_margin_bullets - Industrial production has recovered strongly from the pandemic-induced recession
.s1.add_margin_bullets - Unemployment remains near its record low given strong labor market conditions
.s1.add_margin_bullets - Consumer price inflation has reached a ^ four-decade ^ high
.d.add_slide .s1 Adding slide to deck Adding title, graphs (“exhibits”) and margin bullets to slide Note use of Markdown-style formatting Creating new slide instance<br>
slide10. 10 Sample Session (5:6) * Create an all-text slide and add it to the deck object
.s2 = .slide.new execsummary
.s2.set_title "Executive Summary"
.s2.add_main_bullets + ^16 U.S. economic expansion continues, but the pace of growth has slowed
.s2.add_main_bullets ++ Consensus forecast suggests below-trend growth in second half of 2022
.s2.add_main_bullets + ^16 Labor market conditions remain very strong amid high labor demand and low participation rates
.s2.add_main_bullets + ^16 Unusually high inflation will prompt tighter monetary policy from the Federal Reserve
.d.add_slide .s2 Note use of Markdown-style formatting Formatting syntax:
^ Italics
^^ Bold
^# Font size
^Fontname Font Bullet syntax:
+ “Main” bullet, level 1
++ “Main” bullet, level 2
- “Margin” bullet, level 1<br>
slide11. 11 Sample Session (6:6) * Show the slides in the deck
.d.show_slides
* Delete a slide from the deck and show that it's gone
.d.del_slide .s2
.d.show_slides
* Add the slide back, this time to the front of the deck
.d.add_slide .s2 1
.d.show_slides
* Save the deck with the two slides; slides are "rendered" at save
.d.save "econreview.pptx" You may delete slides… …and add them back in a new spot to reorder them Slides aren’t “rendered” until the deck is saved<br>
slide12. U.S. economic expansion continues, but the pace of growth has slowed
Consensus forecast suggests below-trend growth in second half of 2022
Labor market conditions remain very strong amid high labor demand and low participation rates
Unusually high inflation will prompt tighter monetary policy from the Federal Reserve Executive Summary<br>
slide13. Real GDP continues to expand, but growth is slowing
Industrial production has recovered strongly from the pandemic-induced recession
Unemployment remains near its record low given strong labor market conditions
Consumer price inflation has reached a four-decade high U.S. Economic Conditions<br>
slide14. Incorporate Stata tables
Accommodate more slide components/features
Expand Markdown-style formatting options 14 Future Enhancements<br>
slide15. 15 slide Class Documentation<br>
slide16. 16 deck Class Documentation<br>