
بسم الله الرحمن الرحيم Statistical Tools of
MJ
Published · 59 slides · 0 views
1 / 1




Description
بسم الله الرحمن الرحيم Statistical Tools of Pharmaceutical Control And Development الأدوات الإحصائية للرقابة الصيدلانية Figure 1 1 PART 1 Statistical Methods for Pharmaceutical Quality Control Analysis الطرق الإحصائية للتحليل ومراقبة
Related Topics
Share
Embed code
Download this presentation From Below
"بسم الله الرحمن الرحيم Statistical Tools of" is the property of its rightful owner. Permission is granted to download and print the materials on this website for personal, non-commercial use only, and to display it on your personal computer provided you do not modify the materials and that you retain all copyright notices contained in the materials. By downloading content from our website, you accept the terms of this agreement.
Presentation Transcript
01
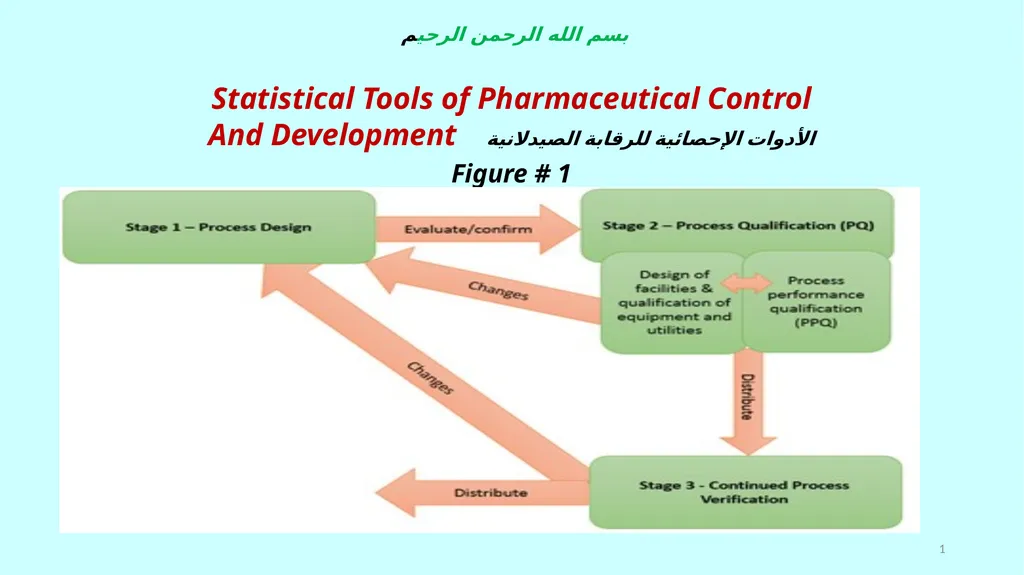
بسم الله الرحمن الرحيم Statistical Tools of Pharmaceutical Control
And Development الأدوات الإحصائية للرقابة الصيدلانية
Figure # 1 1<br>
And Development الأدوات الإحصائية للرقابة الصيدلانية
Figure # 1 1<br>
02
PART 1 –
Statistical Methods for Pharmaceutical
Quality Control Analysis
الطرق الإحصائية للتحليل ومراقبة الجودة للمنتج الصيدلاني
PH483 Lecture # 5 22-02-2021
DR. Badr M. Al-Hadiya 2<br>
Statistical Methods for Pharmaceutical
Quality Control Analysis
الطرق الإحصائية للتحليل ومراقبة الجودة للمنتج الصيدلاني
PH483 Lecture # 5 22-02-2021
DR. Badr M. Al-Hadiya 2<br>
03
3<br>
04
INTRODUCTION TO STATISTICAL QUALITY CONTROL The word "Quality" represents the properties of products and/or services that are valued by the consumer.
A system of maintaining standards in manufactured products by testing a sample of the output against the specification.
NEED OF QUALITY CONTROL:
◊In each process, excessive variations and errors can cause nonconformities, which leads to three undesirable consequences:
√ scrapped or wasted resources;
√ degraded process throughput;
√ “contamination” from undetected nonconformities,
√ reducing the value of the product to the customer 4<br>
05
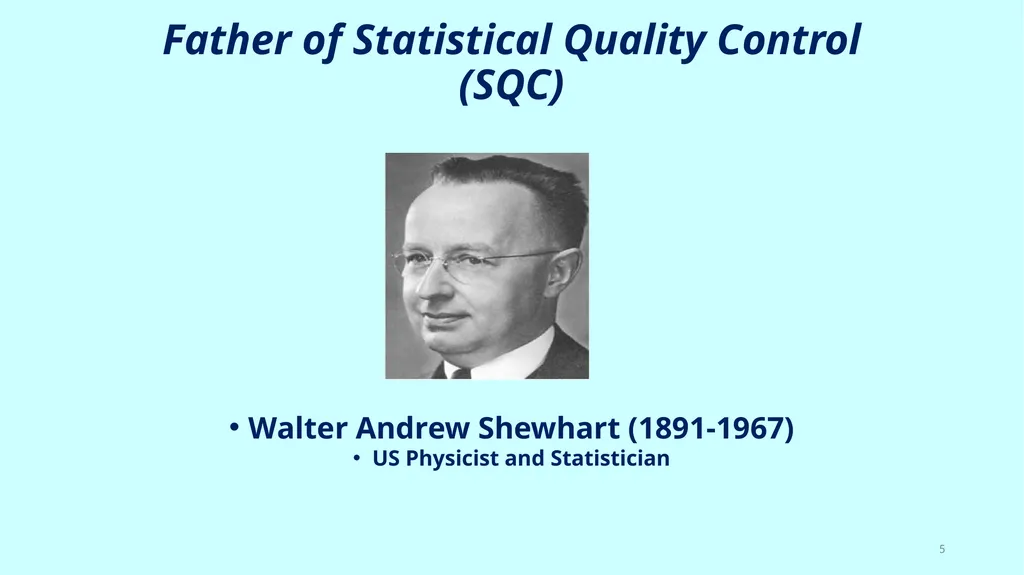
Father of Statistical Quality Control
(SQC) Walter Andrew Shewhart (1891-1967)
US Physicist and Statistician 5<br>
US Physicist and Statistician 5<br>
06
What is Statistical Quality Control (SQC) ?? Statistical Quality Control
Statistical methods are analytical tools used to evaluate men, materials, Machines, or processes. Evaluations obtained by these methods assist in maintaining desired result by using past history to predict capabilities or trends. Such analytical methods are management tools which furnish data to all levels supervision for appropriate action:
A method of quality control which uses statistical methods.
a collection of strategies, techniques, and actions taken by an organization to ensure they are producing a quality product or providing a quality service.
The objective of statistical quality control is to monitor production through many stages of manufacturing
The general category of statistical tools used to evaluate organizational quality. 6<br>
07
Introduction Statistics:
Statistics means the good amount of data to obtain reliable results. Its techniques find extensive applications in quality control, production planning and control, business charts, linear programming etc.
Quality:
Quality is a relative term and is generally explained with reference to the end use of the product. Quality is thus defined as fitness for purpose
Control:
Control is a system for measuring and checking or inspecting a phenomenon. It suggests when to inspect, how often to inspect and how much to inspect, how often to inspect 7<br>
08
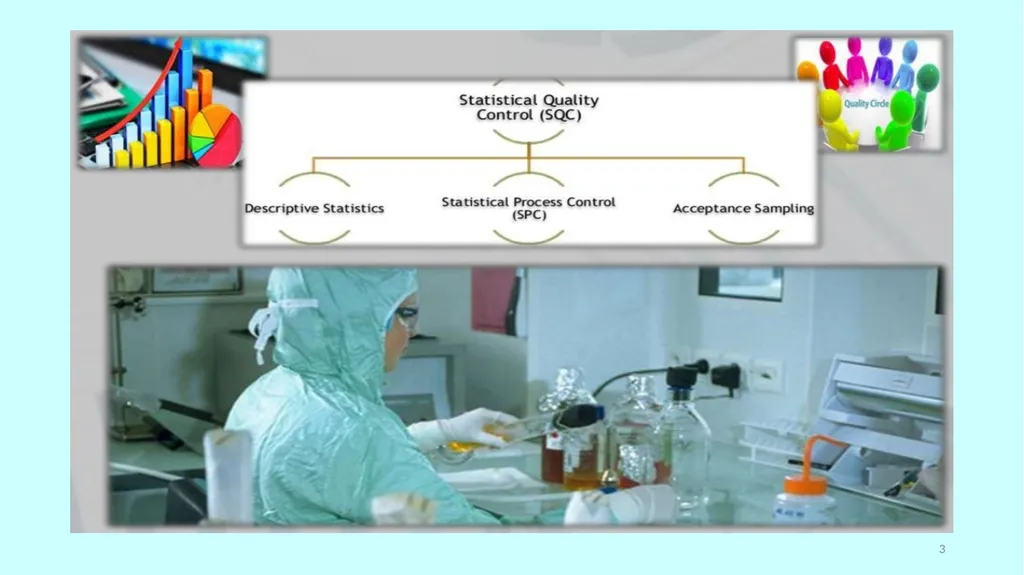
Statistical quality control (SQC) is the term used to describe the set of statistical tools used by quality professionals:
1. Descriptive Statistics: Is used to describe quality characteristics and relationships
2. Acceptance Sampling: The process of randomly inspecting a sample of goods and deciding whether to accept the entire lot based on the results
3. Statistical Process Control (SPC) A statistical tool that involves inspecting a random sample of output from a process and deciding whether the process is producing products with the characteristics that fall within a predetermined range. 8<br>
09
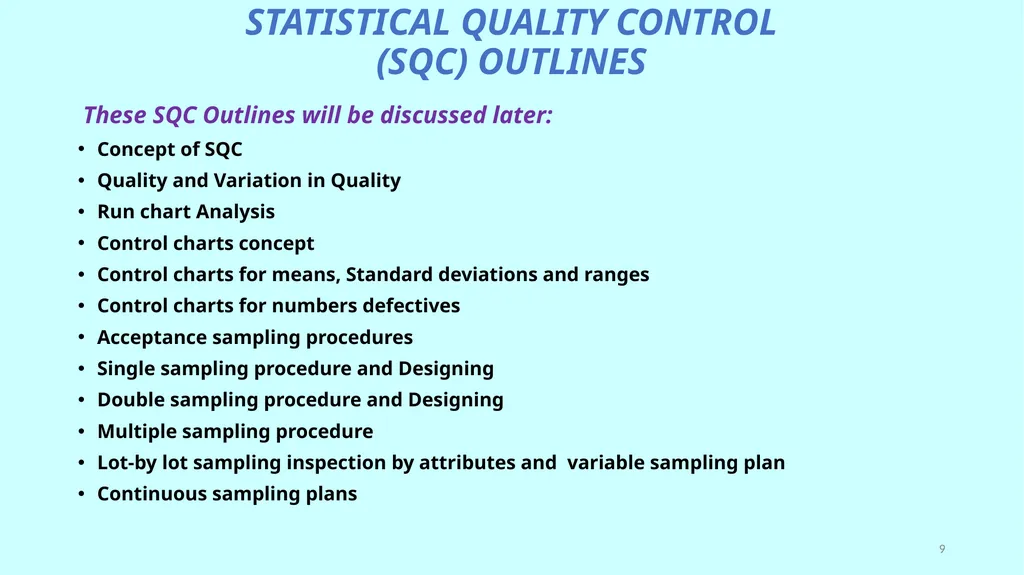
STATISTICAL QUALITY CONTROL
(SQC) OUTLINES These SQC Outlines will be discussed later:
Concept of SQC
Quality and Variation in Quality
Run chart Analysis
Control charts concept
Control charts for means, Standard deviations and ranges
Control charts for numbers defectives
Acceptance sampling procedures
Single sampling procedure and Designing
Double sampling procedure and Designing
Multiple sampling procedure
Lot-by lot sampling inspection by attributes and variable sampling plan
Continuous sampling plans 9<br>
10
Statistical Methods for Analysis Statistical Quality Control (SQC): Comprises the set of statistical tools used by quality control professionals. ... from a process and deciding whether the characteristics of the products in the ... Statistical methods deal with this by also measuring the degree of uncertainty. ... tools generally found in advanced simulation or statistical analysis textbooks.
The main objective of statistical quality control (SQC) is to achieve quality in production and service organizations, through the use of adequate statistical techniques. 10<br>
The main objective of statistical quality control (SQC) is to achieve quality in production and service organizations, through the use of adequate statistical techniques. 10<br>
11
What are the methods of statistical quality control?
Several techniques can be used to investigate the product for defects or defective pieces after all processing is complete. Typical tools of SQC are:
- Lot Acceptance sampling plans.
- Skip lot sampling plans.
What is statistical quality control in pharmacy?
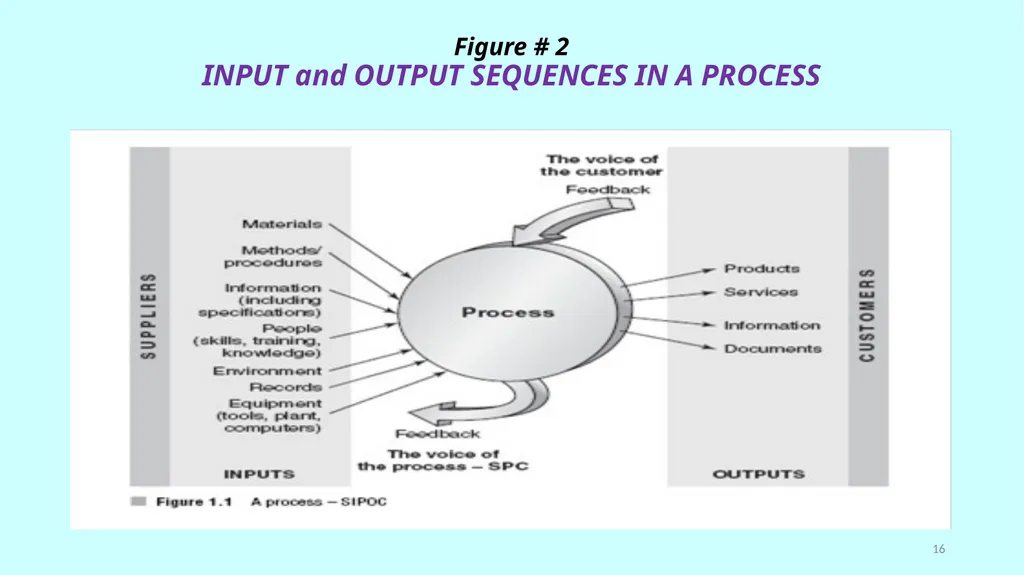
Statistical process control (SPC) involves inspecting a random sample of the output from a process and deciding whether the process is producing products with characteristics that fall within a predetermined range [See Figure # 2].
SPC answers the question of whether the process is functioning properly or not. 11<br>
12
What is quality control in statistics?
Statistical quality control (SQC), the use of statistical methods in the monitoring and maintaining of the quality of products and services. One method, referred to as acceptance sampling, can be used when a decision must be made to accept or reject a group of parts or items based on the quality found in a sample.
Statistical Process Control technique steps include:
- detection,
- study,
- prioritization,
- illumination and then
- charting.
Before using quality control software collect proper data for analysis. Consider first quality is a sequence of continuous improvement. 12<br>
13
BENEFITS OF STATISTICAL QUALITY
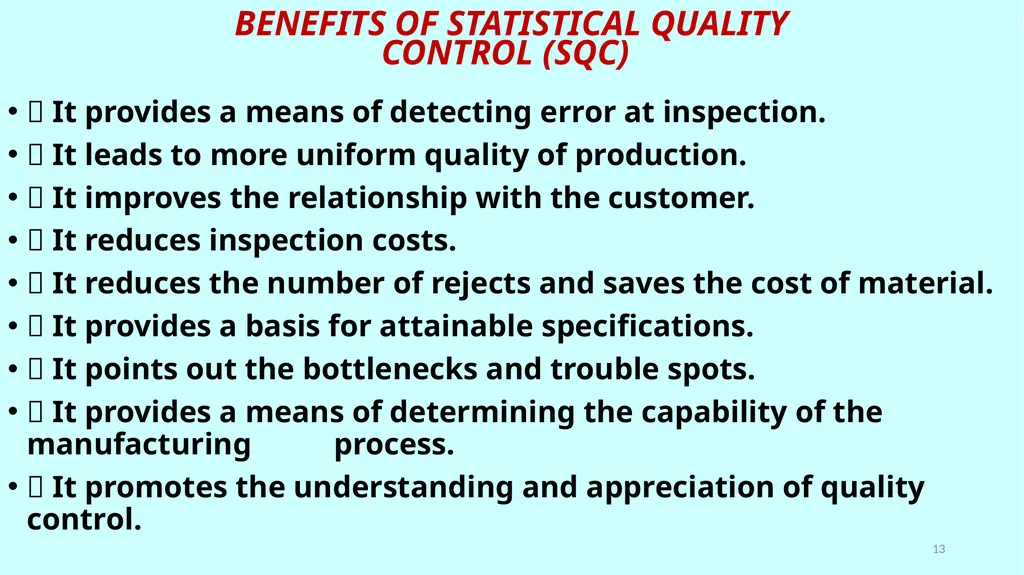
CONTROL (SQC) It provides a means of detecting error at inspection.
It leads to more uniform quality of production.
It improves the relationship with the customer.
It reduces inspection costs.
It reduces the number of rejects and saves the cost of material.
It provides a basis for attainable specifications.
It points out the bottlenecks and trouble spots.
It provides a means of determining the capability of the manufacturing process.
It promotes the understanding and appreciation of quality control. 13<br>
14
SQC Questions & answers What are the Basics of SQC for Pharmaceuticals? This presentation covers the basics of Statistical Quality Control which can be applied to Pharmaceutical processes. ... quality control categories are helpful in measuring and evaluating the quality of products or services.
What are the uses of statistical quality control?
The term Quality means a level or standard of a product which depends on Material, Manpower, Machines, and Management (4M’s). Quality Control ensures the quality specifications all along with them from the arrival of raw materials through each of their processing to the final delivery of goods. This technique is used in almost all’ production industries such as automobiles, textile, electrical equipment, biscuits, bath soaps, chemicals, petroleum products, etc.
What is statistical quality control techniques?
Statistical quality control, the use of statistical methods in the monitoring and maintaining of the quality of products and services. One method, referred to as acceptance sampling, can be used when a decision must be made to accept or reject a group of parts or items based on the quality found in a sample. 14<br>
15
WHAT IS STATISTICAL PROCESS CONTROL (SPC)? What is a process?
A process is the transformation of a set of inputs, which can include materials, actions, methods and operations, into desired outputs, in the form of products, information, services or – generally – results. In each area or function of an organization there will be many processes taking place. Each process may be analysed by an examination of the inputs and outputs. This will determine the action necessary to improve quality.
Statistical process control (SPC) is defined as the use of statistical techniques to control a process or production method. SPC tools and procedures can help you monitor process behavior, discover issues in internal systems, and find solutions for production issues. Statistical process control is often used interchangeably with statistical quality control (SQC). 15<br>
16
Figure # 2
INPUT and OUTPUT SEQUENCES IN A PROCESS 16<br>
17
Why SPC is the Most Important Tool of the SQC?
Measure the value of a quality characteristic
Help to identify a change or variation in some quality characteristic of
the product or process
Some Information about SPC:
SPC can be applied to any process.
There is inherent variation in any process which can be measured and “controlled”. SPC doesn’t eliminate variation, but it does allow the user to track special cause variation.
“SPC is a statistical method of separating variation resulting from special causes from natural variation and to establish and maintain consistency in the process, enabling process improvement.” 17<br>
18
What is the role of SPC in quality improvement? SPC Software guides you the type of action that is appropriate for improving the functioning of a process, analyze the return on investment and aid industries follow data-driven philosophy of quality improvement that values defect prevention over defect detection. SPC Software has number of tools to evaluate processes.
what is statistical process control quality tools?
Statistical process control (SPC) is defined as the use of statistical techniques to control a process or production method. SPC tools and procedures can help you monitor process behavior, discover issues in internal systems, and find solutions for production issues. 18<br>
19
What are the techniques used in quality control?
7 Management Tools For Quality Control:
- Flowchart. Most of us are familiar with flowcharts. ...
- Check Sheet. A check sheet is a basic quality tool that is used to collect data.
- Cause and Effect (fish bone) Diagram. ...
- Pareto Chart. ...
- Control Charts. ...
- Histograms. ...
-Scatter Diagrams.
What are the tools of statistical quality control?
Cause-and-effect diagram (or fishbone diagram)
Check sheet.
Control chart.
Histogram. 19<br>
What are the tools of statistical quality control?
Cause-and-effect diagram (or fishbone diagram)
Check sheet.
Control chart.
Histogram. 19<br>
20
What is the importance of statistical tools in quality control program?
Statistical analysis in quality control is where statistical methods are used to measure, monitor and maintain the overall quality of products. Over time, the results help processes, such as manufacturing, ensure that the procedures will produce more specification-conforming products, therefore creating less waste.
What is difference between SPC and SQC?
Activities which monitor a process in real-time to prevent defects while a lot is being manufactured are known as Statistical Process Controls (SPC). In contrast, activities which occur after manufacture to keep defects from reaching a patient by additional inspection are Statistical Quality Control (SQC).
Why do we need statistics?
Statistical knowledge helps you use the proper methods to collect the data, employ the correct analyses, and effectively present the results. Statistics is a crucial process behind how we make discoveries in science, make decisions based on data, and make predictions. 20<br>
21
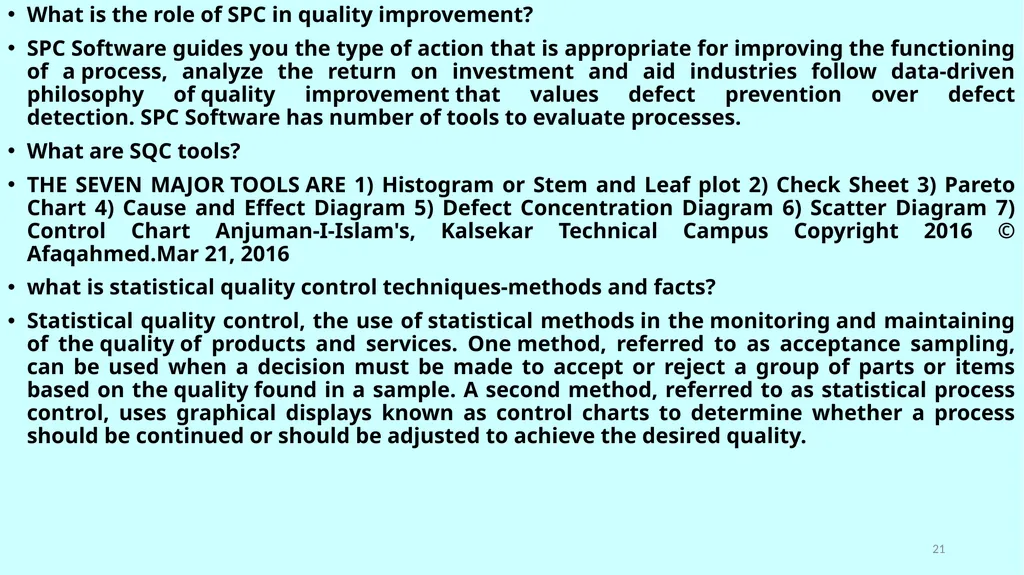
What is the role of SPC in quality improvement?
SPC Software guides you the type of action that is appropriate for improving the functioning of a process, analyze the return on investment and aid industries follow data-driven philosophy of quality improvement that values defect prevention over defect detection. SPC Software has number of tools to evaluate processes.
What are SQC tools?
THE SEVEN MAJOR TOOLS ARE 1) Histogram or Stem and Leaf plot 2) Check Sheet 3) Pareto Chart 4) Cause and Effect Diagram 5) Defect Concentration Diagram 6) Scatter Diagram 7) Control Chart Anjuman-I-Islam's, Kalsekar Technical Campus Copyright 2016 © Afaqahmed.Mar 21, 2016
what is statistical quality control techniques-methods and facts?
Statistical quality control, the use of statistical methods in the monitoring and maintaining of the quality of products and services. One method, referred to as acceptance sampling, can be used when a decision must be made to accept or reject a group of parts or items based on the quality found in a sample. A second method, referred to as statistical process control, uses graphical displays known as control charts to determine whether a process should be continued or should be adjusted to achieve the desired quality. 21<br>
22
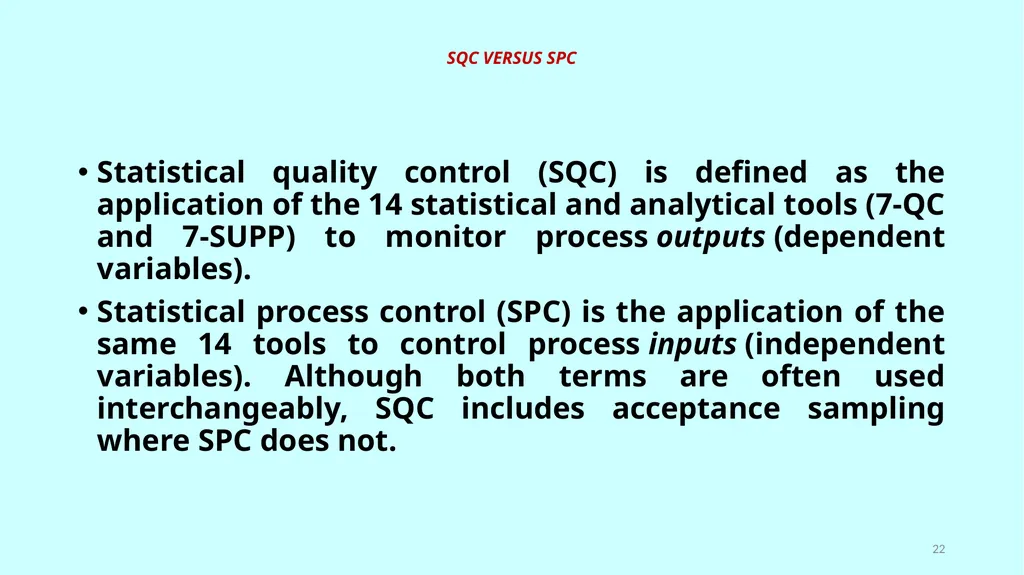
SQC VERSUS SPC Statistical quality control (SQC) is defined as the application of the 14 statistical and analytical tools (7-QC and 7-SUPP) to monitor process outputs (dependent variables).
Statistical process control (SPC) is the application of the same 14 tools to control process inputs (independent variables). Although both terms are often used interchangeably, SQC includes acceptance sampling where SPC does not. 22<br>
Statistical process control (SPC) is the application of the same 14 tools to control process inputs (independent variables). Although both terms are often used interchangeably, SQC includes acceptance sampling where SPC does not. 22<br>
23
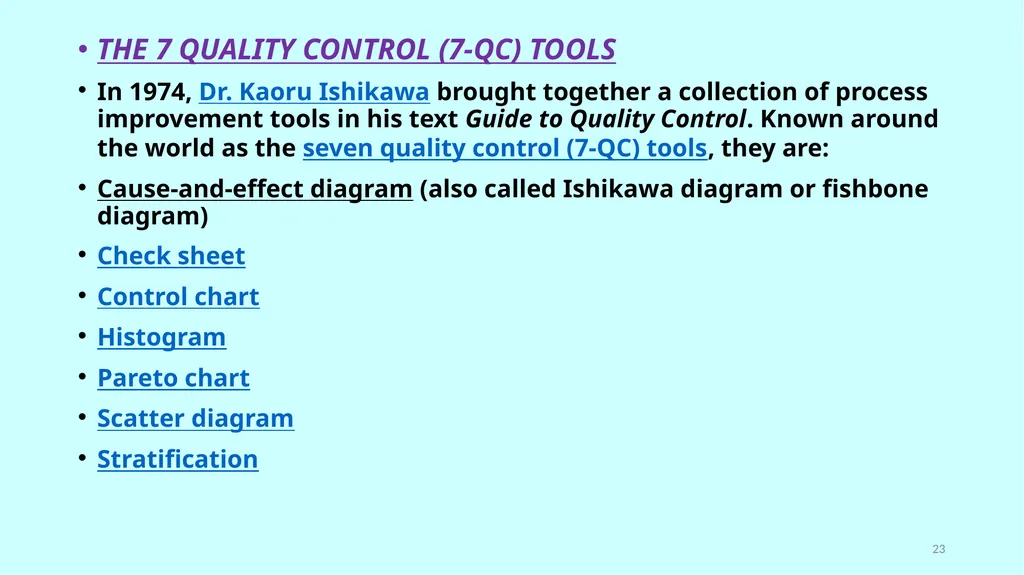
THE 7 QUALITY CONTROL (7-QC) TOOLS
In 1974, Dr. Kaoru Ishikawa brought together a collection of process improvement tools in his text Guide to Quality Control. Known around the world as the seven quality control (7-QC) tools, they are:
Cause-and-effect diagram (also called Ishikawa diagram or fishbone diagram)
Check sheet
Control chart
Histogram
Pareto chart
Scatter diagram
Stratification 23<br>
24
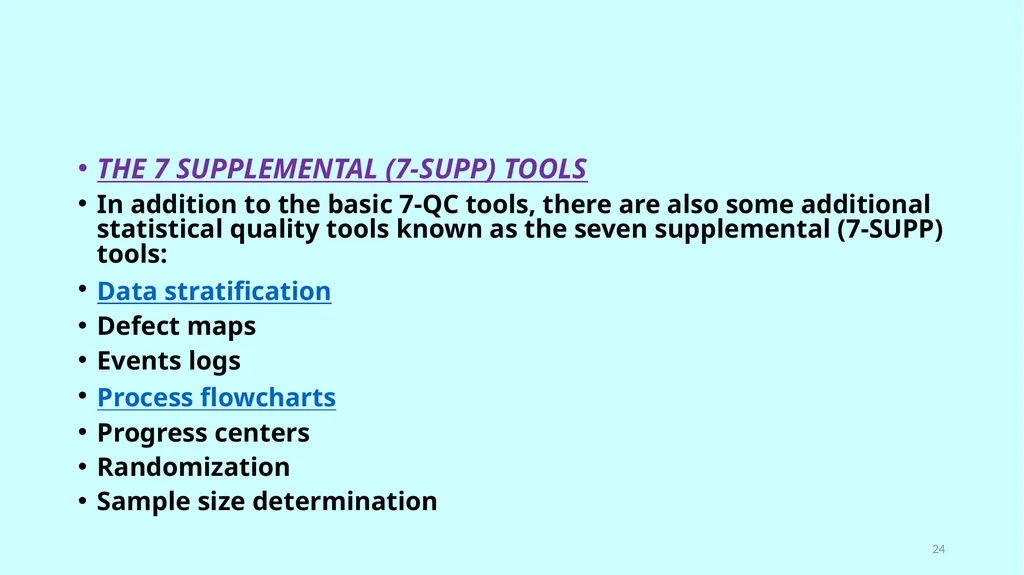
THE 7 SUPPLEMENTAL (7-SUPP) TOOLS
In addition to the basic 7-QC tools, there are also some additional statistical quality tools known as the seven supplemental (7-SUPP) tools:
Data stratification
Defect maps
Events logs
Process flowcharts
Progress centers
Randomization
Sample size determination 24<br>
In addition to the basic 7-QC tools, there are also some additional statistical quality tools known as the seven supplemental (7-SUPP) tools:
Data stratification
Defect maps
Events logs
Process flowcharts
Progress centers
Randomization
Sample size determination 24<br>
25
DEFINITIONS, CALCULATIONS and APPLICATIONS
of
ESSENTIAL STATISTICAL VARIABLES FOR
PHARMACEUTICAL QUALITY CONTROL 25<br>
of
ESSENTIAL STATISTICAL VARIABLES FOR
PHARMACEUTICAL QUALITY CONTROL 25<br>
26
What is statistics in simple words?
Statistics is a branch of applied mathematics dealing with data collection, organization, analysis, interpretation and presentation. Descriptive statistics summarize data. ... In addition to being the name of a field of study, the word "statistics" also refers to numbers that are used to describe data or relationships.
What is a statistical tool?
Statistical methods involved in carrying out a study include planning, designing, collecting data, analysing, drawing meaningful interpretation and reporting of the research findings. ... An idea of the sample size estimation, power analysis and the statistical errors is given.
What is variable in statistics?
A variable is any characteristics, number, or quantity that can be measured or counted. A variable may also be called a data item. Age, sex, business income and expenses, country of birth, capital expenditure, class grades, eye colour and vehicle type are examples of variables.
What is the primary function of statistical analysis?
The goal of statistical analysis is to identify trends. A retail business, for example, might use statistical analysis to find patterns in unstructured and semi-structured customer data that can be used to create a more positive customer experience and increase sales. 26<br>
27
Why do we calculate mean?
Our goal is to obtain a numerical value that describes and tells us where all the values in our data tend to. ... From our basic knowledge of statistics we can define mean as the summation of all numerical values in a given set of data divided by the number of values in the set.
What is difference between mean and average?
The average is the sum of all values divided by the number of values. ... In statistics, mean is the average of the given sample or data set. It is equal to the total of observation divided by the number of observations. Average, which is the arithmetic mean, and is calculated by adding a group of numbers and then dividing by the count of those numbers. For example, the average of 2, 3, 3, 5, 7, and 10 is 30 divided by 6, which is 5.
What is statistics and its functions?
(1) Statistics helps in providing a better understanding and exact description of a phenomenon of nature.
(2) Statistics helps in the proper and efficient planning of a statistical inquiry in any field of study.
(3) Statistics helps in collecting appropriate quantitative data. 27<br>
28
What are the applications of statistics? Statistics help in providing data as well as tools to analyze the data. Some powerful techniques are index numbers, time series analysis, and also forecasting. These are immensely useful in the analysis of data in economic planning. Further, statistical techniques help in framing planning models too. 28<br>
29
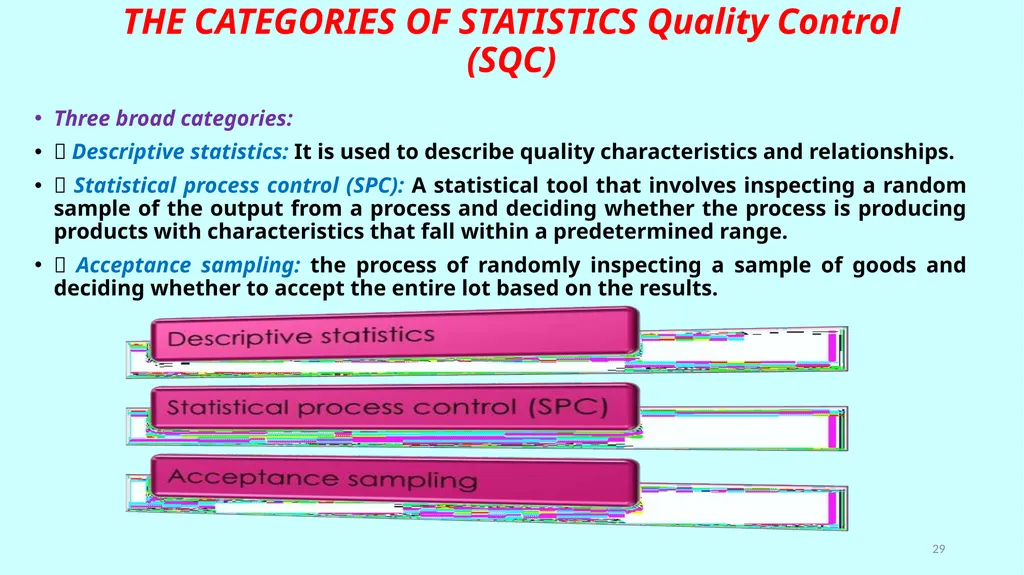
THE CATEGORIES OF STATISTICS Quality Control
(SQC) Three broad categories:
Descriptive statistics: It is used to describe quality characteristics and relationships.
Statistical process control (SPC): A statistical tool that involves inspecting a random sample of the output from a process and deciding whether the process is producing products with characteristics that fall within a predetermined range.
Acceptance sampling: the process of randomly inspecting a sample of goods and deciding whether to accept the entire lot based on the results. 29<br>
30
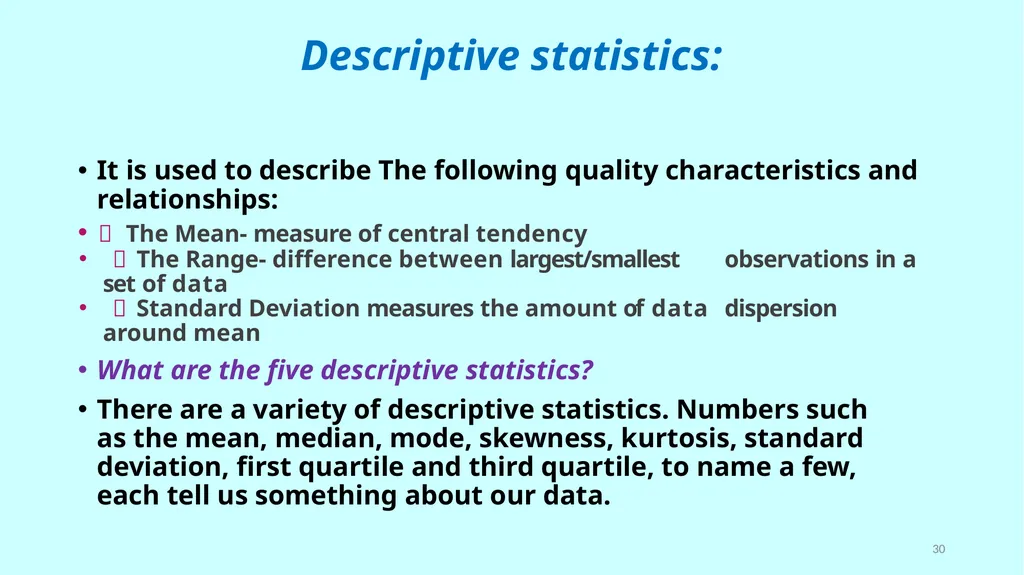
Descriptive statistics: It is used to describe The following quality characteristics and relationships:
The Mean- measure of central tendency
The Range- difference between largest/smallest observations in a set of data
Standard Deviation measures the amount of data dispersion around mean
What are the five descriptive statistics?
There are a variety of descriptive statistics. Numbers such as the mean, median, mode, skewness, kurtosis, standard deviation, first quartile and third quartile, to name a few, each tell us something about our data. 30<br>
31
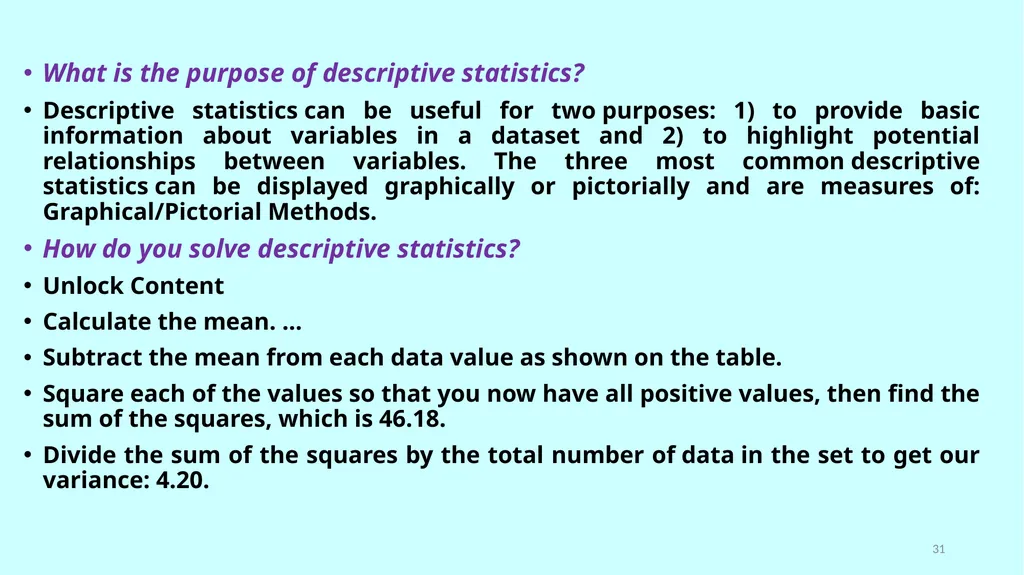
What is the purpose of descriptive statistics?
Descriptive statistics can be useful for two purposes: 1) to provide basic information about variables in a dataset and 2) to highlight potential relationships between variables. The three most common descriptive statistics can be displayed graphically or pictorially and are measures of: Graphical/Pictorial Methods.
How do you solve descriptive statistics?
Unlock Content
Calculate the mean. ...
Subtract the mean from each data value as shown on the table.
Square each of the values so that you now have all positive values, then find the sum of the squares, which is 46.18.
Divide the sum of the squares by the total number of data in the set to get our variance: 4.20. 31<br>
32
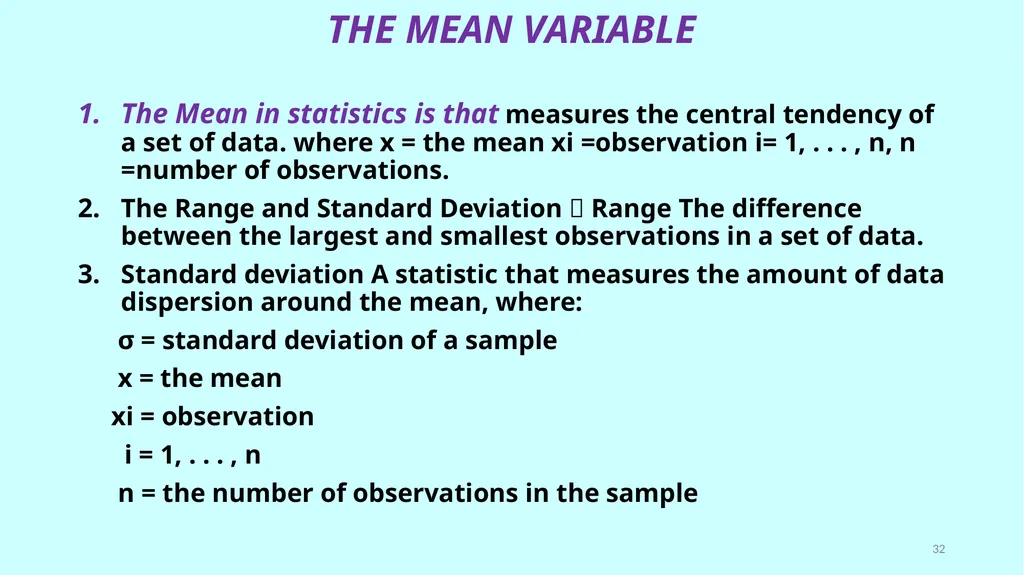
THE MEAN VARIABLE The Mean in statistics is that measures the central tendency of a set of data. where x = the mean xi =observation i= 1, . . . , n, n =number of observations.
The Range and Standard Deviation Range The difference between the largest and smallest observations in a set of data.
Standard deviation A statistic that measures the amount of data dispersion around the mean, where:
σ = standard deviation of a sample
x = the mean
xi = observation
i = 1, . . . , n
n = the number of observations in the sample 32<br>
33
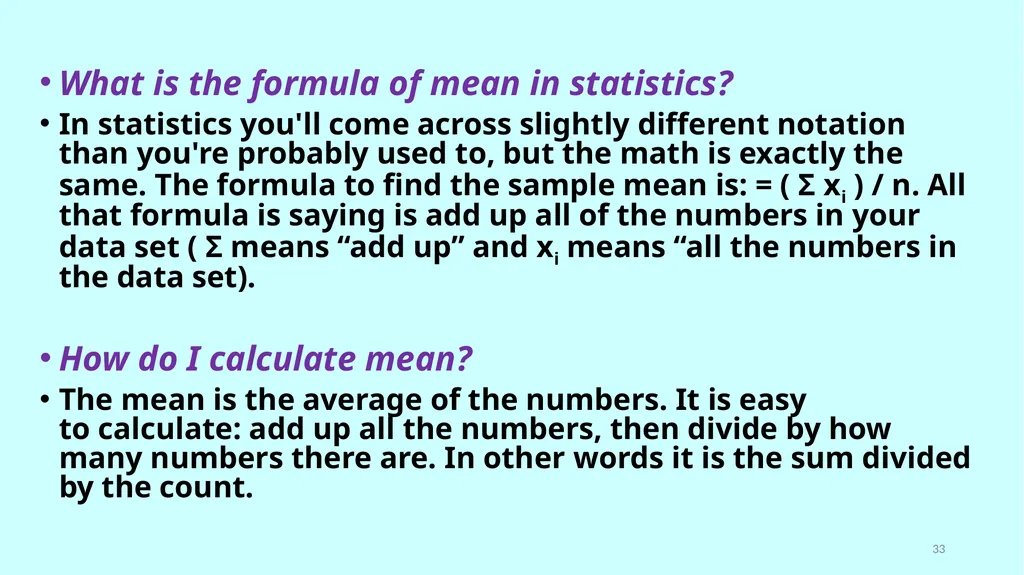
What is the formula of mean in statistics?
In statistics you'll come across slightly different notation than you're probably used to, but the math is exactly the same. The formula to find the sample mean is: = ( Σ xi ) / n. All that formula is saying is add up all of the numbers in your data set ( Σ means “add up” and xi means “all the numbers in the data set).
How do I calculate mean?
The mean is the average of the numbers. It is easy to calculate: add up all the numbers, then divide by how many numbers there are. In other words it is the sum divided by the count. 33<br>
34
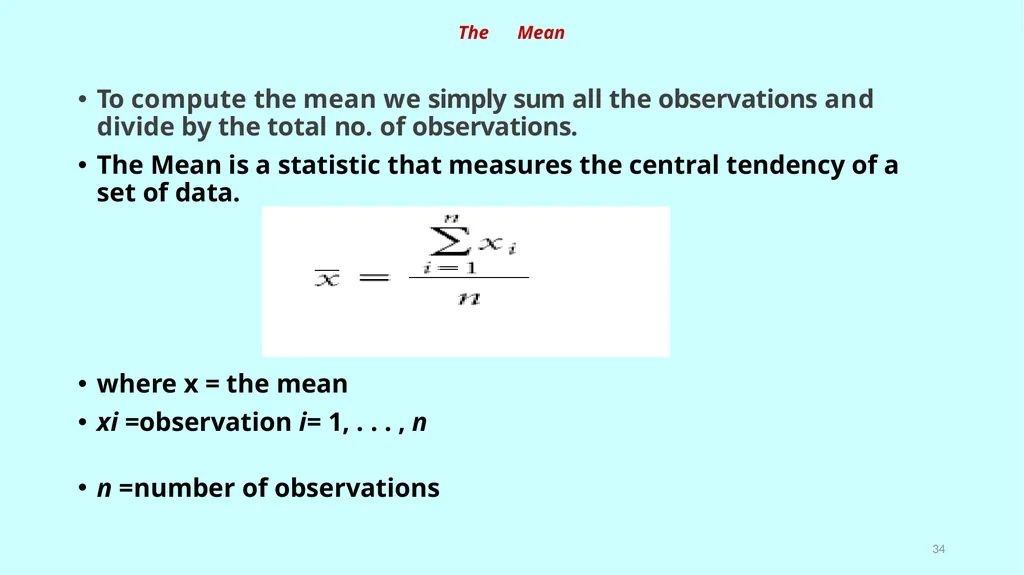
The Mean To compute the mean we simply sum all the observations and divide by the total no. of observations.
The Mean is a statistic that measures the central tendency of a set of data.
where x = the mean
xi =observation i= 1, . . . , n
n =number of observations 34<br>
The Mean is a statistic that measures the central tendency of a set of data.
where x = the mean
xi =observation i= 1, . . . , n
n =number of observations 34<br>
35
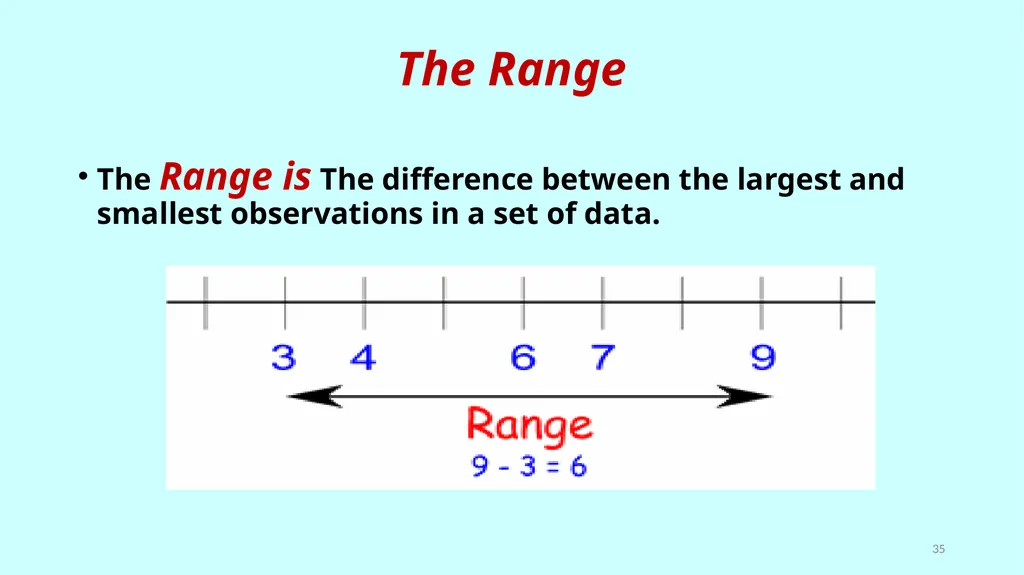
The Range The Range is The difference between the largest and smallest observations in a set of data. 35<br>
36
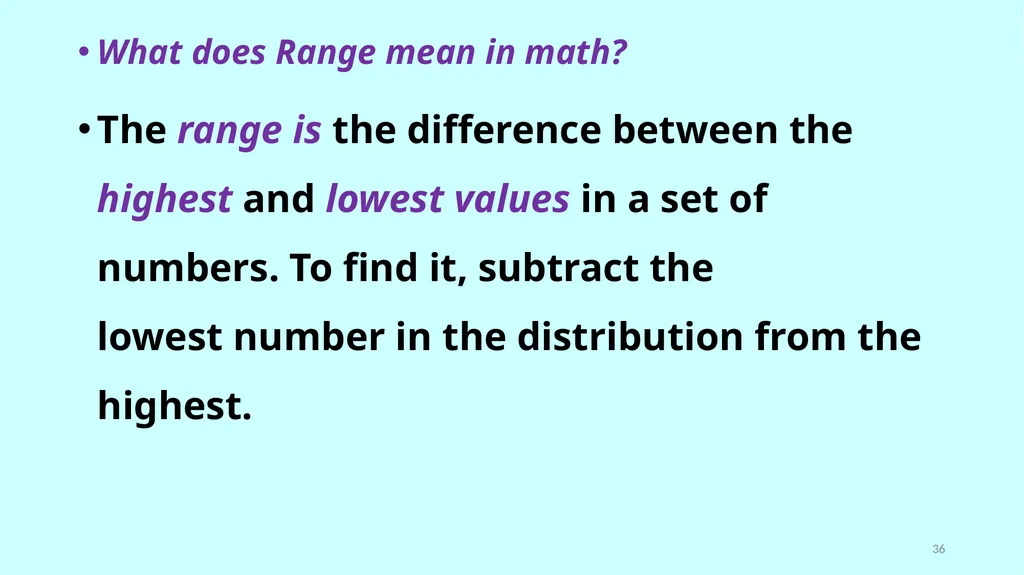
What does Range mean in math?
The range is the difference between the highest and lowest values in a set of numbers. To find it, subtract the lowest number in the distribution from the highest. 36<br>
The range is the difference between the highest and lowest values in a set of numbers. To find it, subtract the lowest number in the distribution from the highest. 36<br>
37
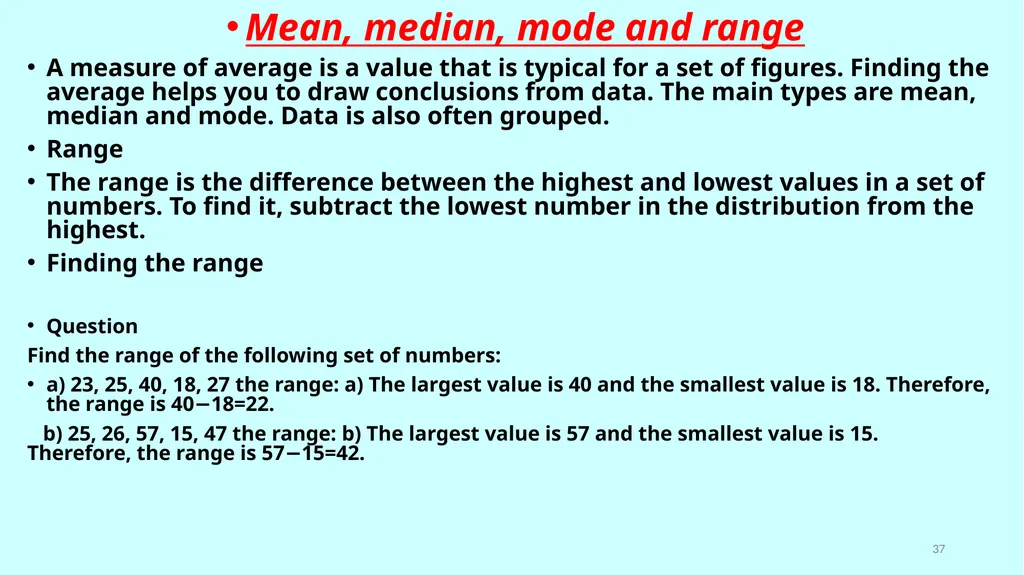
Mean, median, mode and range
A measure of average is a value that is typical for a set of figures. Finding the average helps you to draw conclusions from data. The main types are mean, median and mode. Data is also often grouped.
Range
The range is the difference between the highest and lowest values in a set of numbers. To find it, subtract the lowest number in the distribution from the highest.
Finding the range
Question
Find the range of the following set of numbers:
a) 23, 25, 40, 18, 27 the range: a) The largest value is 40 and the smallest value is 18. Therefore, the range is 40−18=22.
b) 25, 26, 57, 15, 47 the range: b) The largest value is 57 and the smallest value is 15. Therefore, the range is 57−15=42. 37<br>
38
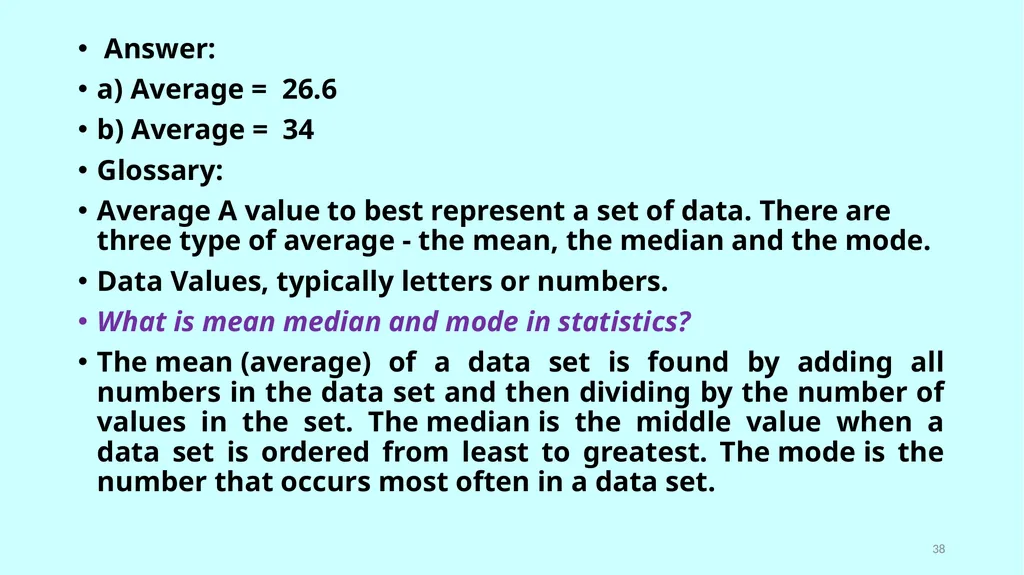
Answer:
a) Average = 26.6
b) Average = 34
Glossary:
Average A value to best represent a set of data. There are three type of average - the mean, the median and the mode.
Data Values, typically letters or numbers.
What is mean median and mode in statistics?
The mean (average) of a data set is found by adding all numbers in the data set and then dividing by the number of values in the set. The median is the middle value when a data set is ordered from least to greatest. The mode is the number that occurs most often in a data set. 38<br>
39
How do you interpret mean median and mode?
The mode is the value that occurs most frequently in a set of observations. Minitab also displays how many data points equal the mode. The mean and median require a calculation, but the mode is determined by counting the number of times each value occurs in a data set.
What is formula of mode in statistics?
Mean Median Mode Formula This is found by adding the numbers in a data set and dividing by the number of observations in the data set. ... The mode is the value that occurs the most often in a data set and the range is the difference between the highest and lowest values in a data set.
Why mean is important in statistics?
The mean is an important measure because it incorporates the score from every subject in the research study. ... Mode is the value that occurs most often and does not provide an indication of all the values collected in a research, but rather it expresses the most repeated value. 39<br>
40
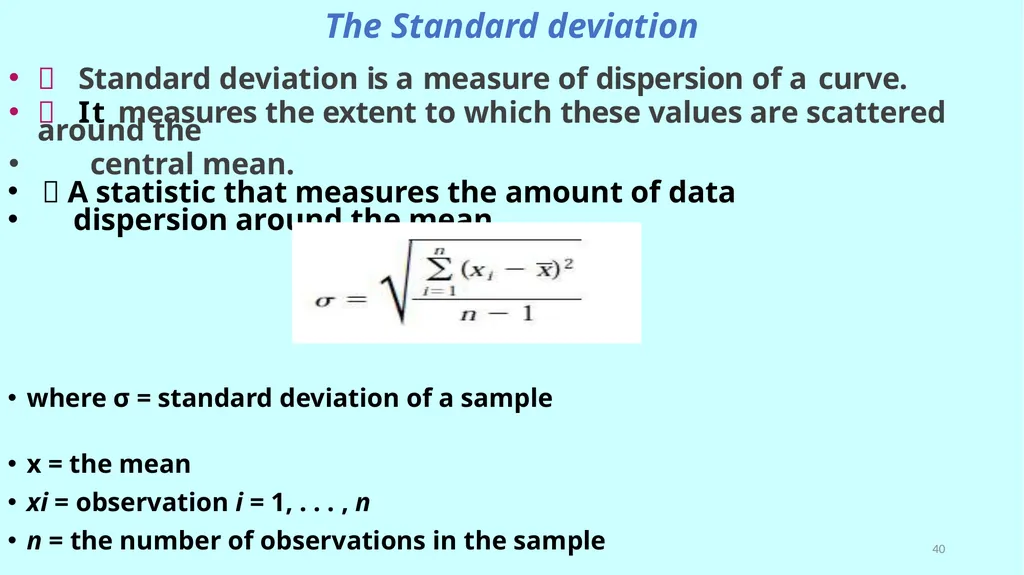
The Standard deviation Standard deviation is a measure of dispersion of a curve.
It measures the extent to which these values are scattered around the
central mean.
A statistic that measures the amount of data
dispersion around the mean.
where σ = standard deviation of a sample
x = the mean
xi = observation i = 1, . . . , n
n = the number of observations in the sample 40<br>
It measures the extent to which these values are scattered around the
central mean.
A statistic that measures the amount of data
dispersion around the mean.
where σ = standard deviation of a sample
x = the mean
xi = observation i = 1, . . . , n
n = the number of observations in the sample 40<br>
41
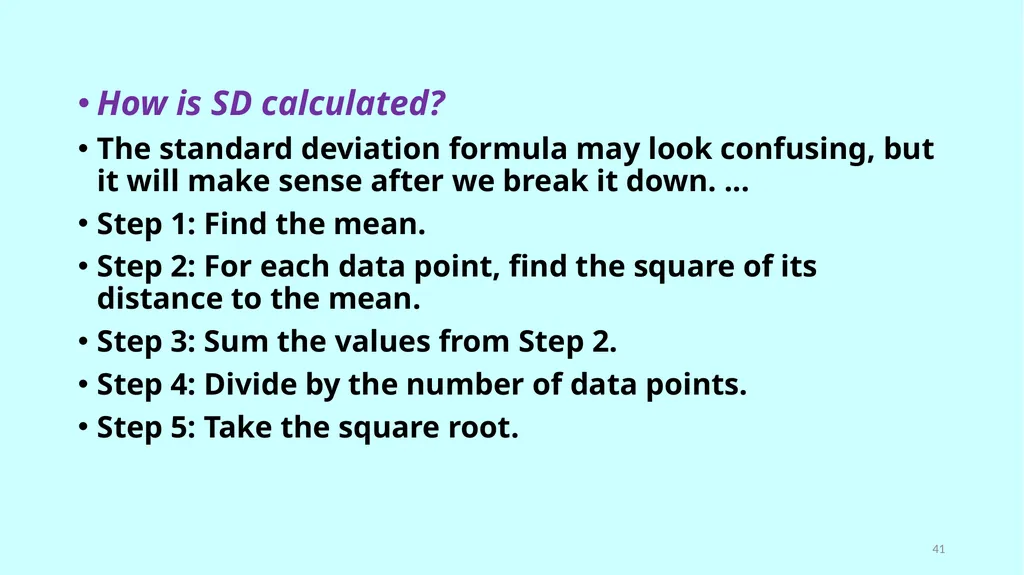
How is SD calculated?
The standard deviation formula may look confusing, but it will make sense after we break it down. ...
Step 1: Find the mean.
Step 2: For each data point, find the square of its distance to the mean.
Step 3: Sum the values from Step 2.
Step 4: Divide by the number of data points.
Step 5: Take the square root. 41<br>
42
CHEMICAL PURITY and its CONTROL
PH483 Lecture # 5 22-02-2021
DR. Badr M. Al-Hadiya 42<br>
PH483 Lecture # 5 22-02-2021
DR. Badr M. Al-Hadiya 42<br>
43
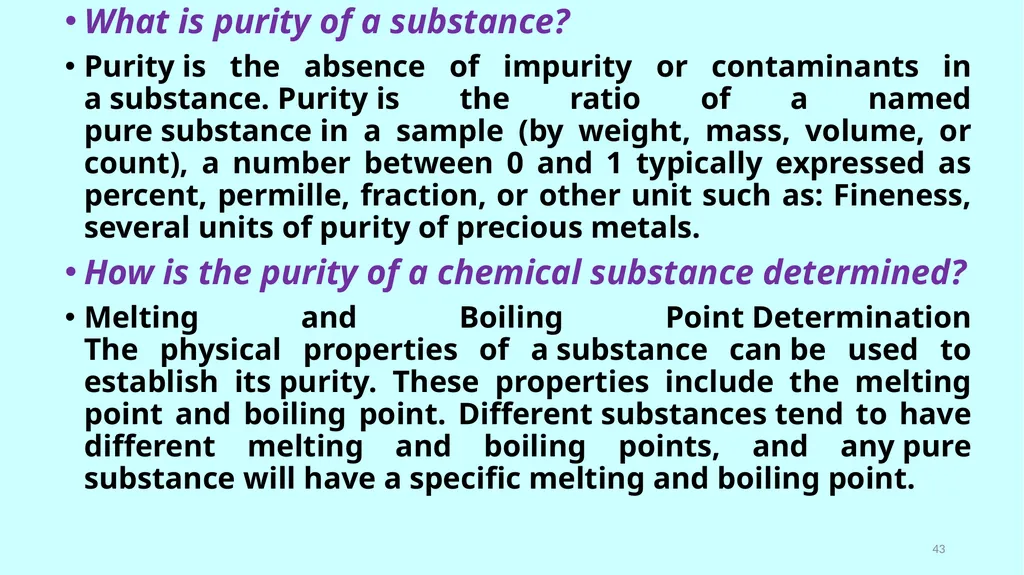
What is purity of a substance?
Purity is the absence of impurity or contaminants in a substance. Purity is the ratio of a named pure substance in a sample (by weight, mass, volume, or count), a number between 0 and 1 typically expressed as percent, permille, fraction, or other unit such as: Fineness, several units of purity of precious metals.
How is the purity of a chemical substance determined?
Melting and Boiling Point Determination The physical properties of a substance can be used to establish its purity. These properties include the melting point and boiling point. Different substances tend to have different melting and boiling points, and any pure substance will have a specific melting and boiling point. 43<br>
44
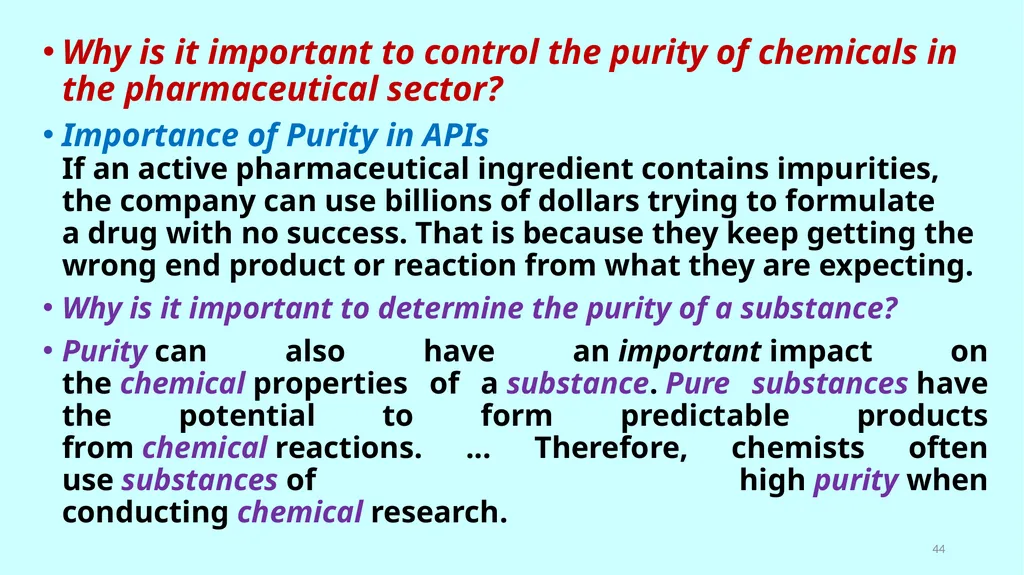
Why is it important to control the purity of chemicals in the pharmaceutical sector?
Importance of Purity in APIs If an active pharmaceutical ingredient contains impurities, the company can use billions of dollars trying to formulate a drug with no success. That is because they keep getting the wrong end product or reaction from what they are expecting.
Why is it important to determine the purity of a substance?
Purity can also have an important impact on the chemical properties of a substance. Pure substances have the potential to form predictable products from chemical reactions. ... Therefore, chemists often use substances of high purity when conducting chemical research. 44<br>
45
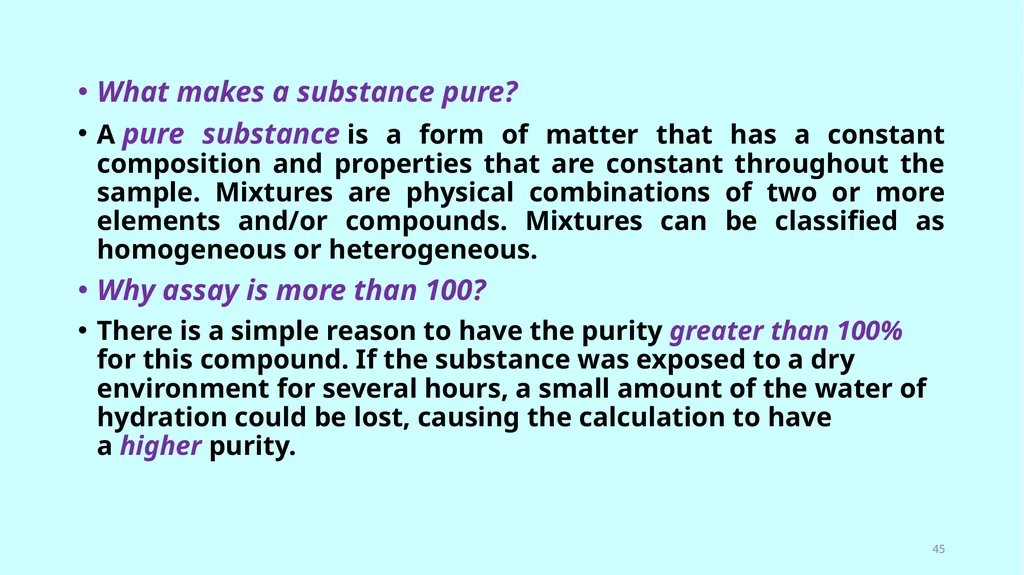
What makes a substance pure?
A pure substance is a form of matter that has a constant composition and properties that are constant throughout the sample. Mixtures are physical combinations of two or more elements and/or compounds. Mixtures can be classified as homogeneous or heterogeneous.
Why assay is more than 100?
There is a simple reason to have the purity greater than 100% for this compound. If the substance was exposed to a dry environment for several hours, a small amount of the water of hydration could be lost, causing the calculation to have a higher purity. 45<br>
46
Do pure substances have higher melting points?
The melting point of a pure substance is always higher and has a smaller range than the melting point of an impure substance or, more generally, of mixtures. The higher the quantity of other components, the lower the melting point and the broader will be the melting point range, often referred to as the "pasty range".
How do you calculate purity?
Percentage purity of a substance can be calculated by dividing the mass of the pure chemical by the total mass of the sample, and then multiplying this number by 100. 46<br>
47
What is purity in pharmaceutical?
Purity is the measurement of the quantity of a prevalent component of a drug substance when only that component is present. ... Titrations such as acid–base, oxidative, or precipitate are conventionally used per the USP for the determination of strength, potency, or purity of drug substance.
Is distilled water a pure substance?
Water, H2O, is a pure substance, a compound made of hydrogen and oxygen. ... Pure water is called distilled water or deionized water. In distilled water all of the dissolved substances mixed in water have been removed by evaporation. As water evaporates, it distills, or leaves the salt behind. 47<br>
48
What are the differences between pure and impure substances?
Impure substances are made up of two or more pure substances mixed together in any proportion. They may be homogeneous or heterogeneous i.e. their composition is not uniform throughout the bulk. They are all mixtures. Examples: air, sea water, petroleum, a solution of sugar in water are all impure substances.
What are 5 pure substances?
Examples of pure substances include tin, sulfur, diamond, water, pure sugar (sucrose), table salt (sodium chloride) and baking soda (sodium bicarbonate). Crystals, in general, are pure substances. Tin, sulfur, and diamond are examples of pure substances that are chemical elements. 48<br>
49
What are the two types of pure substances?
Based on their chemical composition, pure substances are classified into two categories: Elements. Compounds.
Is 100 purity possible?
Assay values that exceed 100% are not uncommon in the Pharmaceutical industry where formulators use pure API drug substances to which they add inactive ingredients, referred to as an excipient, to arrive at a target concentration of a formulated drug product. 49<br>
50
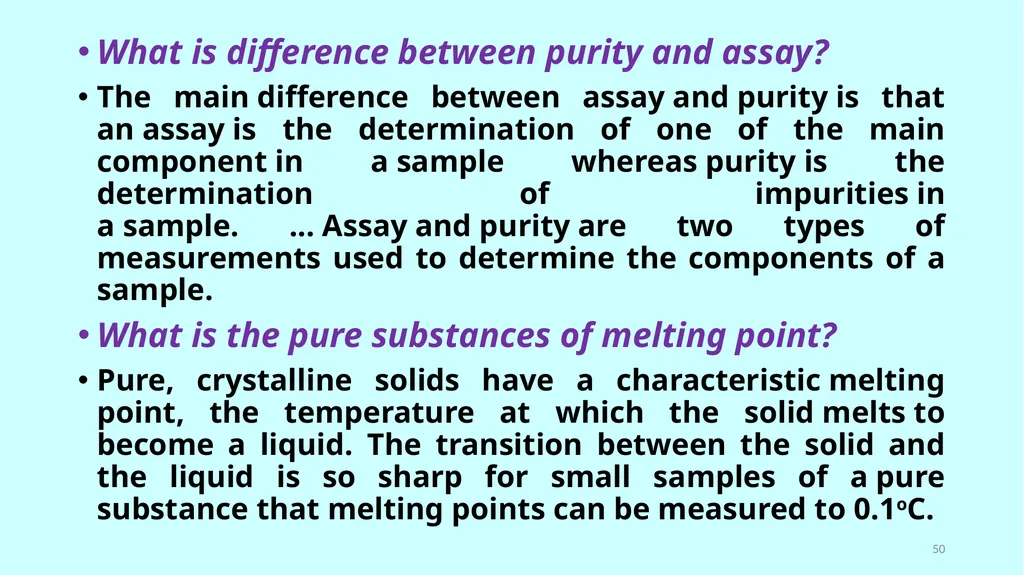
What is difference between purity and assay?
The main difference between assay and purity is that an assay is the determination of one of the main component in a sample whereas purity is the determination of impurities in a sample. ... Assay and purity are two types of measurements used to determine the components of a sample.
What is the pure substances of melting point?
Pure, crystalline solids have a characteristic melting point, the temperature at which the solid melts to become a liquid. The transition between the solid and the liquid is so sharp for small samples of a pure substance that melting points can be measured to 0.1oC. 50<br>
51
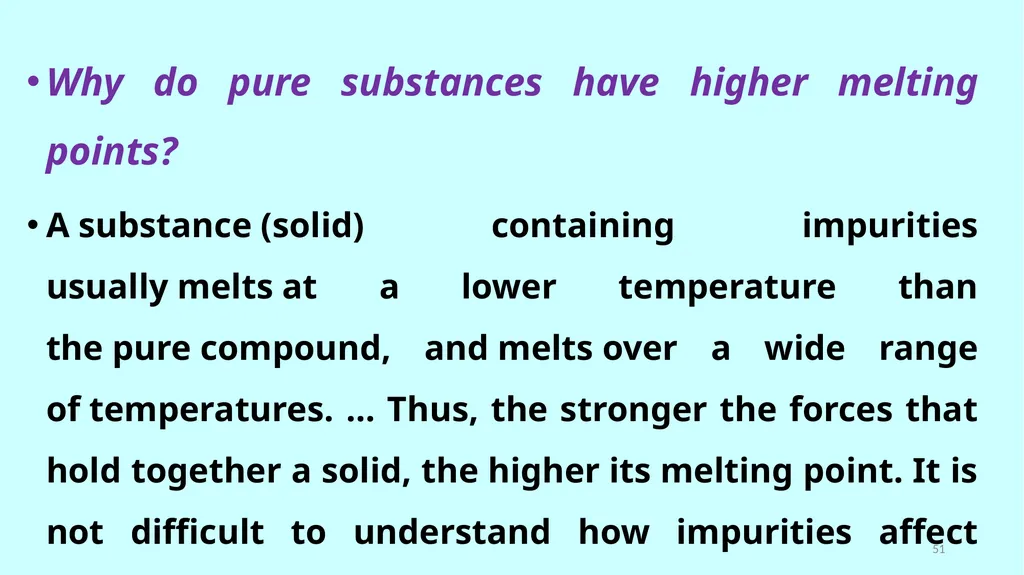
Why do pure substances have higher melting points?
A substance (solid) containing impurities usually melts at a lower temperature than the pure compound, and melts over a wide range of temperatures. ... Thus, the stronger the forces that hold together a solid, the higher its melting point. It is not difficult to understand how impurities affect the melting point. 51<br>
A substance (solid) containing impurities usually melts at a lower temperature than the pure compound, and melts over a wide range of temperatures. ... Thus, the stronger the forces that hold together a solid, the higher its melting point. It is not difficult to understand how impurities affect the melting point. 51<br>
52
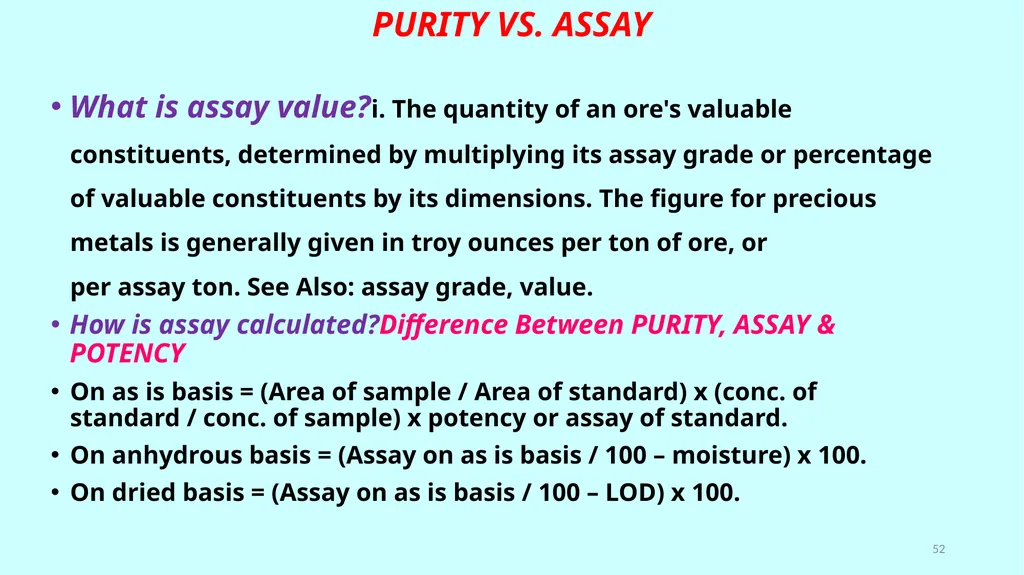
PURITY VS. ASSAY What is assay value?
i. The quantity of an ore's valuable constituents, determined by multiplying its assay grade or percentage of valuable constituents by its dimensions. The figure for precious metals is generally given in troy ounces per ton of ore, or per assay ton. See Also: assay grade, value.
How is assay calculated? Difference Between PURITY, ASSAY & POTENCY
On as is basis = (Area of sample / Area of standard) x (conc. of standard / conc. of sample) x potency or assay of standard.
On anhydrous basis = (Assay on as is basis / 100 – moisture) x 100.
On dried basis = (Assay on as is basis / 100 – LOD) x 100. 52<br>
53
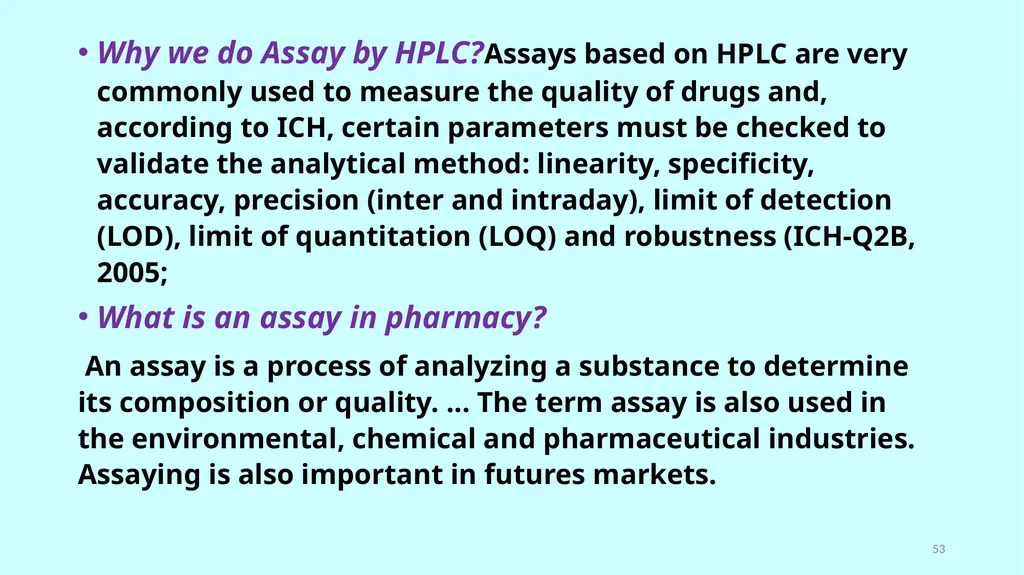
Why we do Assay by HPLC?
Assays based on HPLC are very commonly used to measure the quality of drugs and, according to ICH, certain parameters must be checked to validate the analytical method: linearity, specificity, accuracy, precision (inter and intraday), limit of detection (LOD), limit of quantitation (LOQ) and robustness (ICH-Q2B, 2005;
What is an assay in pharmacy?
An assay is a process of analyzing a substance to determine its composition or quality. ... The term assay is also used in the environmental, chemical and pharmaceutical industries. Assaying is also important in futures markets. 53<br>
What is an assay in pharmacy?
An assay is a process of analyzing a substance to determine its composition or quality. ... The term assay is also used in the environmental, chemical and pharmaceutical industries. Assaying is also important in futures markets. 53<br>
54
Where is purity manufactured?
Each product is manufactured in a U.S. cGMP (Good Manufacturing Practice Certified) facility. Manufacturing facilities are inspected by the Purity Products Quality Assurance Department. Every lot is laboratory tested against Purity established quality specifications.
How do you separate pure substances?
The prime difference lies in the fact that pure substances cannot be physically separated while mixtures can be. The separation of a mixture into its different parts is done by using physical techniques like distillation, filtering and particle separation. 54<br>
55
TEXTBOOKS Adekeye K.S. (2009). An Introduction to Industrial Statistics (Concepts and Practice)
Grant, E.L. and Leavenworth, R.S. (1980). Statistical Quality Control, Mc Graw-Hill, New York.
John, J.A., Whitaker, D. and Johnson, D.G. (2006). Statistical Process Control. Statistical thinking in business. 2nd ed., Chapman & Hall.
Merton R.H (2003) Statistical Quality Control for the Food Industry, 3rd Edition. New York
Montgomery, D.C., 2005. Introduction to Statistical Quality Control, John Wiley and Sons
Oakland, J (2002) Statistical Process Control. Sixth Edition, Jordan Hill, Oxford.
Stapenhurst T (2005) Mastering Statistical Process Control, Jordan Hill, Oxford 55<br>
56
REFERENCES 1. http://www.drugregulations.org - Visiting this site for latest information from the world of Pharmaceuticals, including Statistical Quality Control For Beginners.
2. Adekeye, K.S. (2009). An Introduction to Industrial Statistics: Concepts and Practice (Revised Ed.), Ilorin, Nigeria
3. Bank, J. (1989). Principle of Quality Control.John Wiley and Sons, NY
4. Caulutt, R. (1987). Statistics in Industry a Failure of Communication. The Statistician, 36, pp. 555 – 560
5. Cowden, D. J. (1957). Statistical Methods in Quality Control. Prentice – Hall, Englewood Cliffs, New Jersey.
6. Jerry, B. (1989). Principles of Quality Control. John Wiley& Sons, NY 56<br>
57
7. John S. O. (2003). Statistical Process Control (5th Edition). Butterworth-Heinemann Oxford
8. Juran, J.M. (ed.) (1988). Quality Control Handbook. McGraw-Hill, NY
9. Juran, J.M. (ed.) (1999). Quality Handbook (5th Ed.), McGraw-Hill, New York, USA.
10. Montgomery, D.C.(2005). Introduction to Statistical Quality Control, John Wiley & Sons, NY
11. Oakland, J.S. (2000) .Total Quality Management, Text and Cases, 2nd Edn, Butterworth-Heinemann, Oxford, UK.
12. Wheeler, D.J., & Chambers, D.S. (1992). Understanding Statistical Process Control (2nd Ed.). Knoxville, TN: SPC Press. 57<br>
58
المحاضرة القادمة تكملة لمحاضرة اليوم ان شاء الله وتشمل: Stay up to date on results for statistical quality control in pharmaceutical industry ppt.:
Calculations of the Mean, Standard Error of the Mean (SEM)
About the 7 Basic Quality Tools
SPC Techniques Steps
Definition of the Techniques used in QC.
OTHERS. 58<br>
Calculations of the Mean, Standard Error of the Mean (SEM)
About the 7 Basic Quality Tools
SPC Techniques Steps
Definition of the Techniques used in QC.
OTHERS. 58<br>
59
59<br>