
Supply and Demand Chapter 4 © Dünhaupt, Dullien,
AM
Published · 35 slides · 0 views

1 / 1





Description
Supply and Demand Chapter 4 Dünhaupt, Dullien, Goodwin, Harris, Nelson, Roach, Torras Chapter Outline Market and Macroeconomics The Theory of Supply The Theory of Demand The Theory of Market Adjustment Macroeconomics and the Dynamics of
Related Topics
Share
Embed code
Download this presentation From Below
"Supply and Demand Chapter 4 © Dünhaupt, Dullien," is the property of its rightful owner. Permission is granted to download and print the materials on this website for personal, non-commercial use only, and to display it on your personal computer provided you do not modify the materials and that you retain all copyright notices contained in the materials. By downloading content from our website, you accept the terms of this agreement.
Presentation Transcript
01
Supply and Demand Chapter 4 © Dünhaupt, Dullien, Goodwin, Harris, Nelson, Roach, Torras<br>
02
Chapter Outline Market and Macroeconomics
The Theory of Supply
The Theory of Demand
The Theory of Market Adjustment
Macroeconomics and the Dynamics of Real-World Markets Chapter 4 2<br>
The Theory of Supply
The Theory of Demand
The Theory of Market Adjustment
Macroeconomics and the Dynamics of Real-World Markets Chapter 4 2<br>
03
Learning goals After today’s lecture, you will be able to:
Describe the concept of the supply curve.
Explain the difference between “change in quantity supplied” and “change in supply.”
Describe the concept of the demand curve.
Explain the difference between “change in quantity demanded” and “change in demand.”
Explain the difference between a “substitute good” and a “complementary good.”
Demonstrate an understanding of surplus, shortage, and equilibrium situations using the supply and demand graphical model.
Demonstrate an understanding of the difference between movement along a curve versus a shift in a curve using supply and demand analysis.
Describe the concept of price elasticity.
Describe the concept of a speculative bubble. Chapter 4 3<br>
Describe the concept of the supply curve.
Explain the difference between “change in quantity supplied” and “change in supply.”
Describe the concept of the demand curve.
Explain the difference between “change in quantity demanded” and “change in demand.”
Explain the difference between a “substitute good” and a “complementary good.”
Demonstrate an understanding of surplus, shortage, and equilibrium situations using the supply and demand graphical model.
Demonstrate an understanding of the difference between movement along a curve versus a shift in a curve using supply and demand analysis.
Describe the concept of price elasticity.
Describe the concept of a speculative bubble. Chapter 4 3<br>
04
Markets and Macroeconomics<br>
05
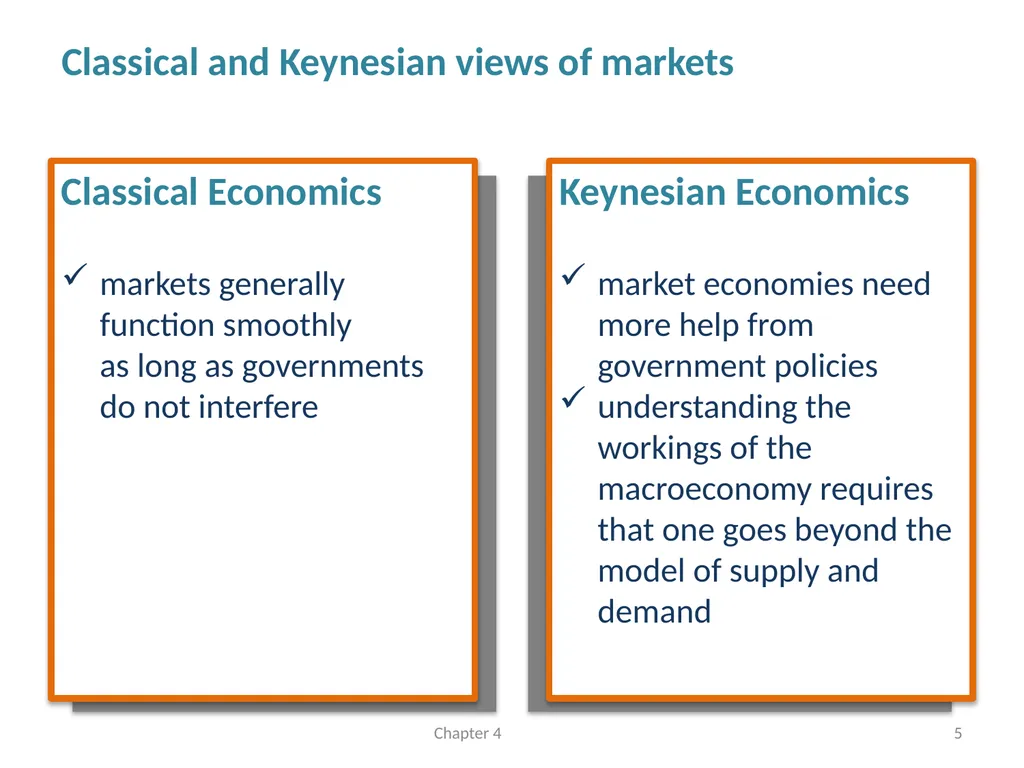
Classical and Keynesian views of markets Chapter 4 5 Classical Economics
markets generally function smoothly at least as long as governments do not interfere Keynesian Economics
market economies need more help from government policies
understanding the workings of the macroeconomy requires that one goes beyond the model of supply and demand<br>
markets generally function smoothly at least as long as governments do not interfere Keynesian Economics
market economies need more help from government policies
understanding the workings of the macroeconomy requires that one goes beyond the model of supply and demand<br>
06
Market competitiveness The market in the classical world:
perfectly competitive:
many buyers and sellers
all units of the good are identical
free entry and exit
perfect information
self-correcting market:
automatically adjusts to any imbalances between sellers (supply) and buyers (demand) Chapter 4 6<br>
perfectly competitive:
many buyers and sellers
all units of the good are identical
free entry and exit
perfect information
self-correcting market:
automatically adjusts to any imbalances between sellers (supply) and buyers (demand) Chapter 4 6<br>
07
The Theory of Supply<br>
08
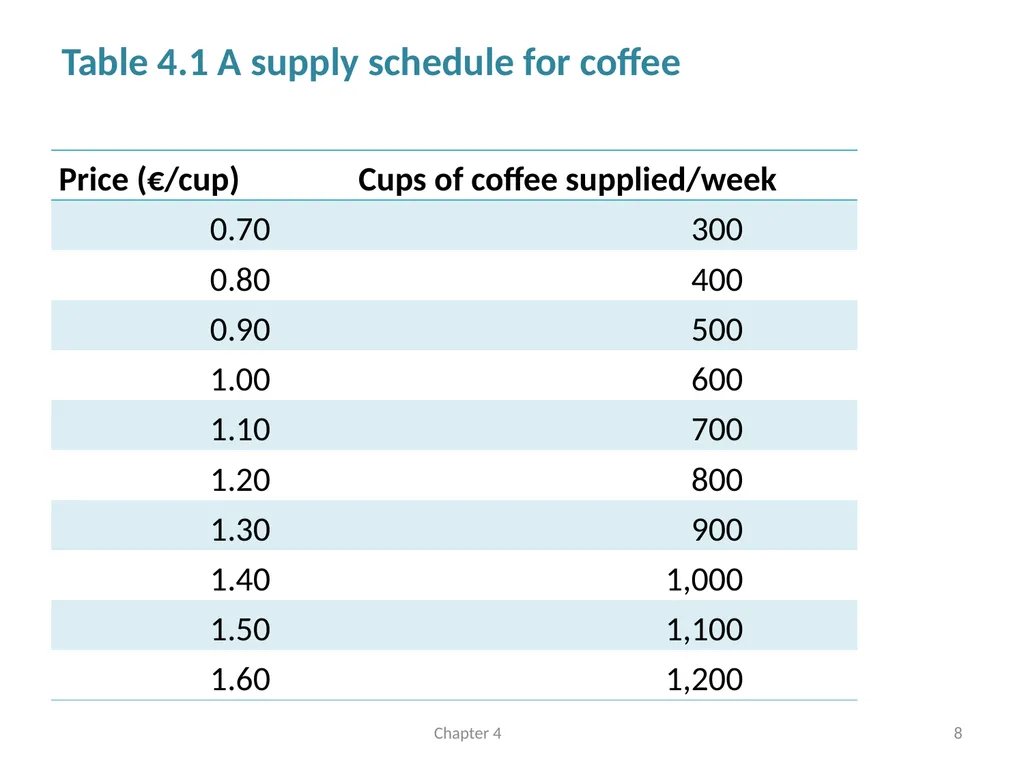
Table 4.1 A supply schedule for coffee Chapter 4 8<br>
09
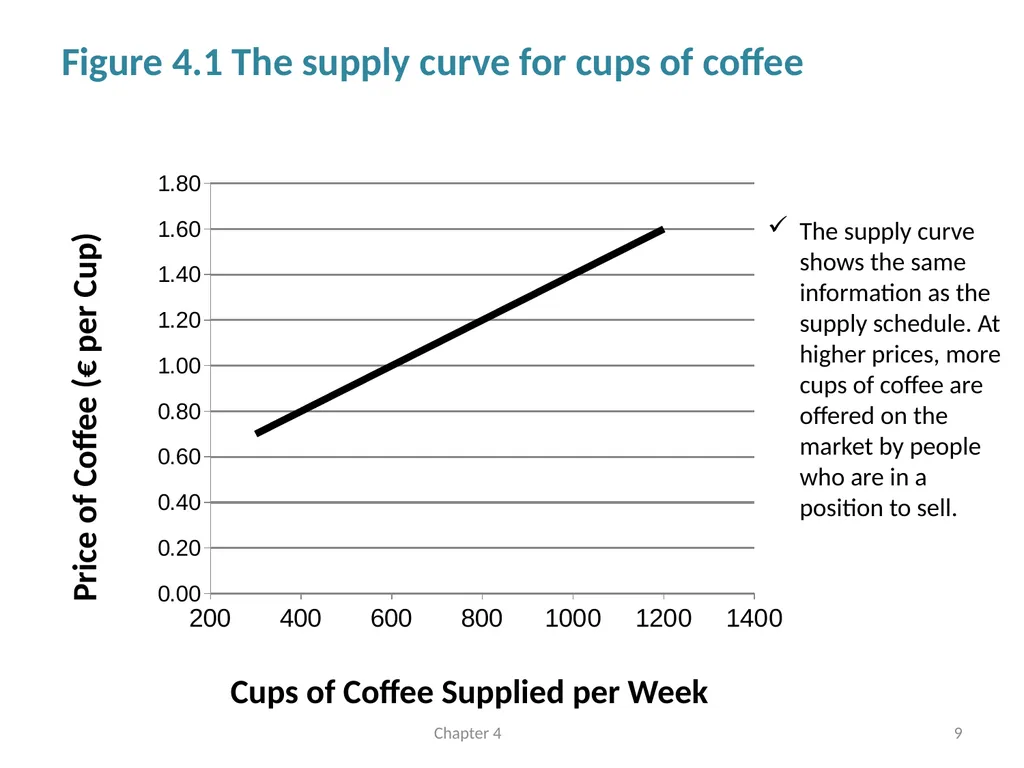
Figure 4.1 The supply curve for cups of coffee Chapter 4 9 The supply curve shows the same information as the supply schedule. At higher prices, more cups of coffee are offered on the market by people who are in a position to sell. Price of Coffee (€ per Cup) Cups of Coffee Supplied per Week<br>
10
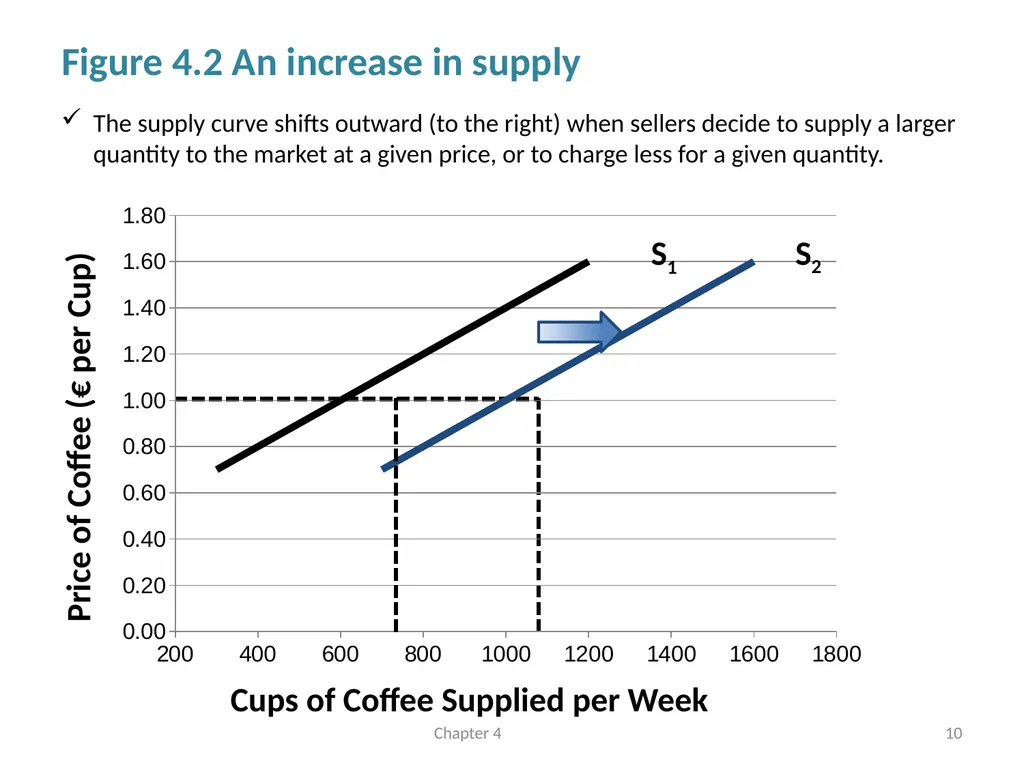
Figure 4.2 An increase in supply Chapter 4 10 The supply curve shifts outward (to the right) when sellers decide to supply a larger quantity to the market at a given price, or to charge less for a given quantity. S1 S2 Price of Coffee (€ per Cup) Cups of Coffee Supplied per Week<br>
11
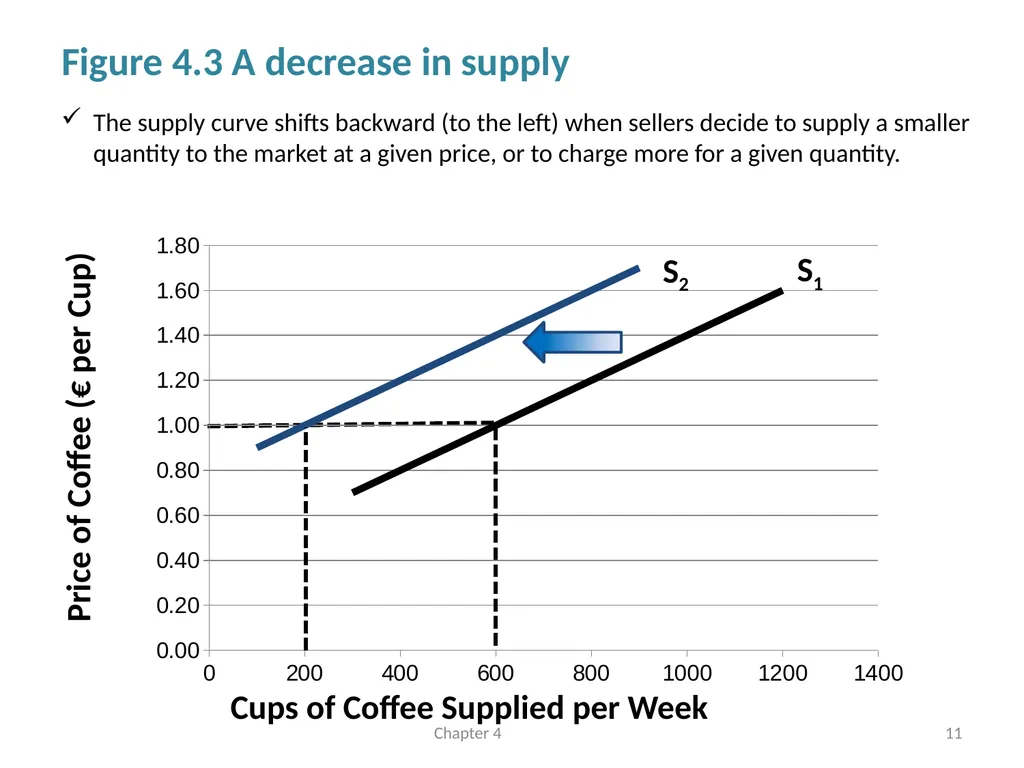
Figure 4.3 A decrease in supply Chapter 4 11 The supply curve shifts backward (to the left) when sellers decide to supply a smaller quantity to the market at a given price, or to charge more for a given quantity. S1 S2 Price of Coffee (€ per Cup) Cups of Coffee Supplied per Week<br>
12
The Theory of Demand<br>
13
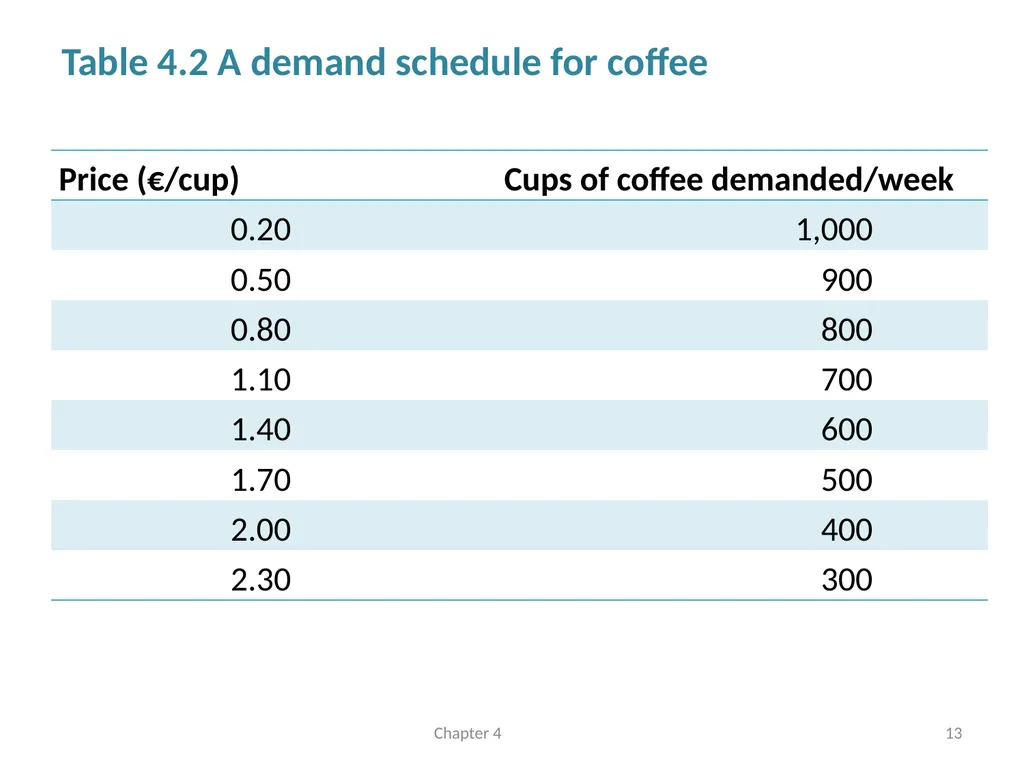
Table 4.2 A demand schedule for coffee Chapter 4 13<br>
14
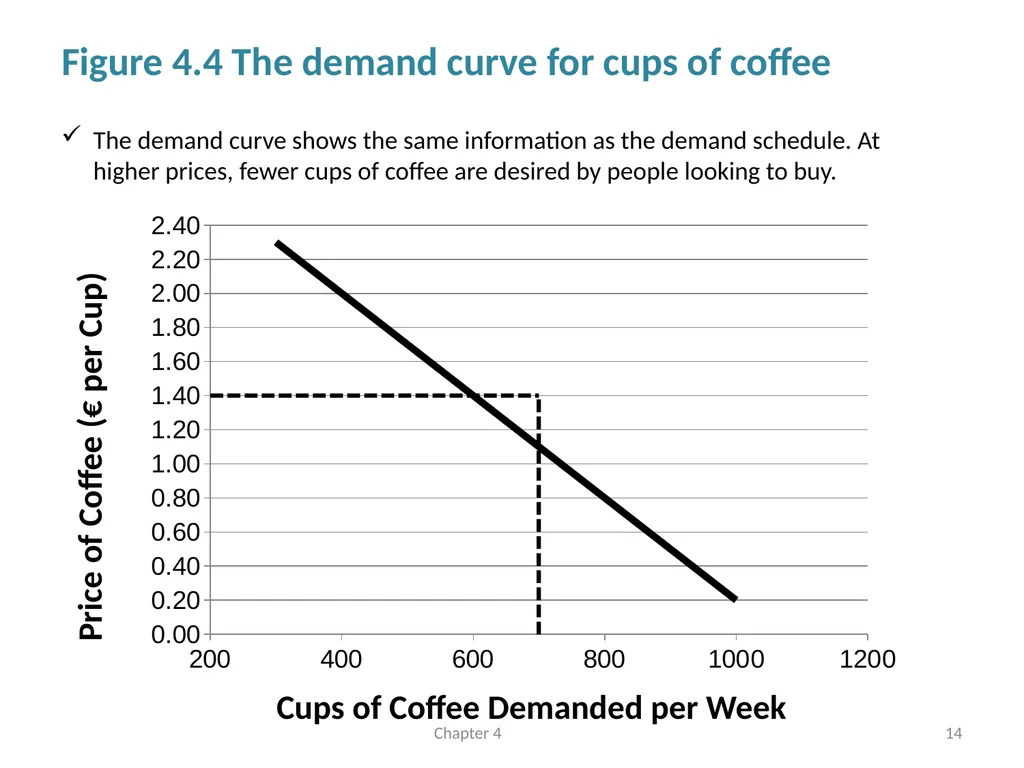
Figure 4.4 The demand curve for cups of coffee Chapter 4 14 The demand curve shows the same information as the demand schedule. At higher prices, fewer cups of coffee are desired by people looking to buy. Price of Coffee (€ per Cup) Cups of Coffee Demanded per Week<br>
15
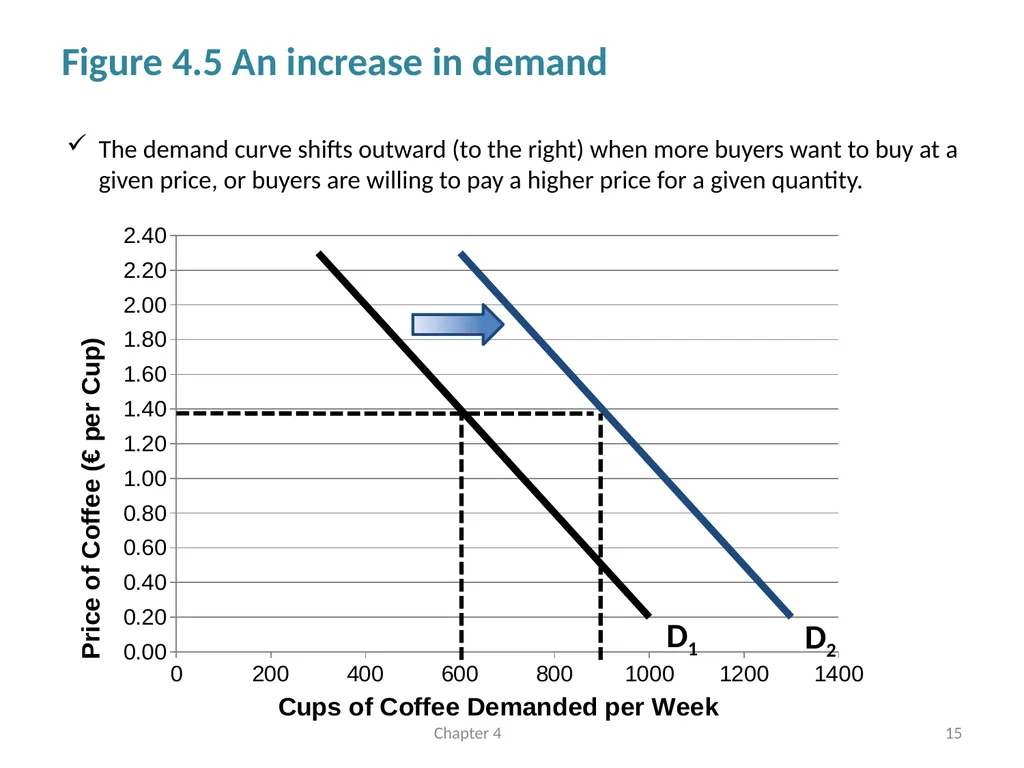
Figure 4.5 An increase in demand Chapter 4 15 The demand curve shifts outward (to the right) when more buyers want to buy at a given price, or buyers are willing to pay a higher price for a given quantity.<br>
16
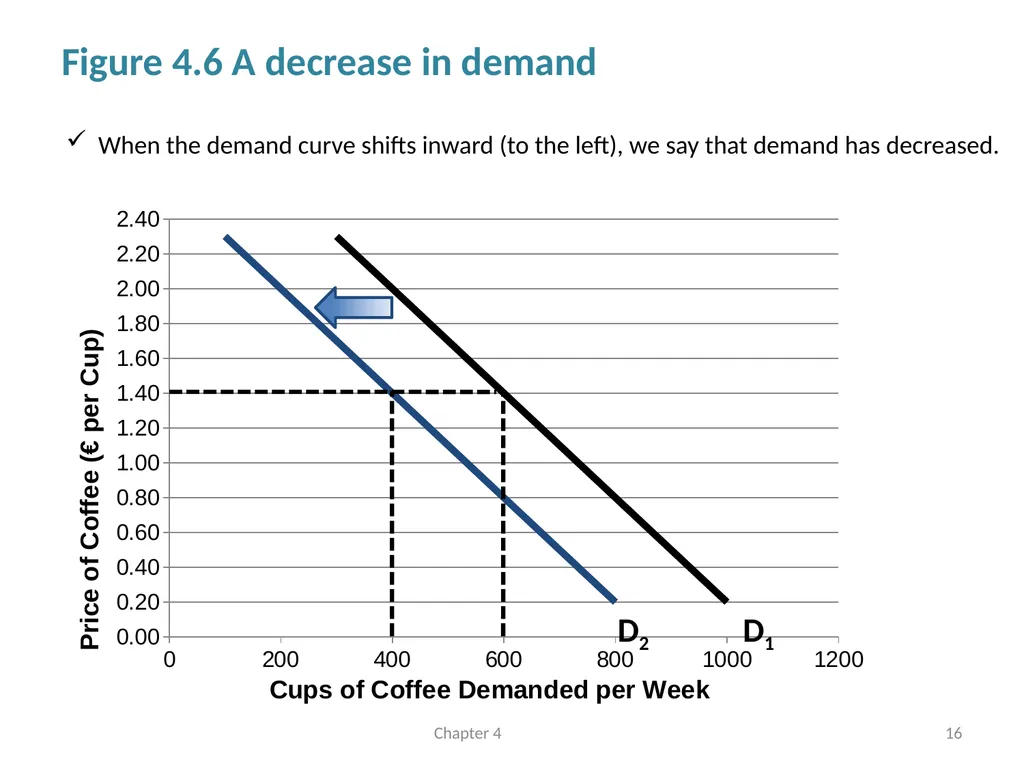
Figure 4.6 A decrease in demand Chapter 4 16 When the demand curve shifts inward (to the left), we say that demand has decreased.<br>
17
The Theory of Market Adjustment<br>
18
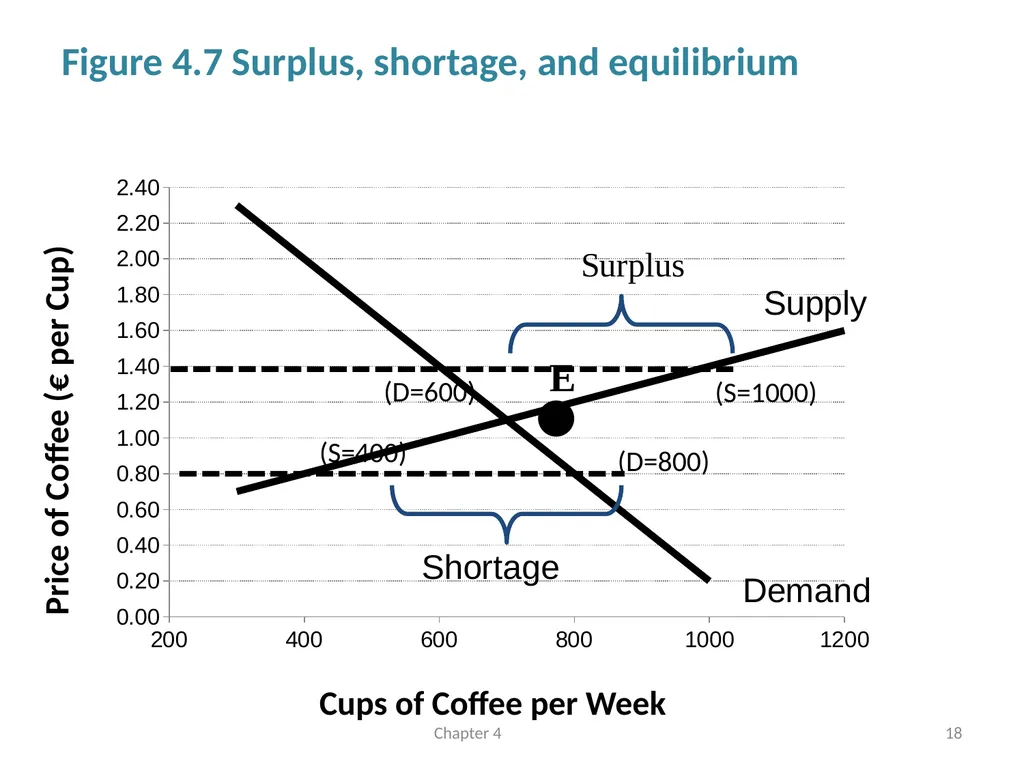
Figure 4.7 Surplus, shortage, and equilibrium Chapter 4 18 (D=600) (S=1000) (S=400) (D=800) • Cups of Coffee per Week Price of Coffee (€ per Cup)<br>
19
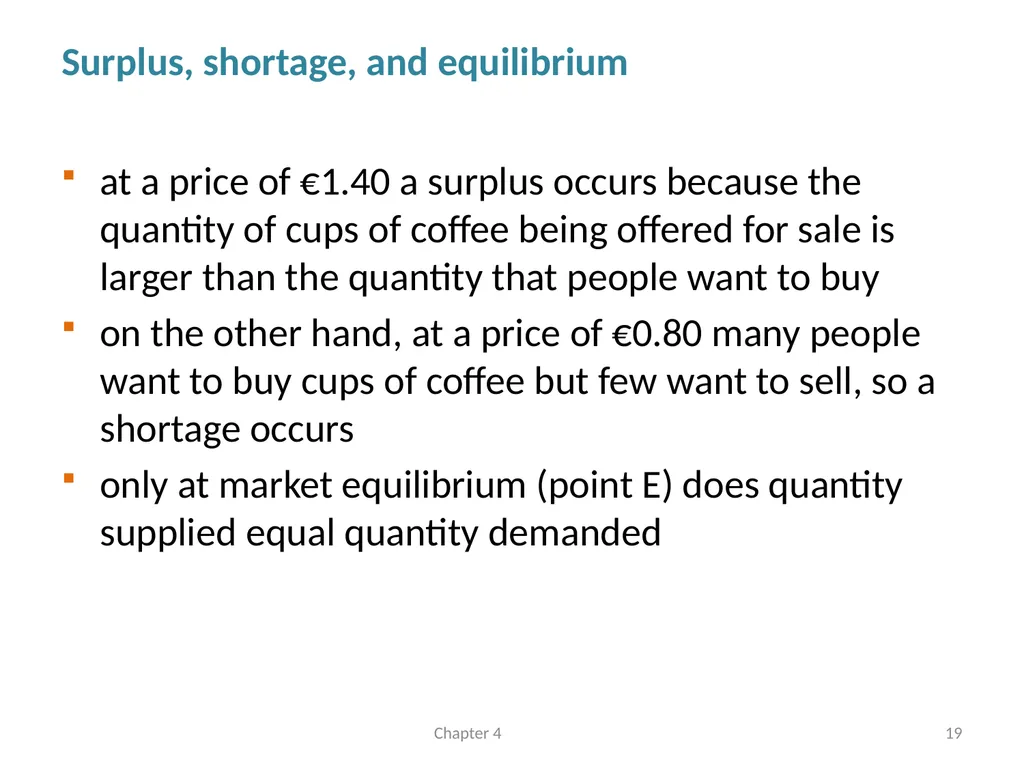
Surplus, shortage, and equilibrium Chapter 4 19 at a price of €1.40 a surplus occurs because the quantity of cups of coffee being offered for sale is larger than the quantity that people want to buy
on the other hand, at a price of €0.80 many people want to buy cups of coffee but few want to sell, so a shortage occurs
only at market equilibrium (point E) does quantity supplied equal quantity demanded<br>
on the other hand, at a price of €0.80 many people want to buy cups of coffee but few want to sell, so a shortage occurs
only at market equilibrium (point E) does quantity supplied equal quantity demanded<br>
20
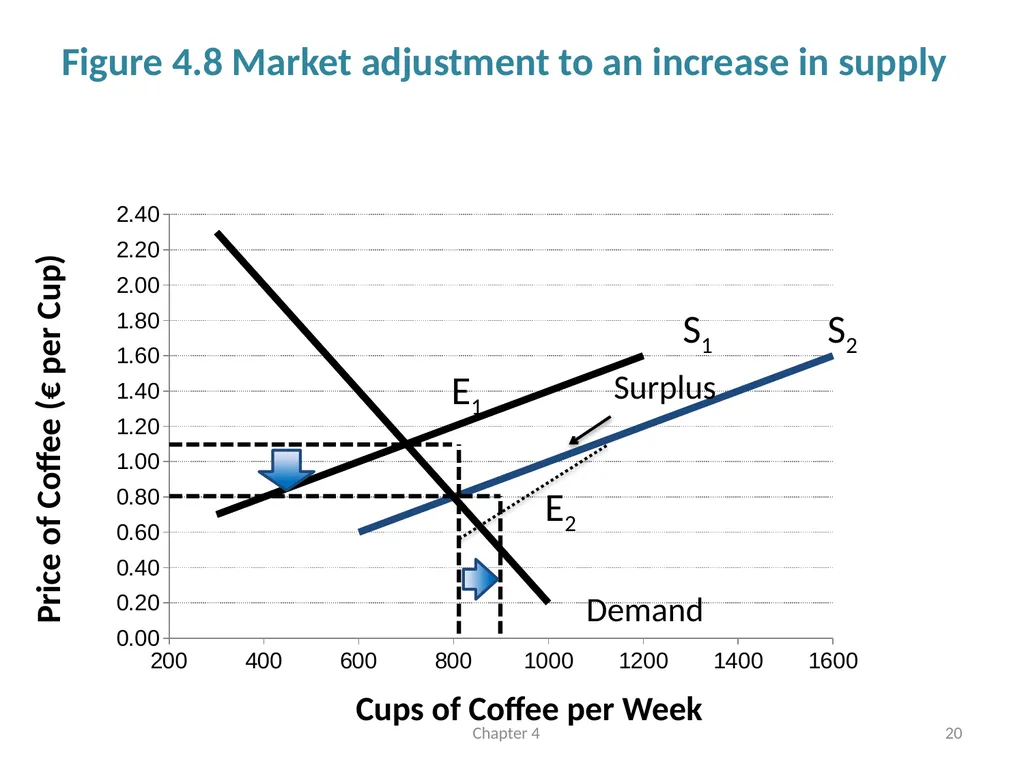
Figure 4.8 Market adjustment to an increase in supply Chapter 4 20 Cups of Coffee per Week Price of Coffee (€ per Cup)<br>
21
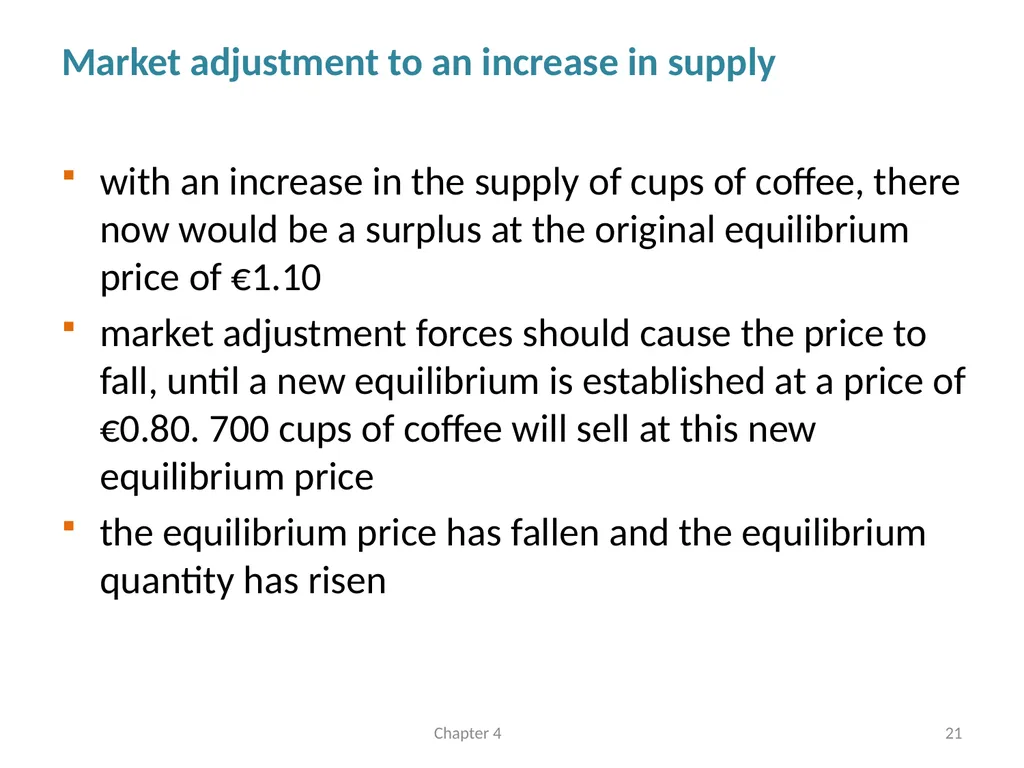
Market adjustment to an increase in supply Chapter 4 21 with an increase in the supply of cups of coffee, there now would be a surplus at the original equilibrium price of €1.10
market adjustment forces should cause the price to fall, until a new equilibrium is established at a price of €0.80. 700 cups of coffee will sell at this new equilibrium price
the equilibrium price has fallen and the equilibrium quantity has risen<br>
market adjustment forces should cause the price to fall, until a new equilibrium is established at a price of €0.80. 700 cups of coffee will sell at this new equilibrium price
the equilibrium price has fallen and the equilibrium quantity has risen<br>
22
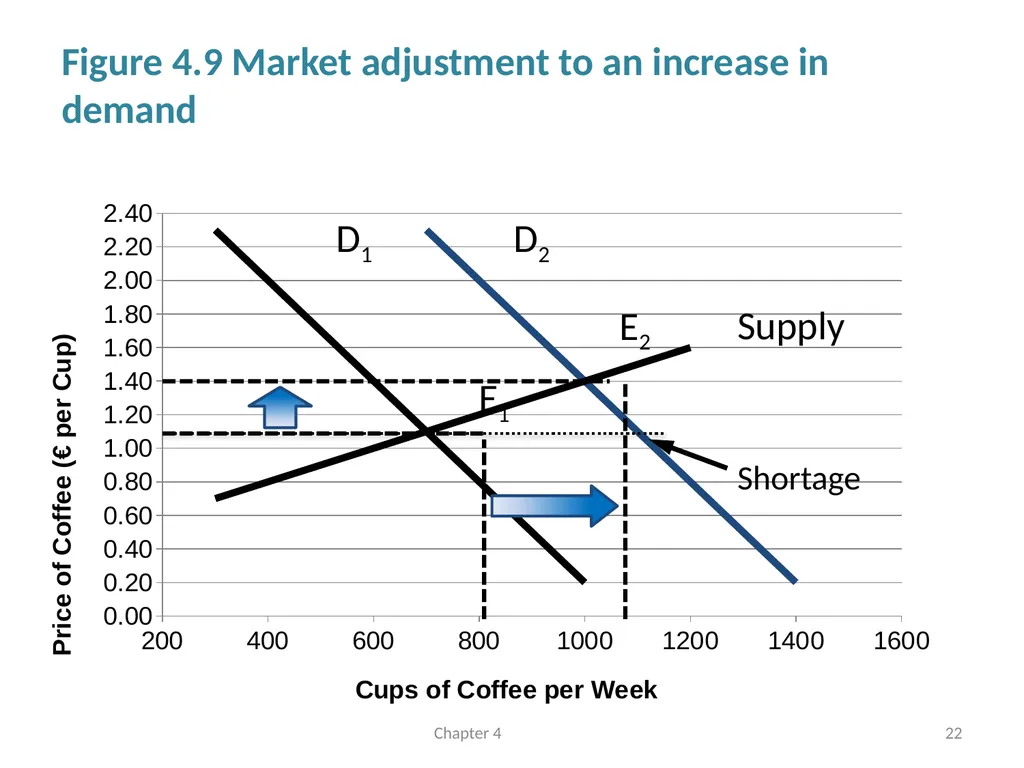
Figure 4.9 Market adjustment to an increase in demand Chapter 4 22<br>
23
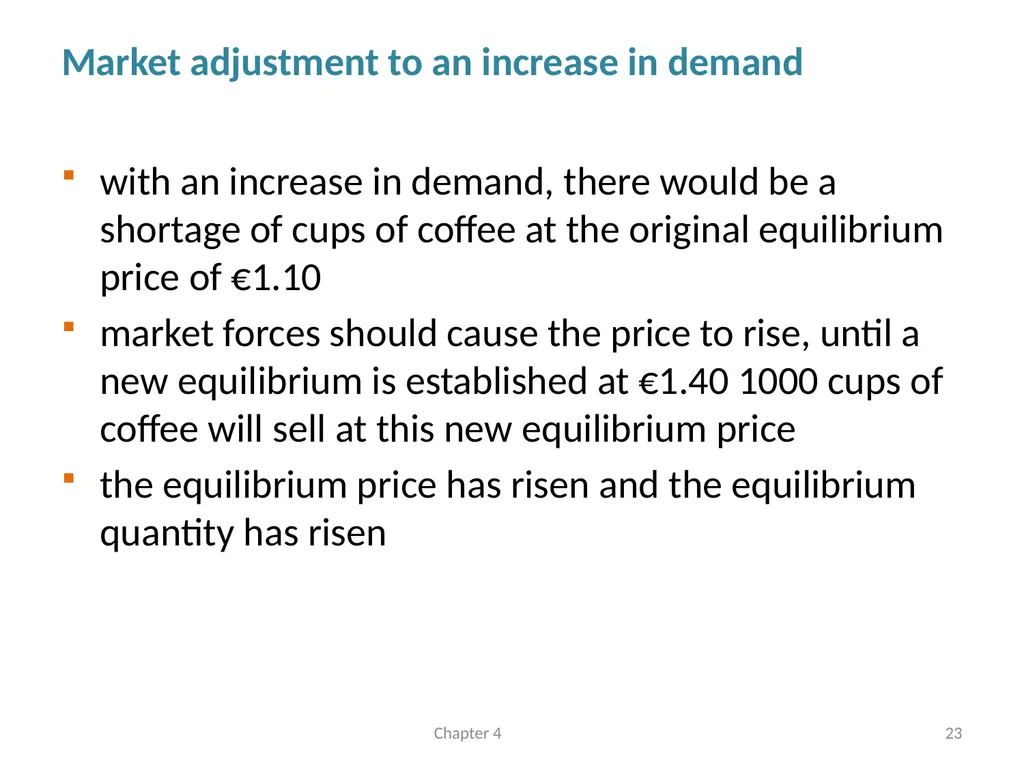
Market adjustment to an increase in demand with an increase in demand, there would be a shortage of cups of coffee at the original equilibrium price of €1.10
market forces should cause the price to rise, until a new equilibrium is established at €1.40 1000 cups of coffee will sell at this new equilibrium price
the equilibrium price has risen and the equilibrium quantity has risen Chapter 4 23<br>
market forces should cause the price to rise, until a new equilibrium is established at €1.40 1000 cups of coffee will sell at this new equilibrium price
the equilibrium price has risen and the equilibrium quantity has risen Chapter 4 23<br>
24
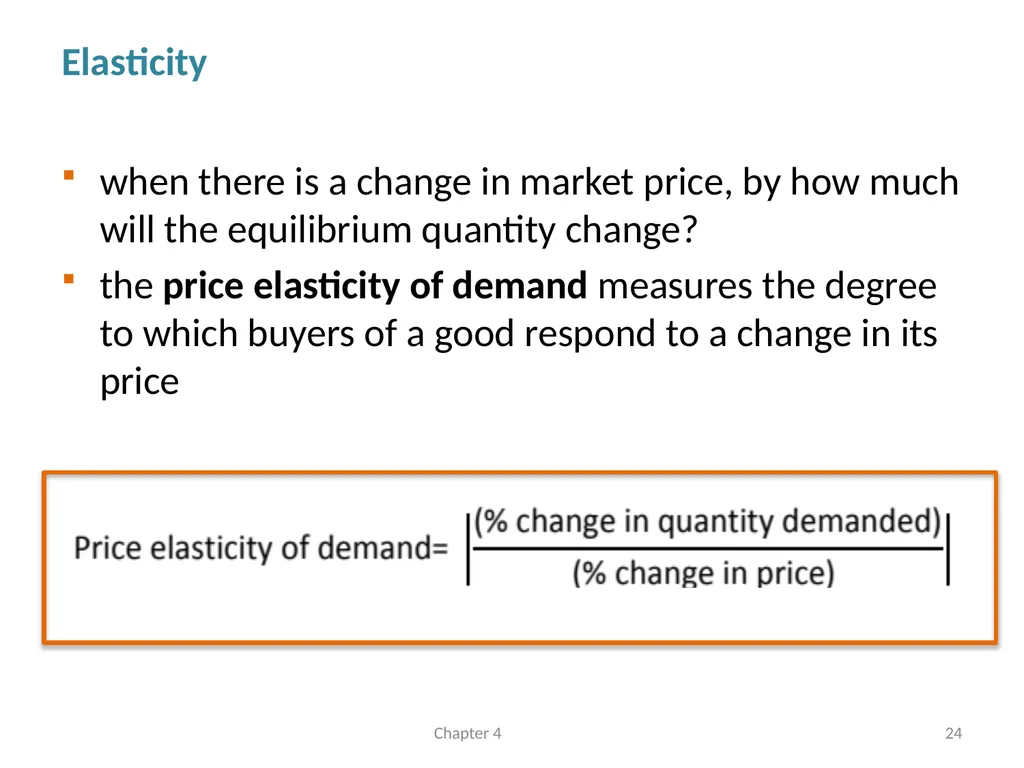
Elasticity when there is a change in market price, by how much will the equilibrium quantity change?
the price elasticity of demand measures the degree to which buyers of a good respond to a change in its price Chapter 4 24<br>
the price elasticity of demand measures the degree to which buyers of a good respond to a change in its price Chapter 4 24<br>
25
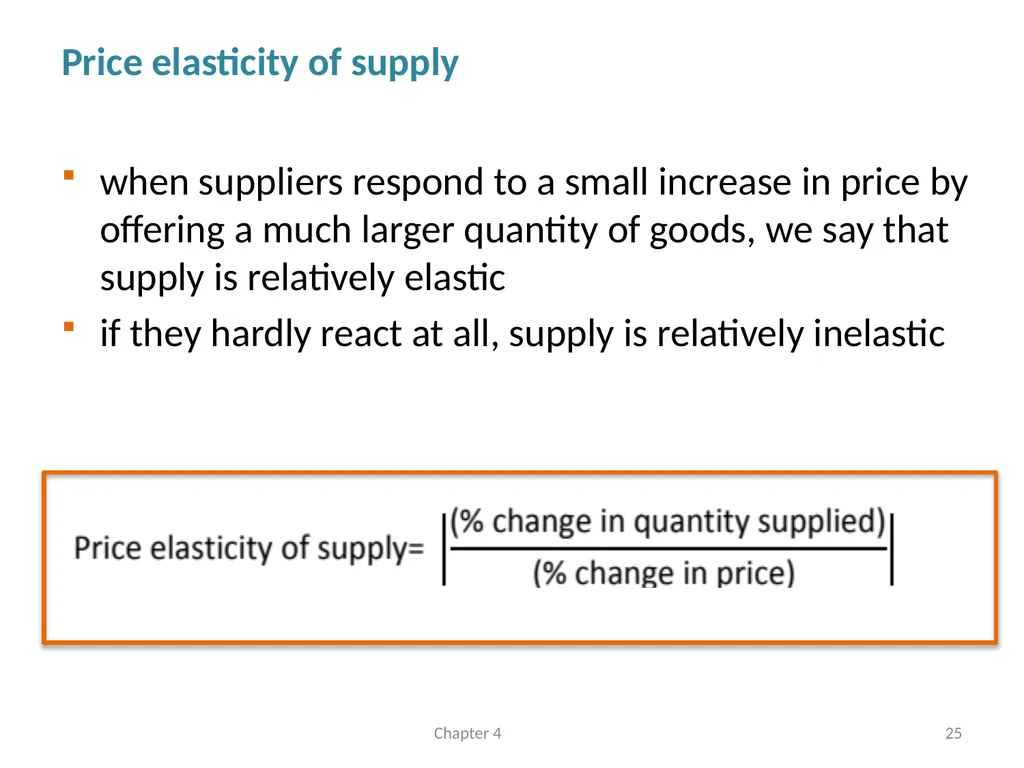
Price elasticity of supply when suppliers respond to a small increase in price by offering a much larger quantity of goods, we say that supply is relatively elastic
if they hardly react at all, supply is relatively inelastic Chapter 4 25<br>
if they hardly react at all, supply is relatively inelastic Chapter 4 25<br>
26
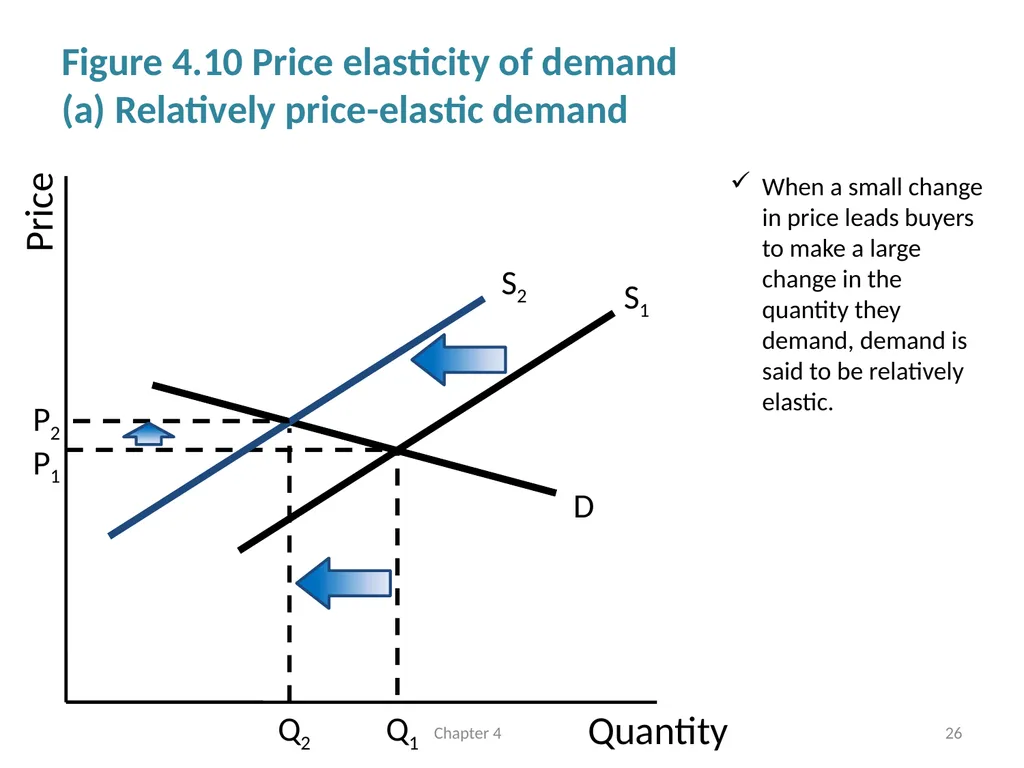
Figure 4.10 Price elasticity of demand
(a) Relatively price-elastic demand Chapter 4 26 When a small change in price leads buyers to make a large change in the quantity they demand, demand is said to be relatively elastic.<br>
27
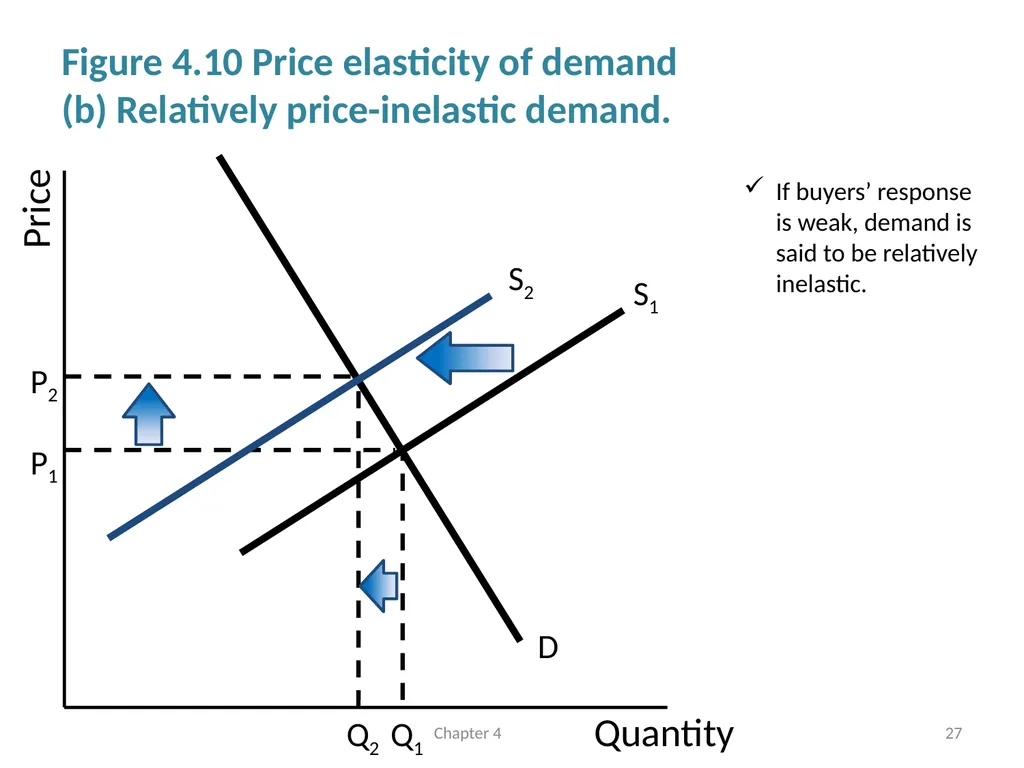
Figure 4.10 Price elasticity of demand
(b) Relatively price-inelastic demand. Chapter 4 27 If buyers’ response is weak, demand is said to be relatively inelastic.<br>
28
Macroeconomics and the Dynamics of Real-World-Markets<br>
29
The dynamics of real-world-markets few if any markets truly approach perfect competition
markets are characterized by market power
there are different brands and types of product with different characteristics
buyers and sellers may have imperfect information, or be bound by long-term contracts
the role of assumptions and expectations can be significant Chapter 4 29<br>
markets are characterized by market power
there are different brands and types of product with different characteristics
buyers and sellers may have imperfect information, or be bound by long-term contracts
the role of assumptions and expectations can be significant Chapter 4 29<br>
30
How long will it take our hypothetical coffee traders to reach equilibrium? Minutes?
An hour?
A day?
the theory of supply and demand does not tell us Chapter 4 30<br>
An hour?
A day?
the theory of supply and demand does not tell us Chapter 4 30<br>
31
When price adjustments are slow quantity adjustments: a response by suppliers in which they react to unexpectedly low sales of their good primarily by reducing production levels rather than by reducing the price and to unexpectedly high sales by increasing production rather than raising the price
menu costs: the costs to a supplier of changing prices listed on order forms, brochures, menus, and the like Chapter 4 31<br>
menu costs: the costs to a supplier of changing prices listed on order forms, brochures, menus, and the like Chapter 4 31<br>
32
When prices swing too much: market instability very rapid adjustments of prices create problems
there are markets in which buyers are not really interested in the item itself at all—only in its price and the direction in which it is likely to go.
speculation is the buying and selling of assets with the expectation of profiting from appreciation or depreciation in their values, usually over a relatively short period of time
speculative bubble: the situation that occurs when mutually reinforcing investor optimism raises the value of an asset far above what can be justified by fundamental value Chapter 4 32<br>
there are markets in which buyers are not really interested in the item itself at all—only in its price and the direction in which it is likely to go.
speculation is the buying and selling of assets with the expectation of profiting from appreciation or depreciation in their values, usually over a relatively short period of time
speculative bubble: the situation that occurs when mutually reinforcing investor optimism raises the value of an asset far above what can be justified by fundamental value Chapter 4 32<br>
33
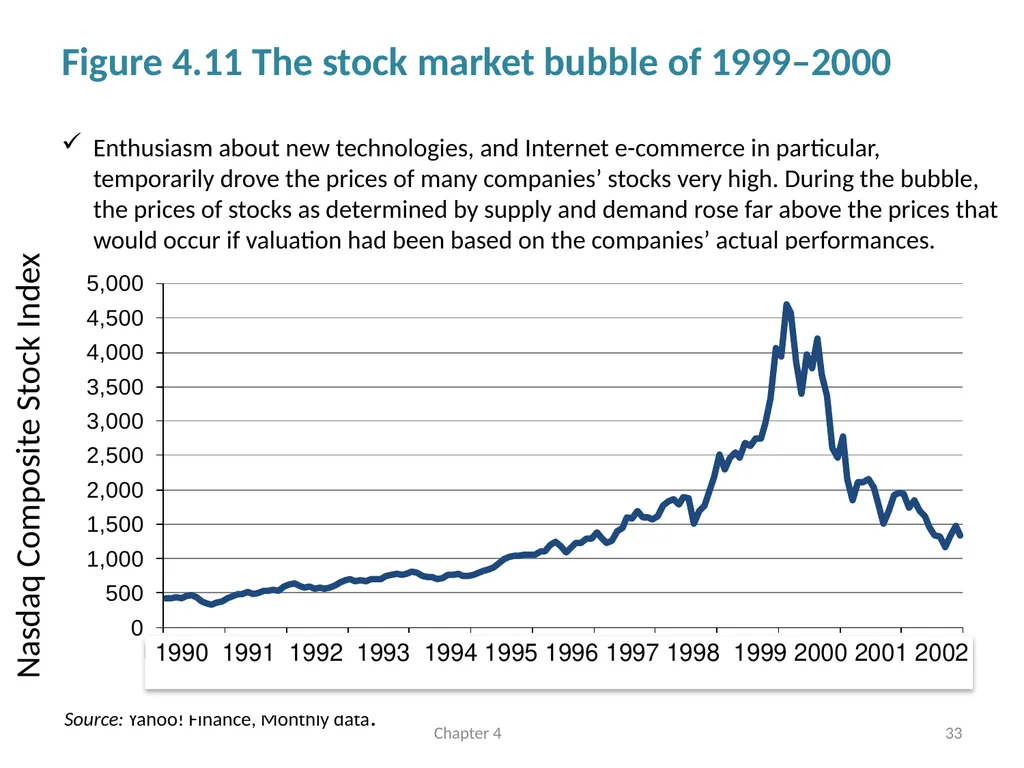
Figure 4.11 The stock market bubble of 1999–2000 Chapter 4 33 Enthusiasm about new technologies, and Internet e-commerce in particular, temporarily drove the prices of many companies’ stocks very high. During the bubble, the prices of stocks as determined by supply and demand rose far above the prices that would occur if valuation had been based on the companies’ actual performances. Source: Yahoo! Finance, Monthly data. Nasdaq Composite Stock Index 1991 1992 1993 1994 1995 1996 1997 1998 1999 2000 2001 2002<br>
34
From microeconomics to macroeconomics how far does the model of supply and demand get us in explaining macroeconomic phenomena?
are markets in the real world similar to the one portrayed in the model?
even to the extent that individual markets do behave as the model predicts, might explaining national-level economic phenomena require different theoretical tools? In other words,
does it follow that what works for a market necessarily works for entire economies? Chapter 4 34<br>
are markets in the real world similar to the one portrayed in the model?
even to the extent that individual markets do behave as the model predicts, might explaining national-level economic phenomena require different theoretical tools? In other words,
does it follow that what works for a market necessarily works for entire economies? Chapter 4 34<br>
35
What to take home Classical and Keynesian economists have opposing views on how markets function
the market in the classical view is perfectly competitive and self-correcting
the price elasticity of demand measures the degree to which buyers of a good respond to a change in its price
price adjustments can be slow
speculation can create problems Chapter 4 35<br>
the market in the classical view is perfectly competitive and self-correcting
the price elasticity of demand measures the degree to which buyers of a good respond to a change in its price
price adjustments can be slow
speculation can create problems Chapter 4 35<br>