
. The Balanced Scorecard and MIS— Strategy
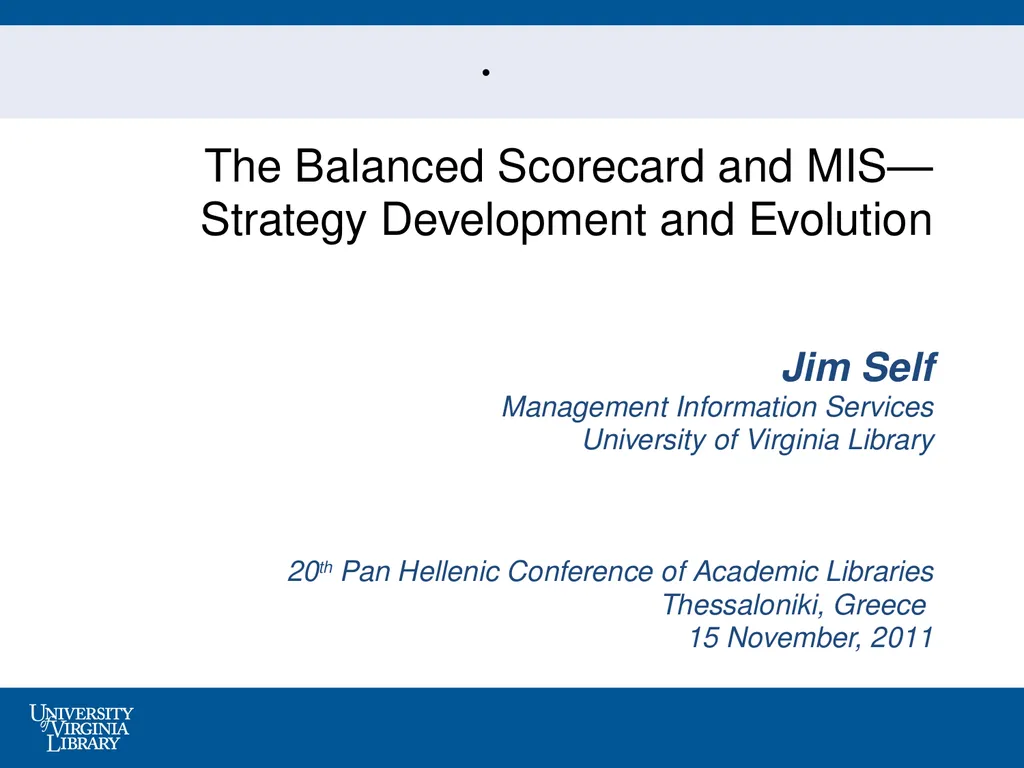






Description: . The Balanced Scorecard and MIS Strategy Development and Evolution Jim Self Management Information Services University of Virginia Library 20th Pan Hellenic Conference of Academic Libraries Thessaloniki, Greece 15 November, 2011 The
Related Topics
Download Presentation
". The Balanced Scorecard and MIS— Strategy" is the property of its rightful owner. Permission is granted to download and print the materials on this website for personal, non-commercial use only, and to display it on your personal computer provided you do not modify the materials and that you retain all copyright notices contained in the materials. By downloading content from our website, you accept the terms of this agreement.
Presentation Transcript
slide1. . The Balanced Scorecard and MIS—
Strategy Development and Evolution
Jim Self
Management Information Services
University of Virginia Library
20th Pan Hellenic Conference of Academic Libraries
Thessaloniki, Greece
15 November, 2011<br>
slide2. The University of Virginia 15,000 undergraduates
67% in-state, 33% out
Most notable for liberal arts
Highly ranked by U.S. News
6,000 graduate students
Prominent for humanities, law, business
Plans expansion in sciences
Located in Charlottesville
Metro population of 160,000<br>
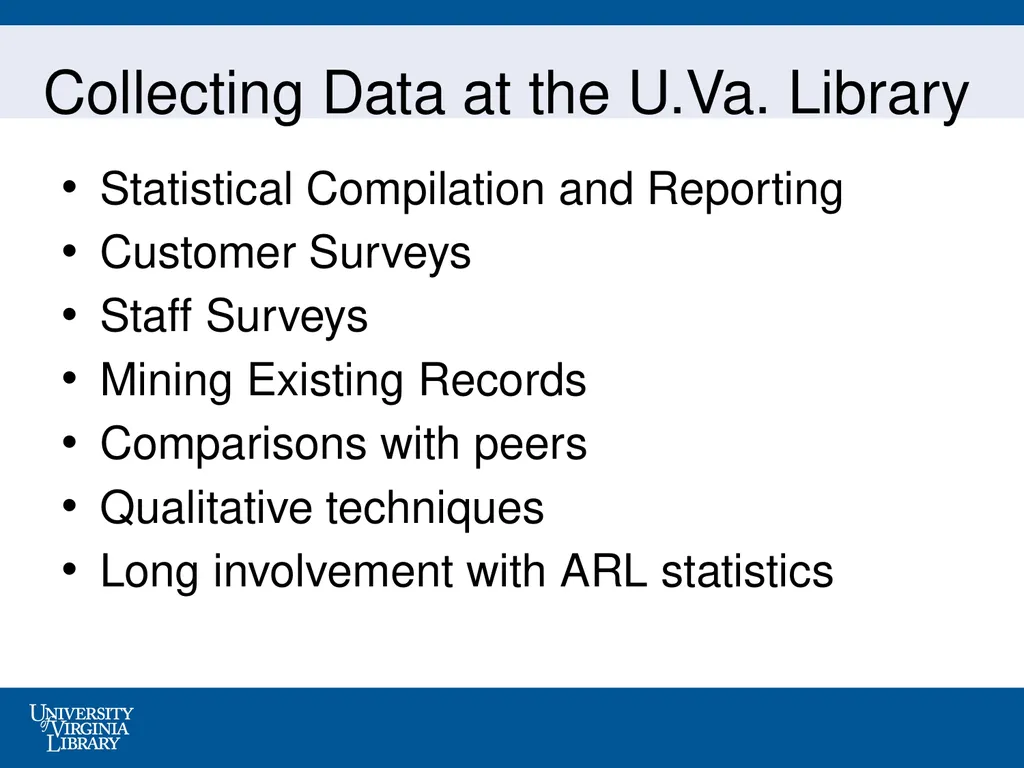
slide3. Collecting Data at the U.Va. Library Statistical Compilation and Reporting
Customer Surveys
Staff Surveys
Mining Existing Records
Comparisons with peers
Qualitative techniques
Long involvement with ARL statistics<br>
slide4. Management Information Services MIS committee formed in 1992
Evolved into a department 1996-2000
Currently three staff
Coordinates collection of statistics
Publishes annual statistical report
Coordinates assessment
Resource for management and staff<br>
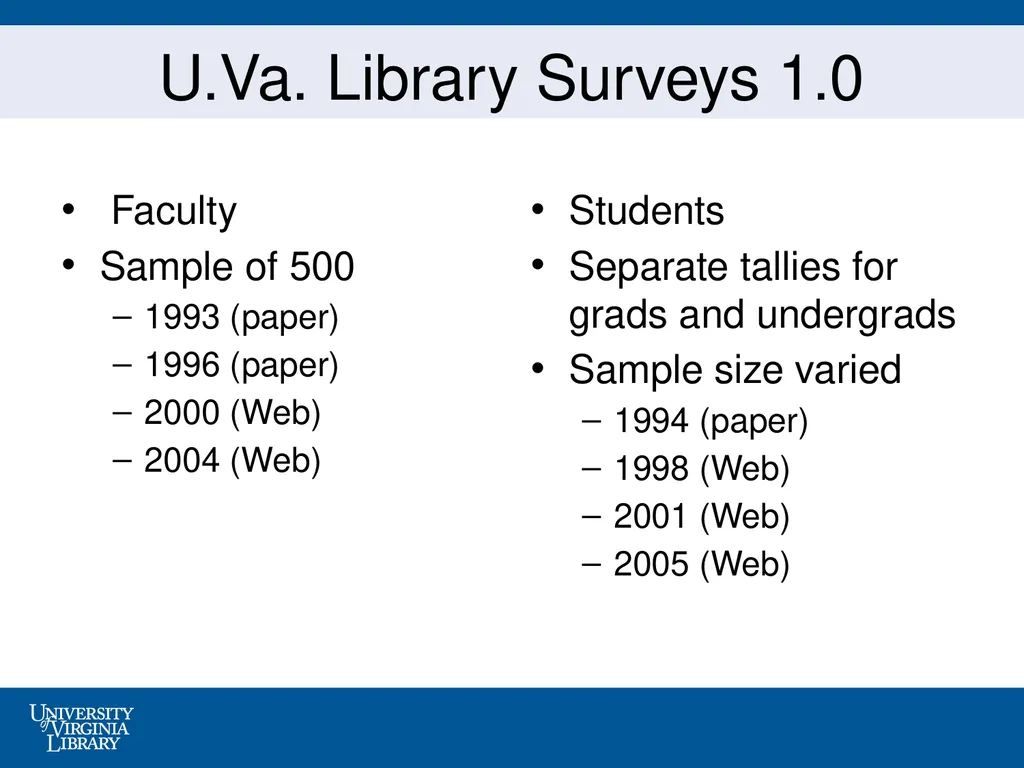
slide5. U.Va. Library Surveys 1.0 Faculty
Sample of 500
1993 (paper)
1996 (paper)
2000 (Web)
2004 (Web) Students
Separate tallies for grads and undergrads
Sample size varied
1994 (paper)
1998 (Web)
2001 (Web)
2005 (Web)<br>
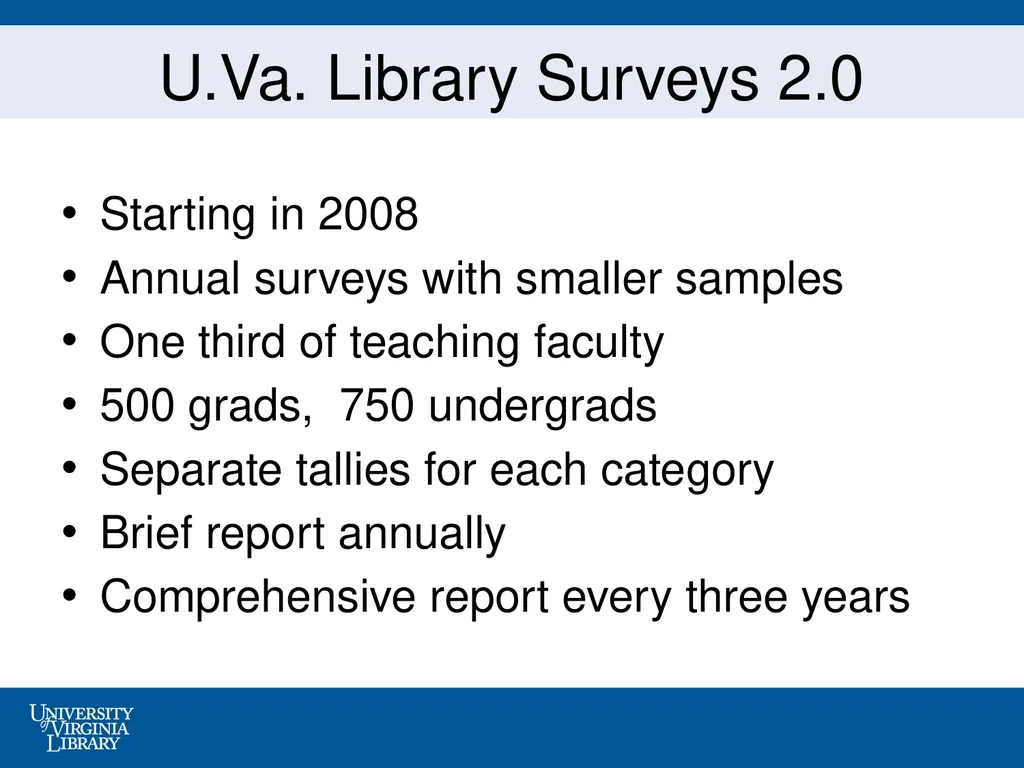
slide6. U.Va. Library Surveys 2.0 Starting in 2008
Annual surveys with smaller samples
One third of teaching faculty
500 grads, 750 undergrads
Separate tallies for each category
Brief report annually
Comprehensive report every three years<br>
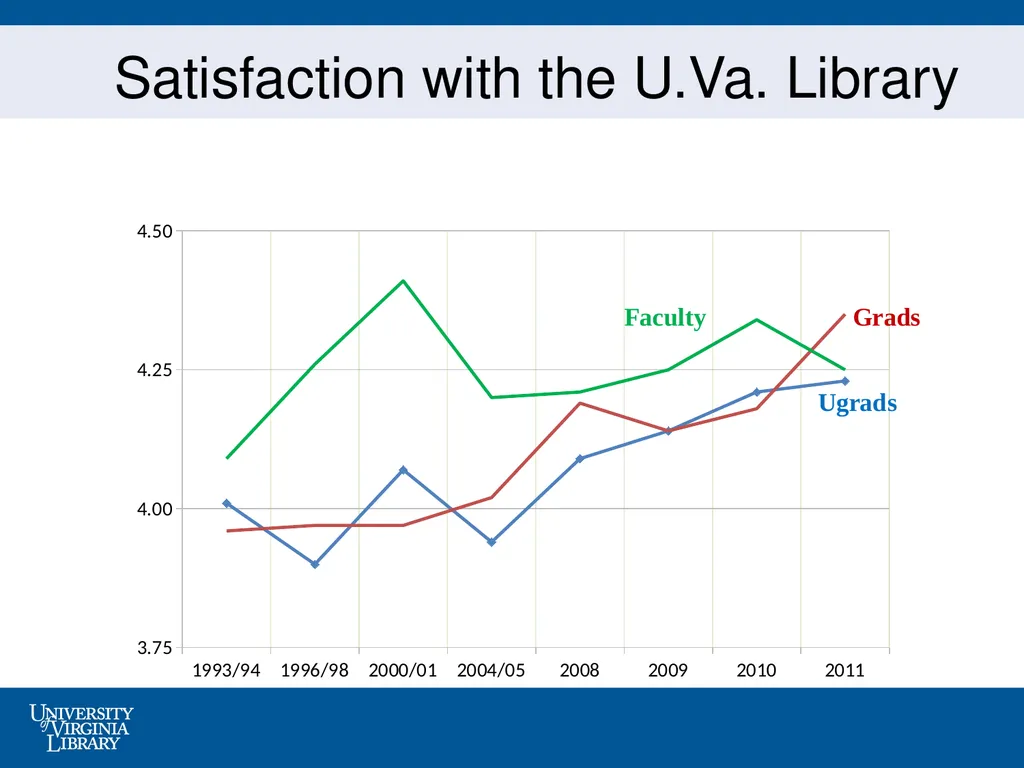
slide7. Satisfaction with the U.Va. Library<br>
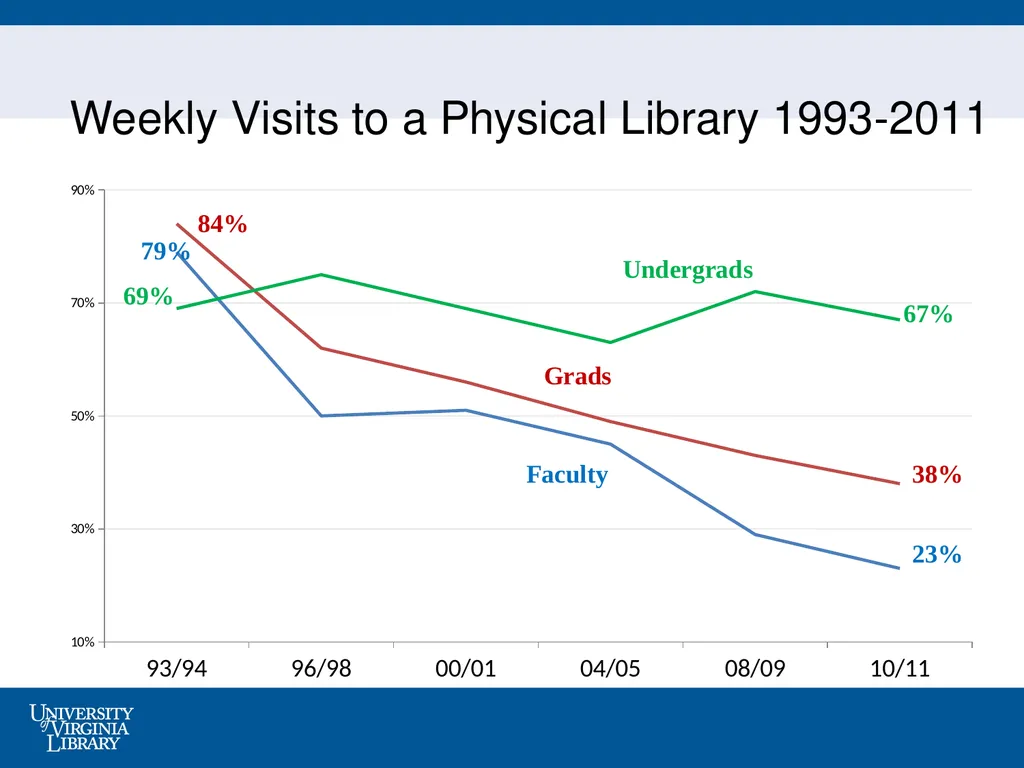
slide8. Weekly Visits to a Physical Library 1993-2011<br>
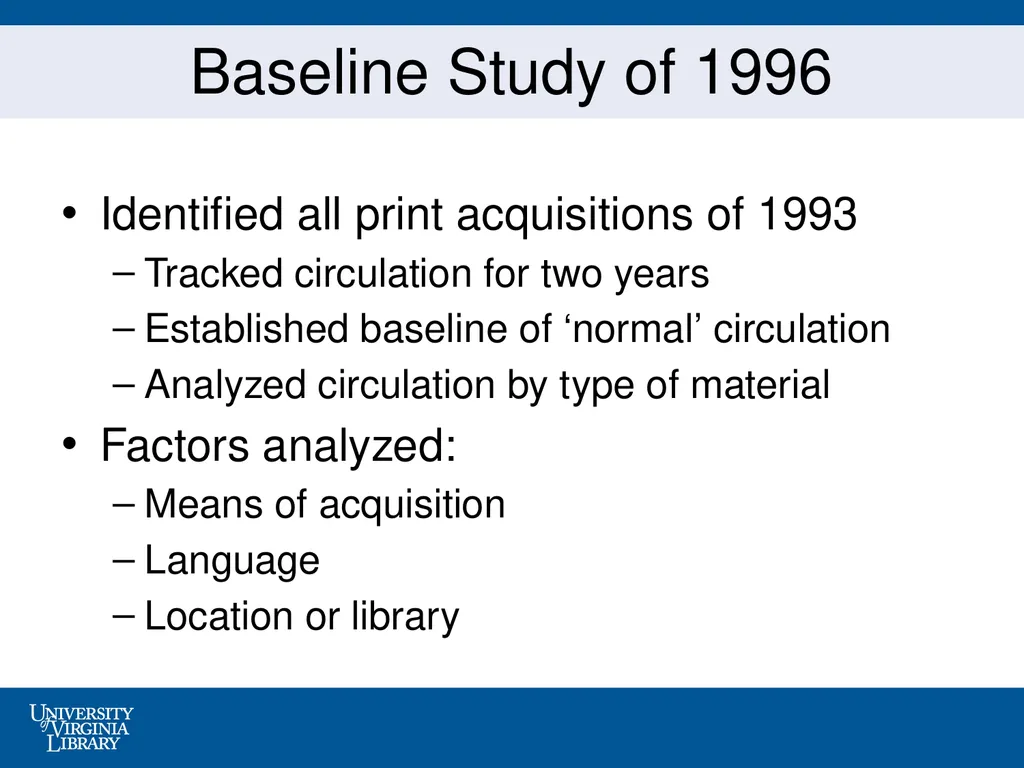
slide9. Baseline Study of 1996 Identified all print acquisitions of 1993
Tracked circulation for two years
Established baseline of ‘normal’ circulation
Analyzed circulation by type of material
Factors analyzed:
Means of acquisition
Language
Location or library<br>
slide10. Baseline Study Findings Mean circ per item: 1.40
Overall, 49% of items circulated
53% of purchases circulated
35% of gifts
8% of exchanges
65% for English language
71% for English language purchases<br>
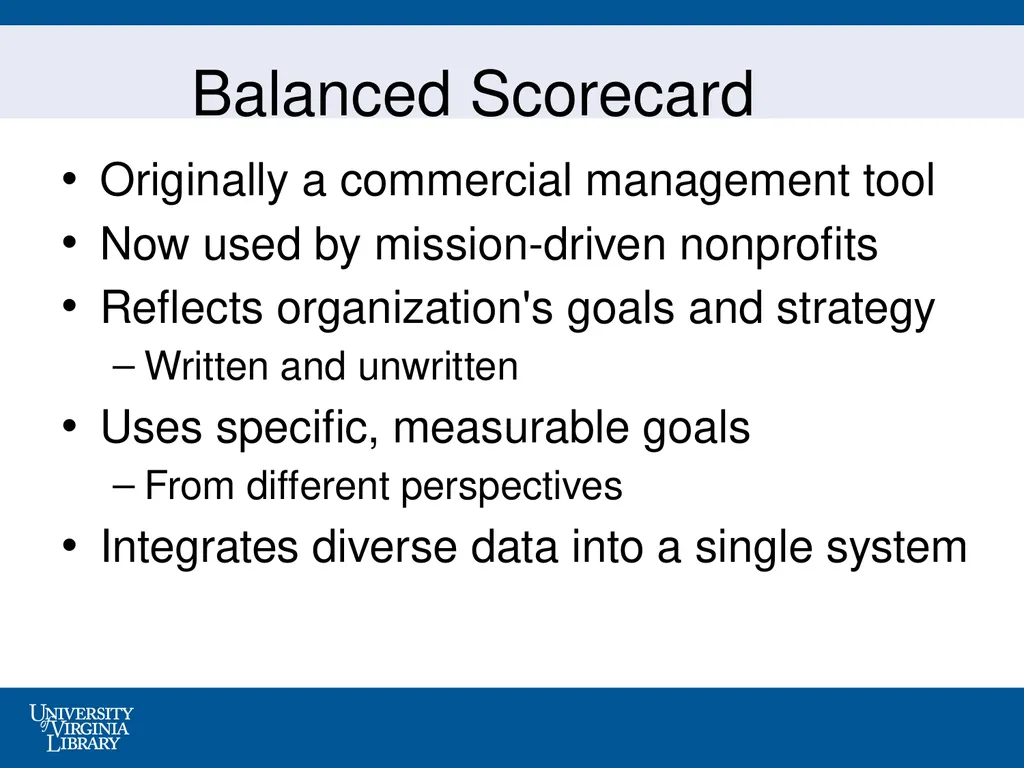
slide11. Balanced Scorecard Originally a commercial management tool
Now used by mission-driven nonprofits
Reflects organization's goals and strategy
Written and unwritten
Uses specific, measurable goals
From different perspectives
Integrates diverse data into a single system<br>
slide12. The BSC at the U.Va. Library Implemented in 2001
Results tallied FY02 through FY09
Abbreviated scorecard for FY10
Re-invented process in FY10-11
New framework for FY12
A work in progress<br>
slide13. Scorecard perspectives User perspective: "how well is the library meeting the needs and expectations of its customers?”
Finance perspective: "how well are the library's finances managed?"
Internal process perspective: "how well do processes function to deliver library services?"
Future or learning perspective: "how well is the library positioned to ensure future success?"<br>
slide14. Metric U.3.A. Circulation of new monographs Target1: 60% of all newly cataloged print monographs should circulate within two years.
Target2: 50% should circulate within two years.<br>
slide15. Metric F.1.A. Library spending compared to University expenditures Target1: : The University Library will account for at least 2.50% of the University’s academic division expenditures.
Target2: : The Library will account for at least 2.25% of expenditures.<br>
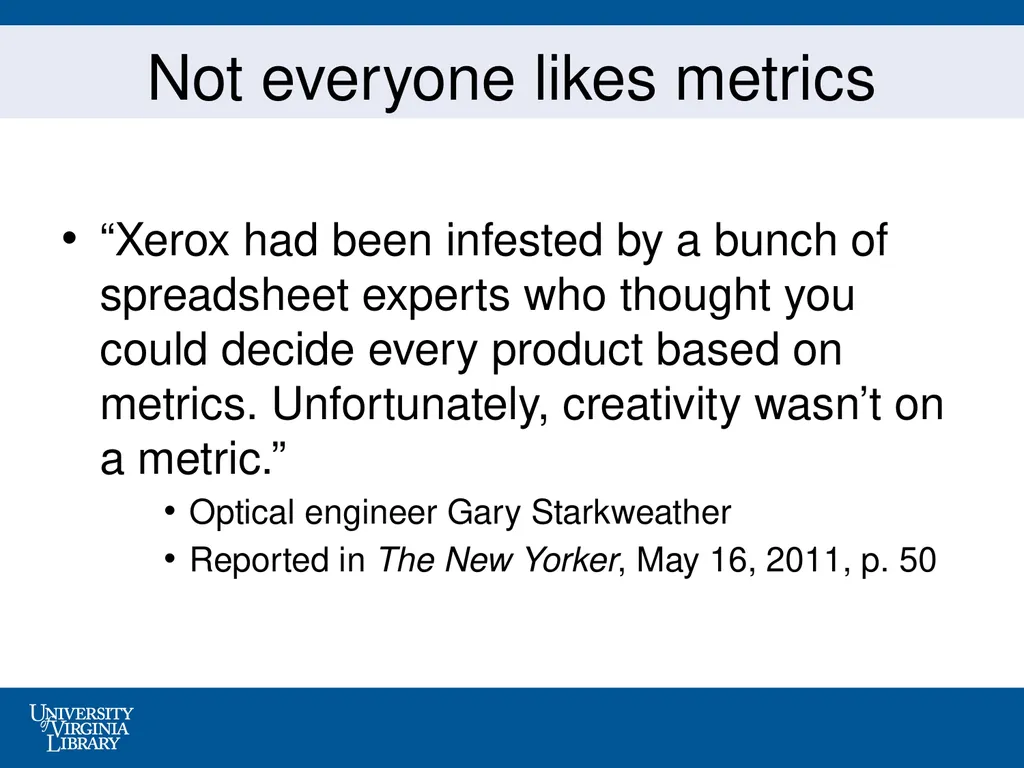
slide16. Not everyone likes metrics “Xerox had been infested by a bunch of spreadsheet experts who thought you could decide every product based on metrics. Unfortunately, creativity wasn’t on a metric.”
Optical engineer Gary Starkweather
Reported in The New Yorker, May 16, 2011, p. 50<br>
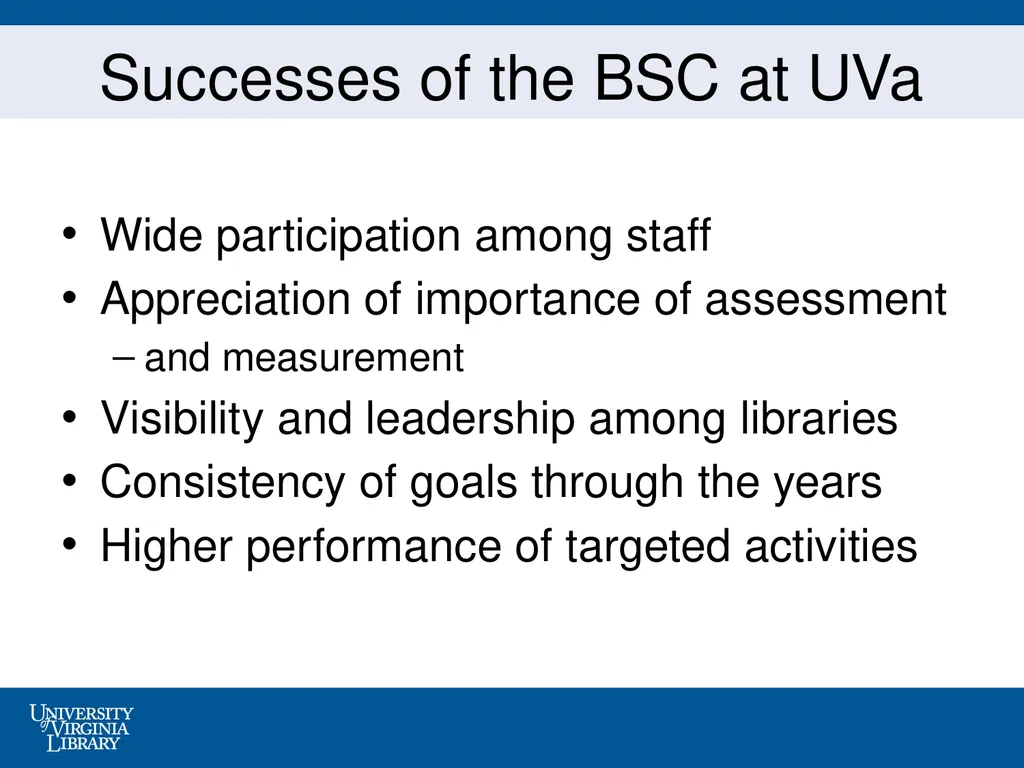
slide17. Successes of the BSC at UVa Wide participation among staff
Appreciation of importance of assessment
and measurement
Visibility and leadership among libraries
Consistency of goals through the years
Higher performance of targeted activities<br>
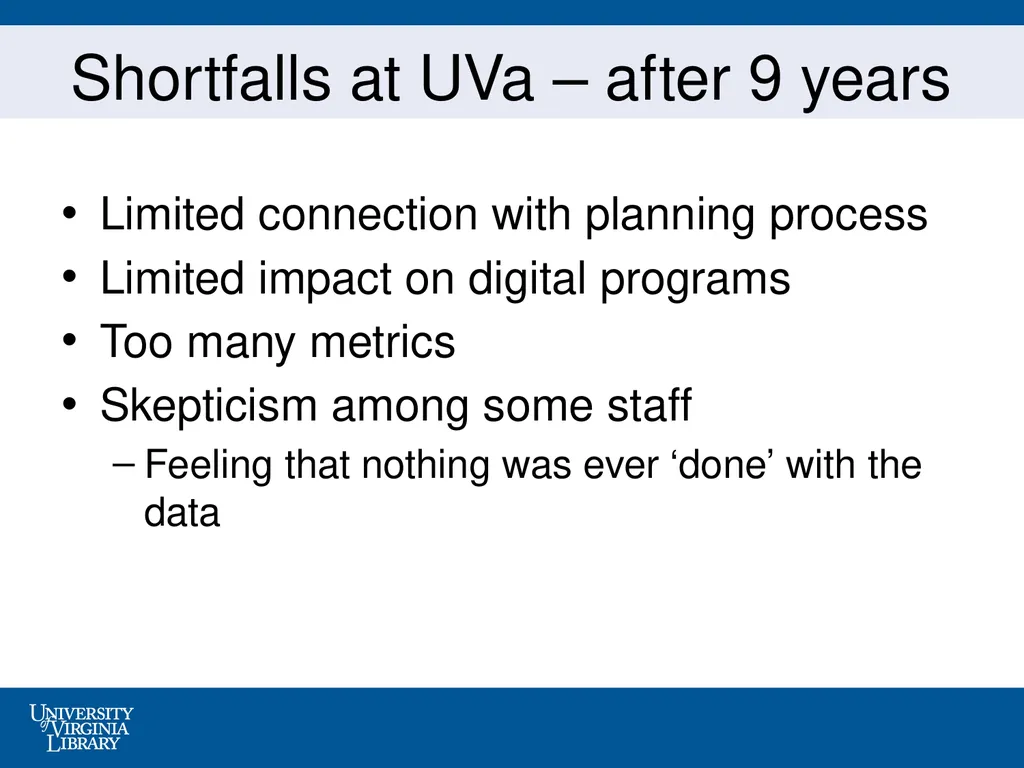
slide18. Shortfalls at UVa – after 9 years Limited connection with planning process
Limited impact on digital programs
Too many metrics
Skepticism among some staff
Feeling that nothing was ever ‘done’ with the data<br>
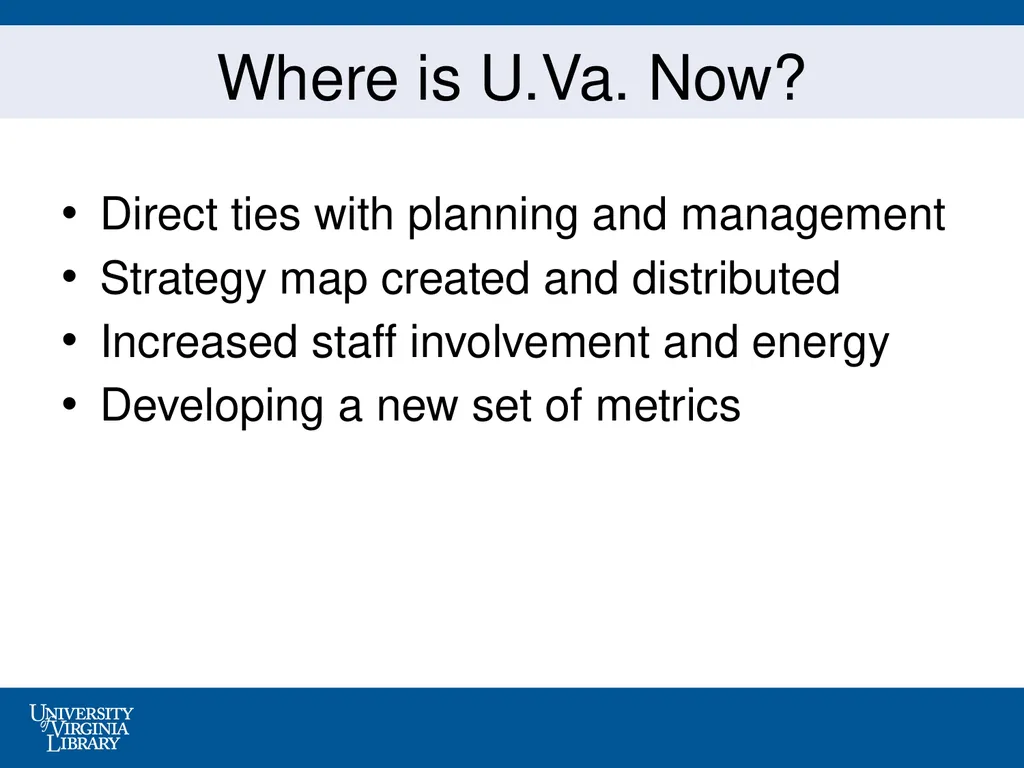
slide19. Where is U.Va. Now? Direct ties with planning and management
Strategy map created and distributed
Increased staff involvement and energy
Developing a new set of metrics<br>
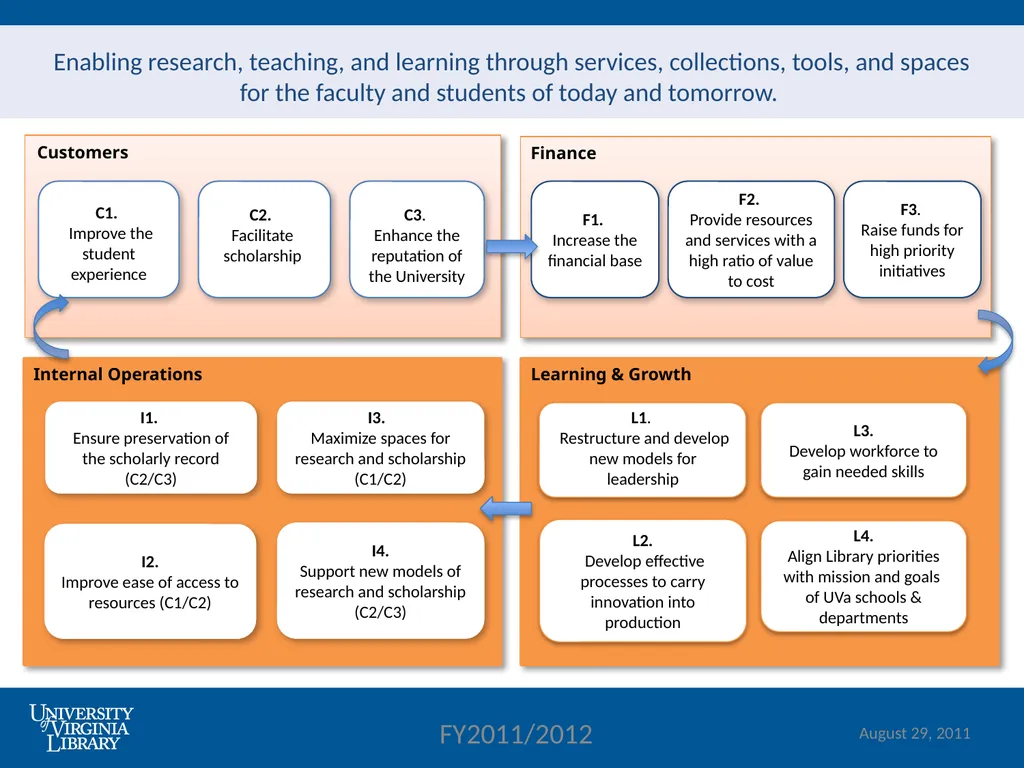
slide20. Enabling research, teaching, and learning through services, collections, tools, and spaces for the faculty and students of today and tomorrow. Finance F1.
Increase the financial base F2.
Provide resources and services with a high ratio of value to cost F3.
Raise funds for high priority initiatives C2.
Facilitate scholarship C1.
Improve the student experience C3.
Enhance the reputation of the University L2.
Develop effective processes to carry innovation into production L1.
Restructure and develop new models for leadership L3.
Develop workforce to gain needed skills I1.
Ensure preservation of the scholarly record (C2/C3) L4.
Align Library priorities with mission and goals of UVa schools & departments August 29, 2011 FY2011/2012 I3.
Maximize spaces for research and scholarship (C1/C2) I2.
Improve ease of access to resources (C1/C2) I4.
Support new models of research and scholarship (C2/C3)<br>
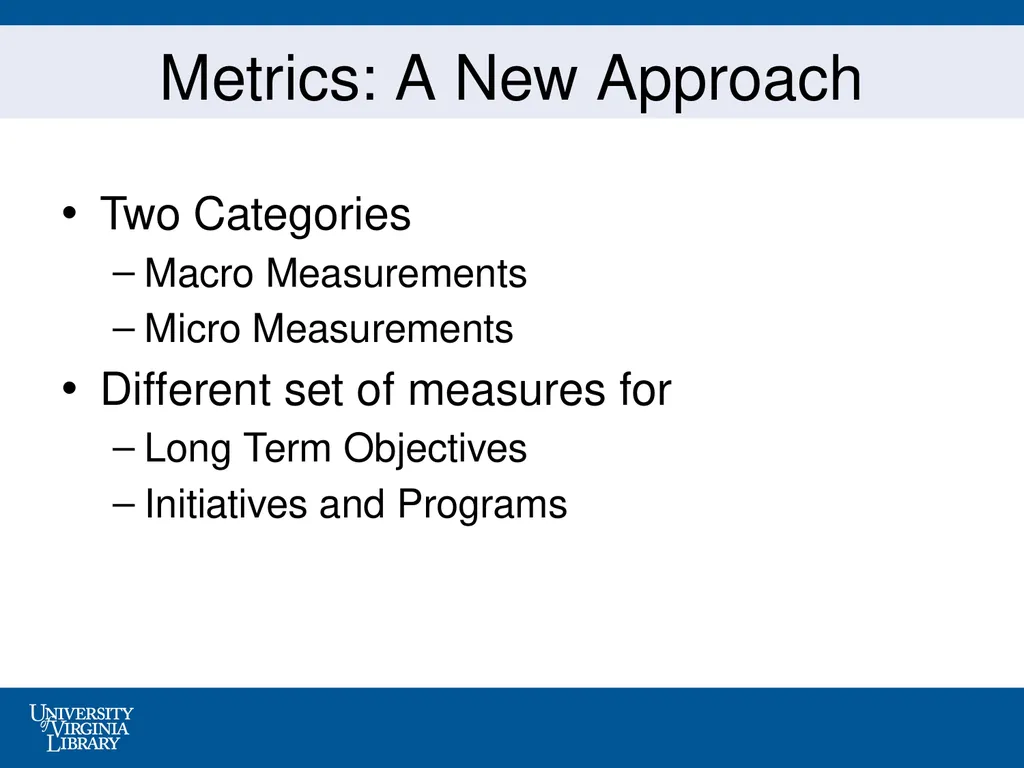
slide21. Metrics: A New Approach Two Categories
Macro Measurements
Micro Measurements
Different set of measures for
Long Term Objectives
Initiatives and Programs<br>
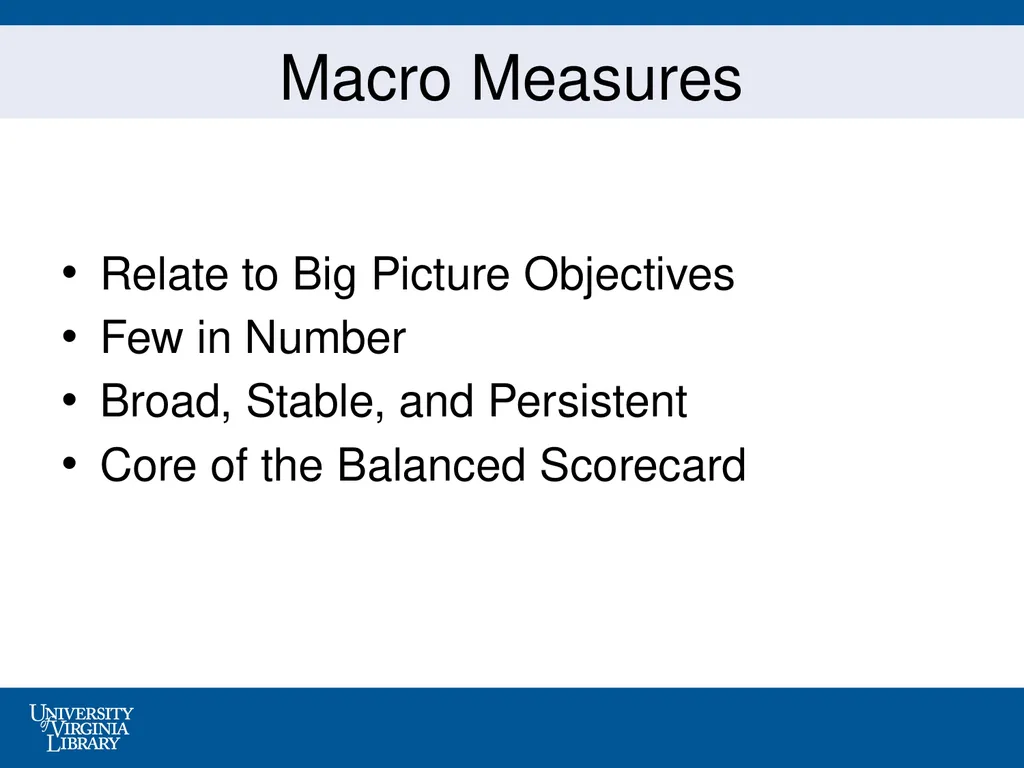
slide22. Macro Measures Relate to Big Picture Objectives
Few in Number
Broad, Stable, and Persistent
Core of the Balanced Scorecard<br>
slide23. Micro Measures Relate to Initiatives and New Programs
Measured at the Unit or Committee Level
Nimble and Changing
Not Part of the Scorecard Tallies<br>
slide24. Communicating Strategy New budget process for the University
Budget allocations to be data driven
Scorecard and strategy map serving as primary communication tools<br>
slide25. Are we meeting our goals?
Are we preparing for the future?
Are we focusing on the right things? Questions for the Scorecard<br>
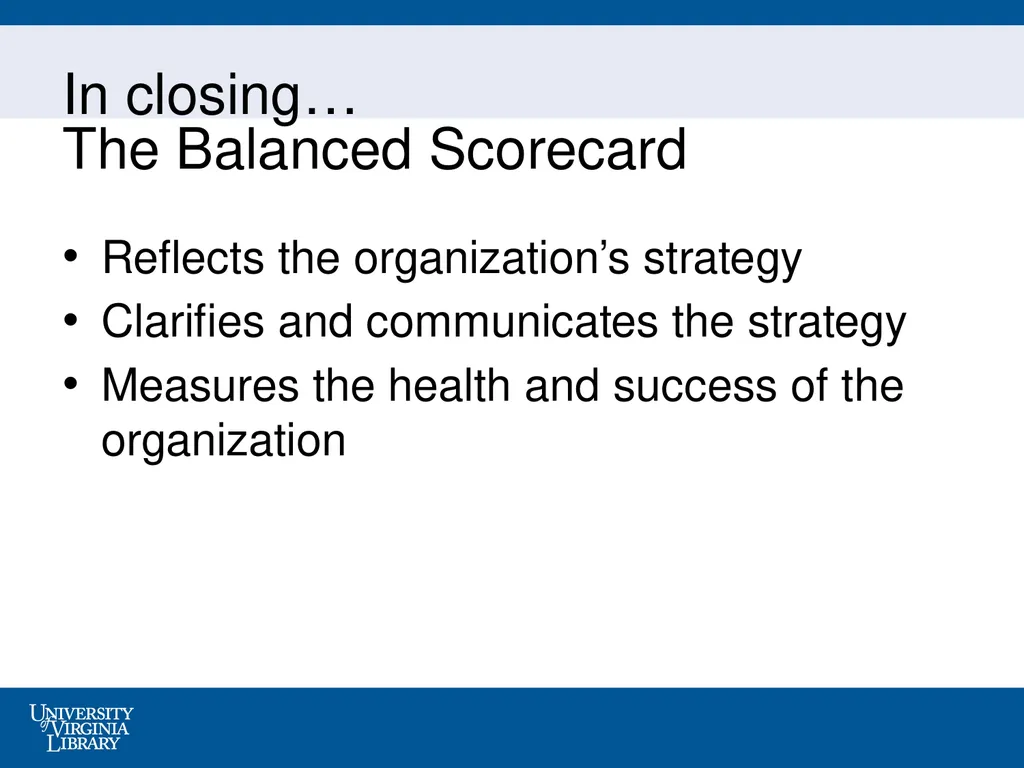
slide26. In closing… The Balanced Scorecard Reflects the organization’s strategy
Clarifies and communicates the strategy
Measures the health and success of the organization<br>
Strategy Development and Evolution
Jim Self
Management Information Services
University of Virginia Library
20th Pan Hellenic Conference of Academic Libraries
Thessaloniki, Greece
15 November, 2011<br>
slide2. The University of Virginia 15,000 undergraduates
67% in-state, 33% out
Most notable for liberal arts
Highly ranked by U.S. News
6,000 graduate students
Prominent for humanities, law, business
Plans expansion in sciences
Located in Charlottesville
Metro population of 160,000<br>
slide3. Collecting Data at the U.Va. Library Statistical Compilation and Reporting
Customer Surveys
Staff Surveys
Mining Existing Records
Comparisons with peers
Qualitative techniques
Long involvement with ARL statistics<br>
slide4. Management Information Services MIS committee formed in 1992
Evolved into a department 1996-2000
Currently three staff
Coordinates collection of statistics
Publishes annual statistical report
Coordinates assessment
Resource for management and staff<br>
slide5. U.Va. Library Surveys 1.0 Faculty
Sample of 500
1993 (paper)
1996 (paper)
2000 (Web)
2004 (Web) Students
Separate tallies for grads and undergrads
Sample size varied
1994 (paper)
1998 (Web)
2001 (Web)
2005 (Web)<br>
slide6. U.Va. Library Surveys 2.0 Starting in 2008
Annual surveys with smaller samples
One third of teaching faculty
500 grads, 750 undergrads
Separate tallies for each category
Brief report annually
Comprehensive report every three years<br>
slide7. Satisfaction with the U.Va. Library<br>
slide8. Weekly Visits to a Physical Library 1993-2011<br>
slide9. Baseline Study of 1996 Identified all print acquisitions of 1993
Tracked circulation for two years
Established baseline of ‘normal’ circulation
Analyzed circulation by type of material
Factors analyzed:
Means of acquisition
Language
Location or library<br>
slide10. Baseline Study Findings Mean circ per item: 1.40
Overall, 49% of items circulated
53% of purchases circulated
35% of gifts
8% of exchanges
65% for English language
71% for English language purchases<br>
slide11. Balanced Scorecard Originally a commercial management tool
Now used by mission-driven nonprofits
Reflects organization's goals and strategy
Written and unwritten
Uses specific, measurable goals
From different perspectives
Integrates diverse data into a single system<br>
slide12. The BSC at the U.Va. Library Implemented in 2001
Results tallied FY02 through FY09
Abbreviated scorecard for FY10
Re-invented process in FY10-11
New framework for FY12
A work in progress<br>
slide13. Scorecard perspectives User perspective: "how well is the library meeting the needs and expectations of its customers?”
Finance perspective: "how well are the library's finances managed?"
Internal process perspective: "how well do processes function to deliver library services?"
Future or learning perspective: "how well is the library positioned to ensure future success?"<br>
slide14. Metric U.3.A. Circulation of new monographs Target1: 60% of all newly cataloged print monographs should circulate within two years.
Target2: 50% should circulate within two years.<br>
slide15. Metric F.1.A. Library spending compared to University expenditures Target1: : The University Library will account for at least 2.50% of the University’s academic division expenditures.
Target2: : The Library will account for at least 2.25% of expenditures.<br>
slide16. Not everyone likes metrics “Xerox had been infested by a bunch of spreadsheet experts who thought you could decide every product based on metrics. Unfortunately, creativity wasn’t on a metric.”
Optical engineer Gary Starkweather
Reported in The New Yorker, May 16, 2011, p. 50<br>
slide17. Successes of the BSC at UVa Wide participation among staff
Appreciation of importance of assessment
and measurement
Visibility and leadership among libraries
Consistency of goals through the years
Higher performance of targeted activities<br>
slide18. Shortfalls at UVa – after 9 years Limited connection with planning process
Limited impact on digital programs
Too many metrics
Skepticism among some staff
Feeling that nothing was ever ‘done’ with the data<br>
slide19. Where is U.Va. Now? Direct ties with planning and management
Strategy map created and distributed
Increased staff involvement and energy
Developing a new set of metrics<br>
slide20. Enabling research, teaching, and learning through services, collections, tools, and spaces for the faculty and students of today and tomorrow. Finance F1.
Increase the financial base F2.
Provide resources and services with a high ratio of value to cost F3.
Raise funds for high priority initiatives C2.
Facilitate scholarship C1.
Improve the student experience C3.
Enhance the reputation of the University L2.
Develop effective processes to carry innovation into production L1.
Restructure and develop new models for leadership L3.
Develop workforce to gain needed skills I1.
Ensure preservation of the scholarly record (C2/C3) L4.
Align Library priorities with mission and goals of UVa schools & departments August 29, 2011 FY2011/2012 I3.
Maximize spaces for research and scholarship (C1/C2) I2.
Improve ease of access to resources (C1/C2) I4.
Support new models of research and scholarship (C2/C3)<br>
slide21. Metrics: A New Approach Two Categories
Macro Measurements
Micro Measurements
Different set of measures for
Long Term Objectives
Initiatives and Programs<br>
slide22. Macro Measures Relate to Big Picture Objectives
Few in Number
Broad, Stable, and Persistent
Core of the Balanced Scorecard<br>
slide23. Micro Measures Relate to Initiatives and New Programs
Measured at the Unit or Committee Level
Nimble and Changing
Not Part of the Scorecard Tallies<br>
slide24. Communicating Strategy New budget process for the University
Budget allocations to be data driven
Scorecard and strategy map serving as primary communication tools<br>
slide25. Are we meeting our goals?
Are we preparing for the future?
Are we focusing on the right things? Questions for the Scorecard<br>
slide26. In closing… The Balanced Scorecard Reflects the organization’s strategy
Clarifies and communicates the strategy
Measures the health and success of the organization<br>