
The Capital Asset Pricing Model Global Financial
A
Published · 43 slides · 0 views

1 / 1

Description
The Capital Asset Pricing Model Global Financial Management Campbell R. Harvey Fuqua School of Business Duke University charveymail.duke.edu http:www.duke.educharvey Overview Utility and risk aversion Choosing efficient portfolios
Related Topics
Share
Embed code
Download this presentation From Below
"The Capital Asset Pricing Model Global Financial" is the property of its rightful owner. Permission is granted to download and print the materials on this website for personal, non-commercial use only, and to display it on your personal computer provided you do not modify the materials and that you retain all copyright notices contained in the materials. By downloading content from our website, you accept the terms of this agreement.
Presentation Transcript
01
The Capital Asset Pricing Model Global Financial Management
Campbell R. Harvey
Fuqua School of Business
Duke University
charvey@mail.duke.edu
http://www.duke.edu/~charvey<br>
Campbell R. Harvey
Fuqua School of Business
Duke University
charvey@mail.duke.edu
http://www.duke.edu/~charvey<br>
02
Overview Utility and risk aversion
Choosing efficient portfolios
Investing with a risk-free asset
Borrowing and lending
The markt portfolio
The Capital Market Line (CML)
The Capital Asset Pricing Model (CAPM)
The Security Market Line (SML)
Beta
Project analysis<br>
Choosing efficient portfolios
Investing with a risk-free asset
Borrowing and lending
The markt portfolio
The Capital Market Line (CML)
The Capital Asset Pricing Model (CAPM)
The Security Market Line (SML)
Beta
Project analysis<br>
03
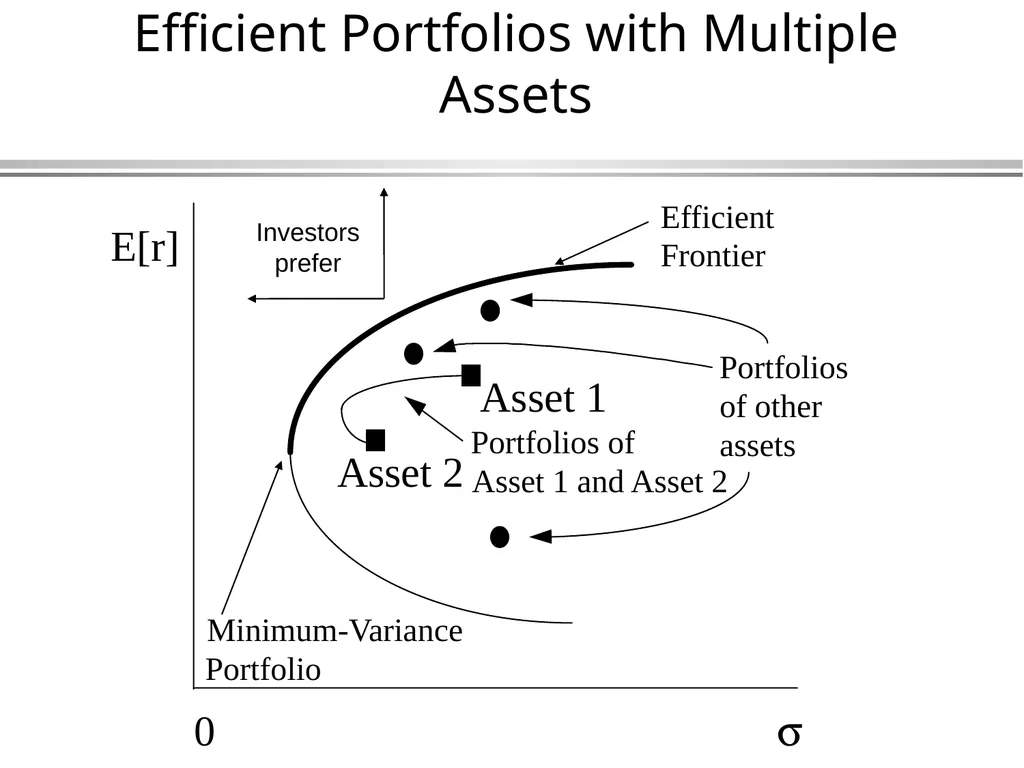
Efficient Portfolios with Multiple Assets E[r] s 0 Asset 1 Asset 2<br>
04
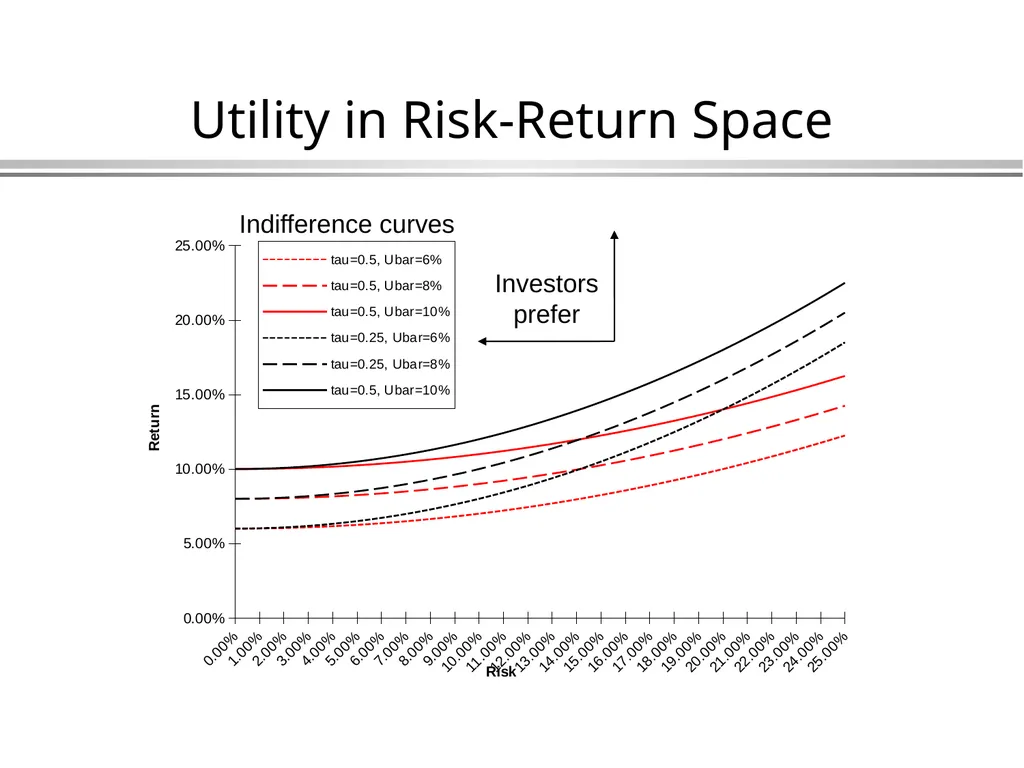
Utility in Risk-Return Space Indifference curves Investors
prefer<br>
prefer<br>
05
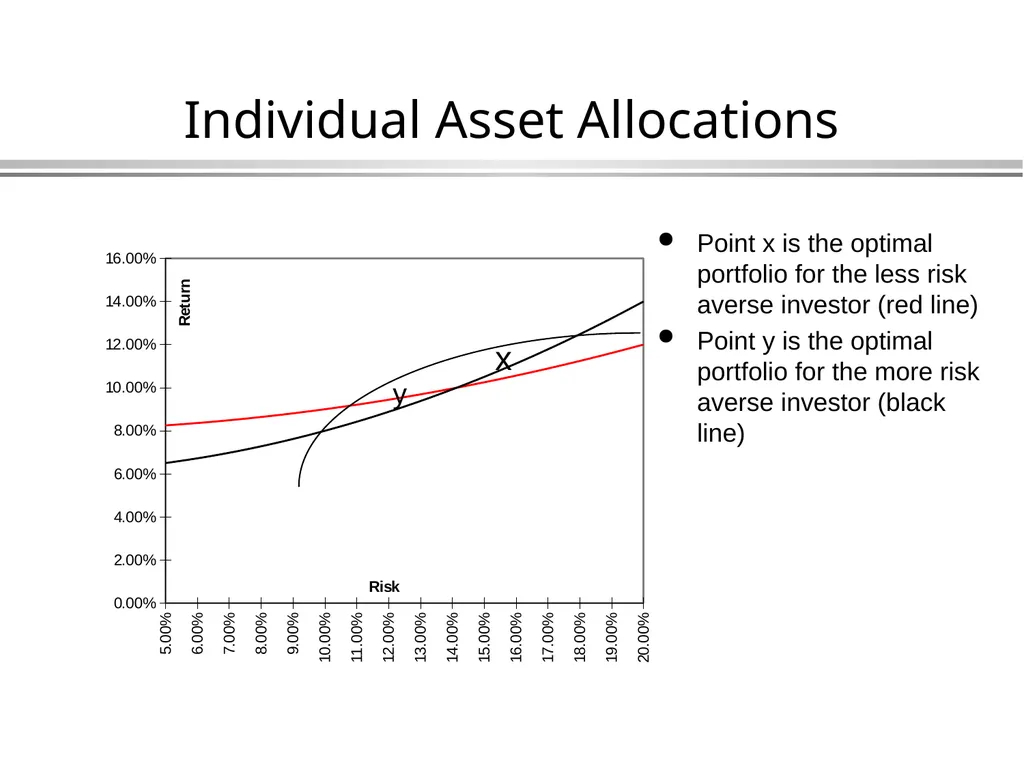
Individual Asset Allocations x y Point x is the optimal portfolio for the less risk averse investor (red line)
Point y is the optimal portfolio for the more risk averse investor (black line)<br>
Point y is the optimal portfolio for the more risk averse investor (black line)<br>
06
Introducing a Riskfree Asset Suppose we introduce the opportunity to invest in a riskfree asset.
How does this alter investors’ portfolio choices?
The riskfree asset has a zero variance, and zero covariance with every other asset (or portfolio).
var(rf) = 0.
cov(rf, rj) = 0 for all j.
What is the expected return and variance of a portfolio consisting of a fraction (1-a) of the riskfree asset and a of the risky asset (or portfolio)?<br>
How does this alter investors’ portfolio choices?
The riskfree asset has a zero variance, and zero covariance with every other asset (or portfolio).
var(rf) = 0.
cov(rf, rj) = 0 for all j.
What is the expected return and variance of a portfolio consisting of a fraction (1-a) of the riskfree asset and a of the risky asset (or portfolio)?<br>
07
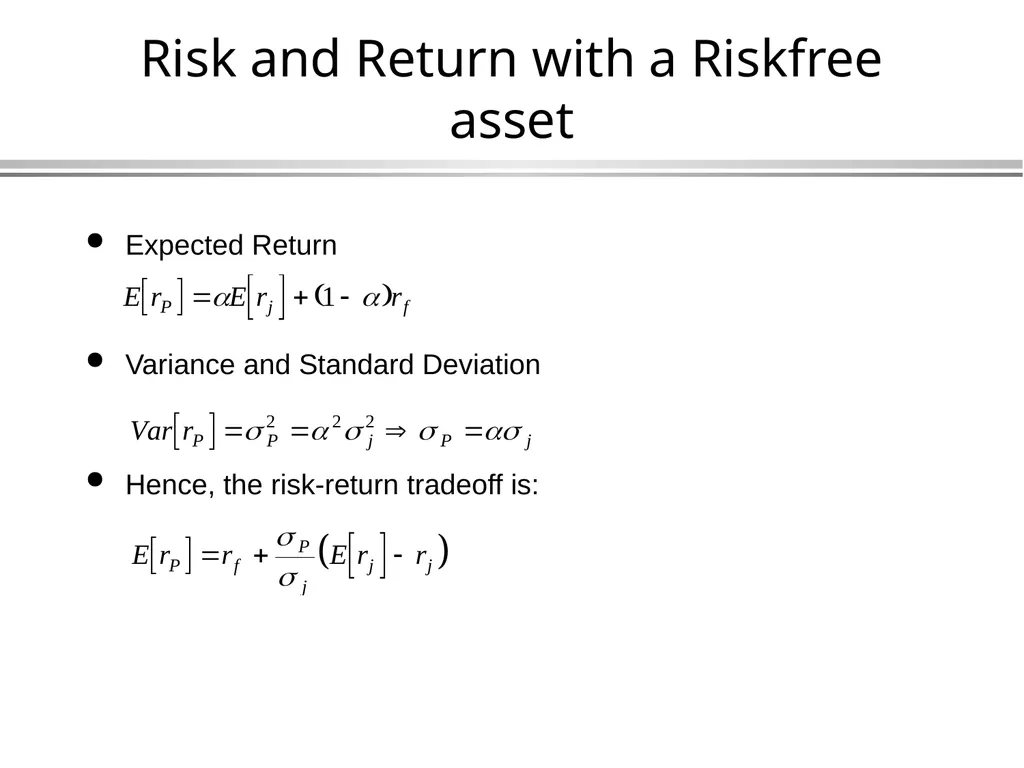
Risk and Return with a Riskfree asset Expected Return
Variance and Standard Deviation
Hence, the risk-return tradeoff is:<br>
Variance and Standard Deviation
Hence, the risk-return tradeoff is:<br>
08
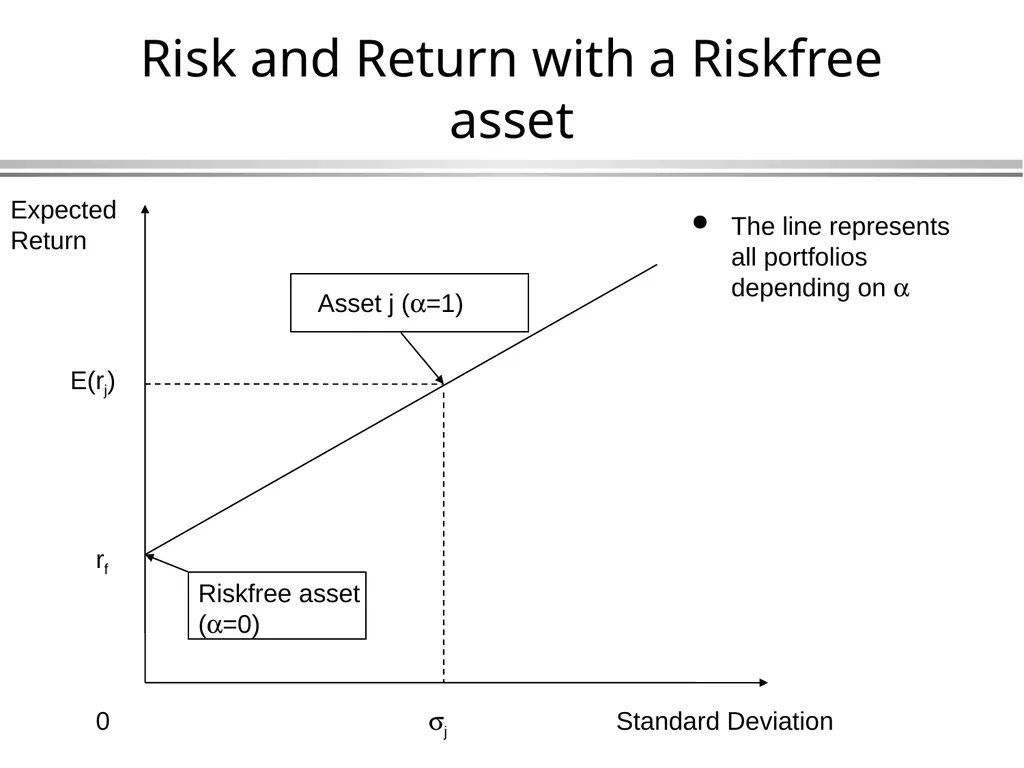
Expected Return Standard Deviation rf sj E(rj) Asset j (a=1) The line represents all portfolios depending on a Risk and Return with a Riskfree asset Riskfree asset (a=0) 0<br>
09
Investing with Borrowing and Lending Standard Deviation s M 0 Expected Return M Lending Borrowing<br>
10
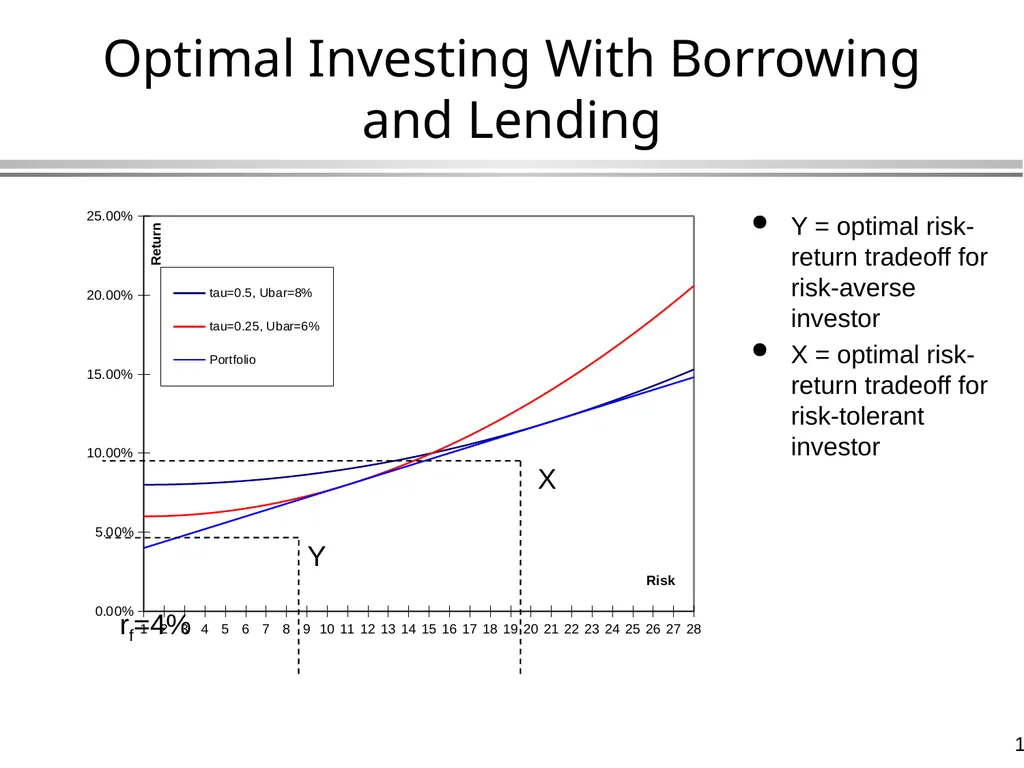
Optimal Investing With Borrowing and Lending X Y Y = optimal risk-return tradeoff for risk-averse investor
X = optimal risk-return tradeoff for risk-tolerant investor rf=4%<br>
X = optimal risk-return tradeoff for risk-tolerant investor rf=4%<br>
11
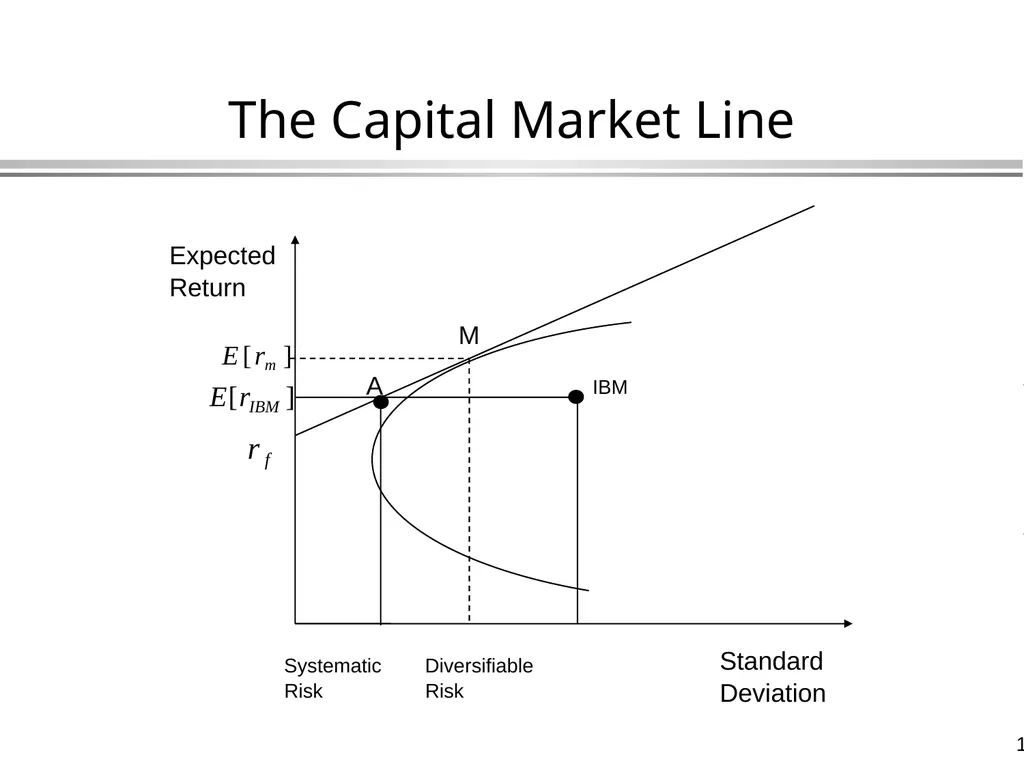
The Capital Market Line Expected Return M Standard Deviation IBM Systematic Risk Diversifiable Risk A<br>
12
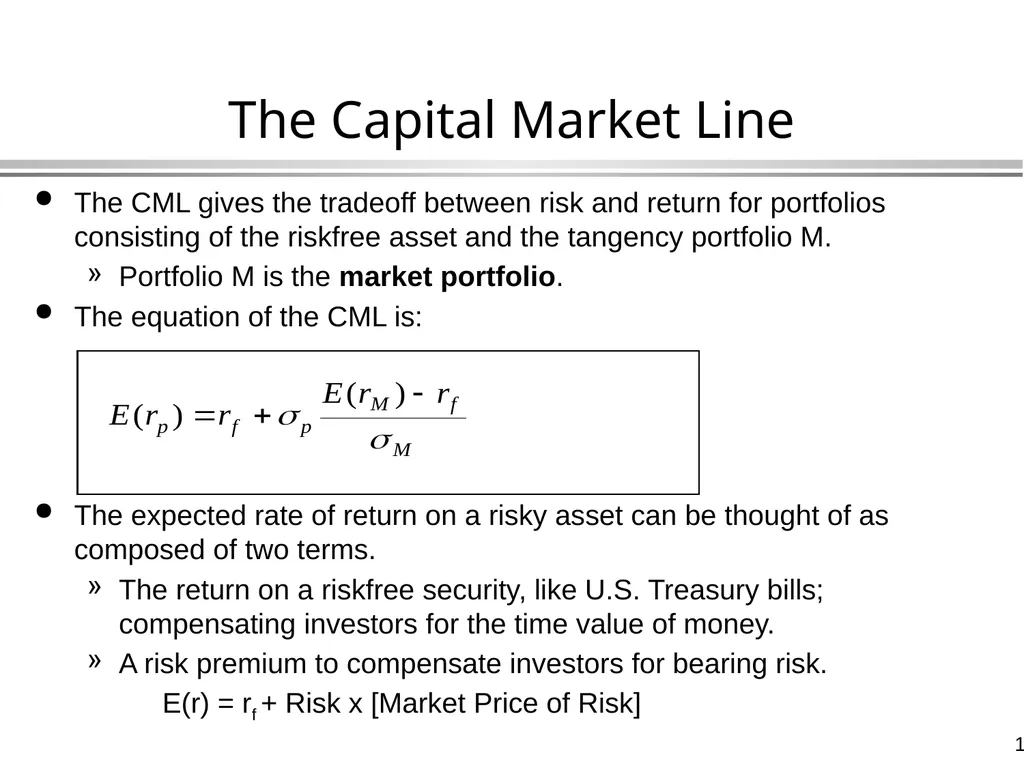
The Capital Market Line The CML gives the tradeoff between risk and return for portfolios consisting of the riskfree asset and the tangency portfolio M.
Portfolio M is the market portfolio.
The equation of the CML is:
The expected rate of return on a risky asset can be thought of as composed of two terms.
The return on a riskfree security, like U.S. Treasury bills; compensating investors for the time value of money.
A risk premium to compensate investors for bearing risk.
E(r) = rf + Risk x [Market Price of Risk]<br>
Portfolio M is the market portfolio.
The equation of the CML is:
The expected rate of return on a risky asset can be thought of as composed of two terms.
The return on a riskfree security, like U.S. Treasury bills; compensating investors for the time value of money.
A risk premium to compensate investors for bearing risk.
E(r) = rf + Risk x [Market Price of Risk]<br>
13
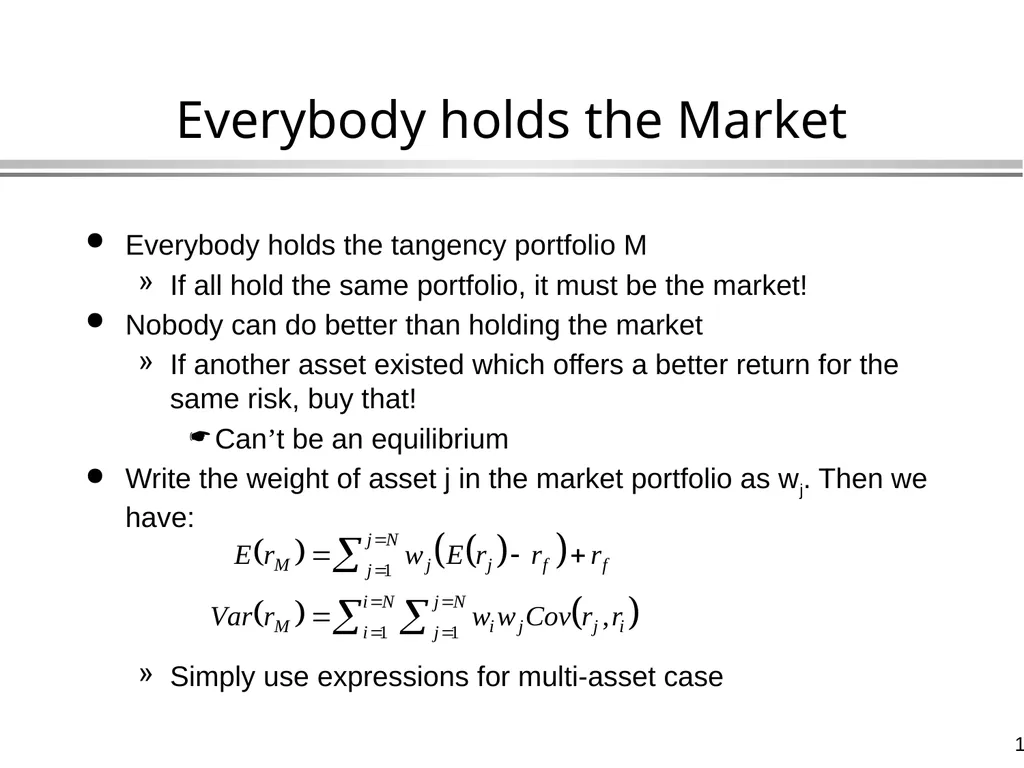
Everybody holds the Market Everybody holds the tangency portfolio M
If all hold the same portfolio, it must be the market!
Nobody can do better than holding the market
If another asset existed which offers a better return for the same risk, buy that!
Can’t be an equilibrium
Write the weight of asset j in the market portfolio as wj. Then we have:
Simply use expressions for multi-asset case<br>
If all hold the same portfolio, it must be the market!
Nobody can do better than holding the market
If another asset existed which offers a better return for the same risk, buy that!
Can’t be an equilibrium
Write the weight of asset j in the market portfolio as wj. Then we have:
Simply use expressions for multi-asset case<br>
14
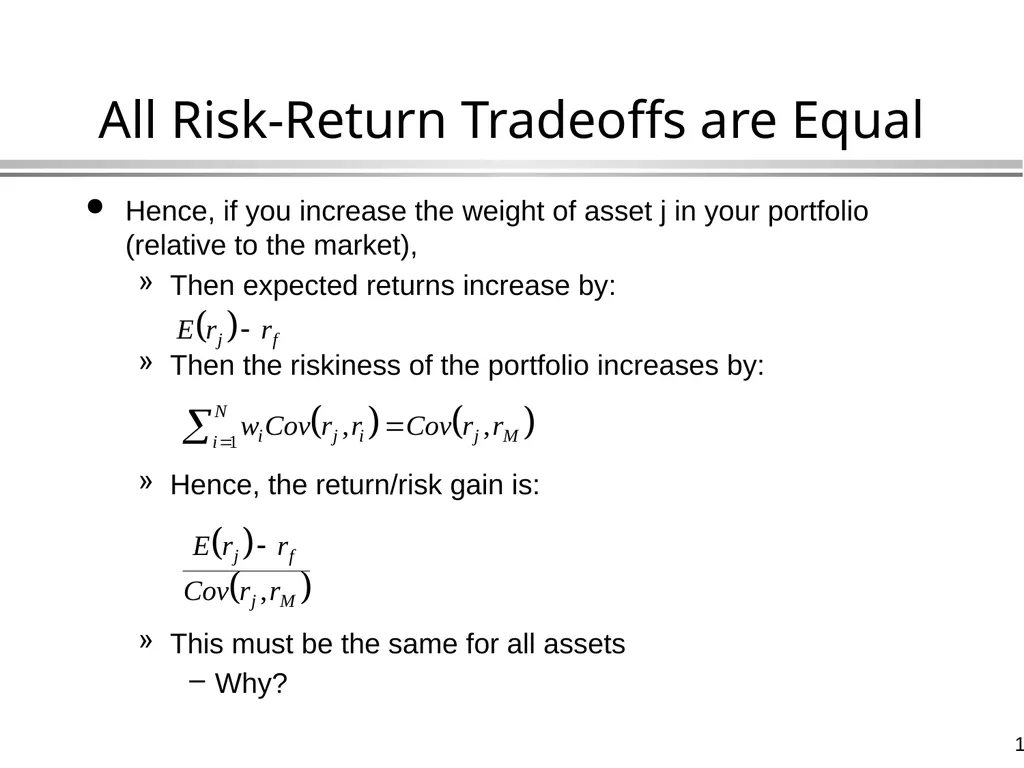
All Risk-Return Tradeoffs are Equal Hence, if you increase the weight of asset j in your portfolio (relative to the market),
Then expected returns increase by:
Then the riskiness of the portfolio increases by:
Hence, the return/risk gain is:
This must be the same for all assets
Why?<br>
Then expected returns increase by:
Then the riskiness of the portfolio increases by:
Hence, the return/risk gain is:
This must be the same for all assets
Why?<br>
15
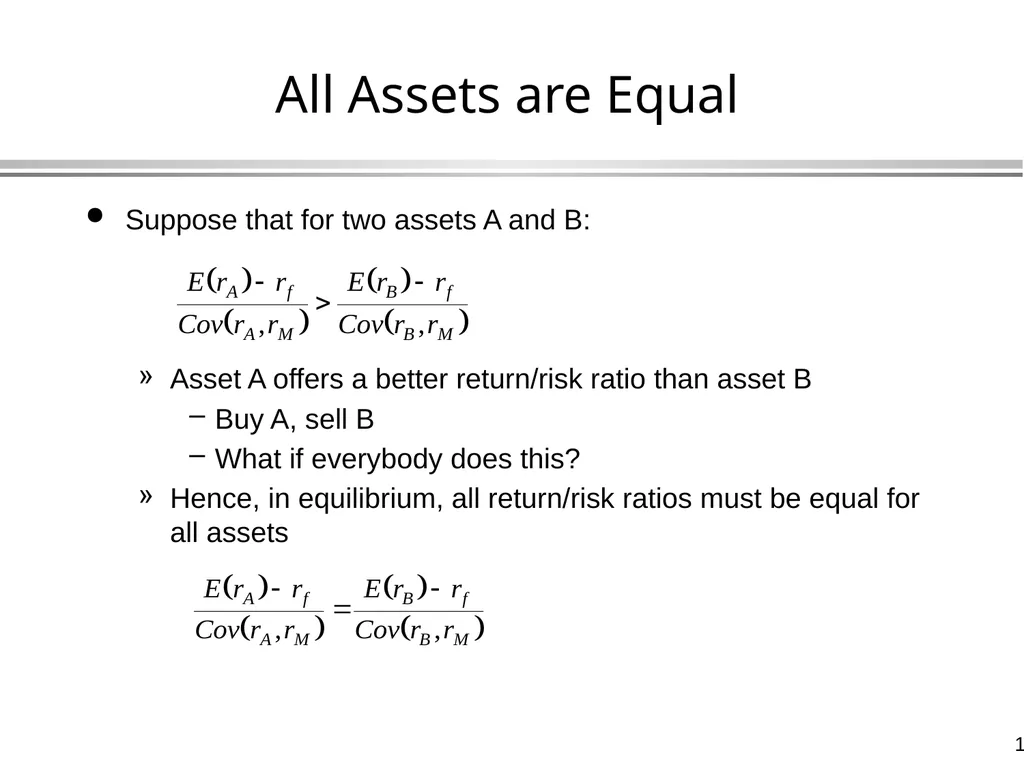
All Assets are Equal Suppose that for two assets A and B:
Asset A offers a better return/risk ratio than asset B
Buy A, sell B
What if everybody does this?
Hence, in equilibrium, all return/risk ratios must be equal for all assets<br>
Asset A offers a better return/risk ratio than asset B
Buy A, sell B
What if everybody does this?
Hence, in equilibrium, all return/risk ratios must be equal for all assets<br>
16
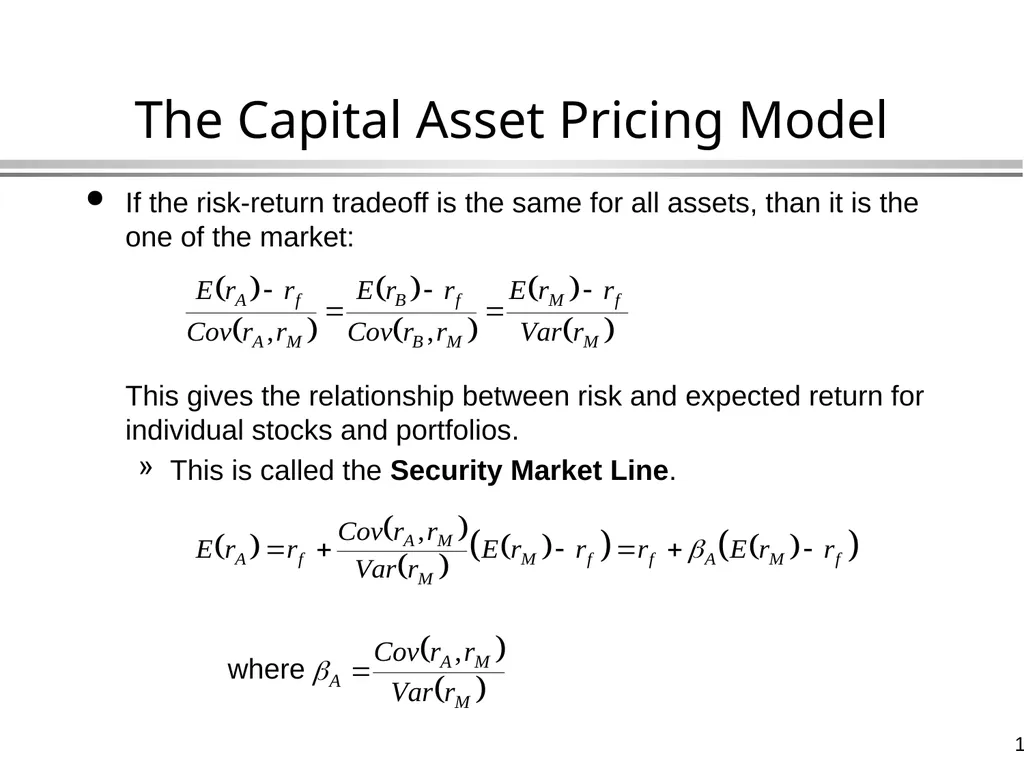
The Capital Asset Pricing Model If the risk-return tradeoff is the same for all assets, than it is the one of the market:
This gives the relationship between risk and expected return for individual stocks and portfolios.
This is called the Security Market Line.
where<br>
This gives the relationship between risk and expected return for individual stocks and portfolios.
This is called the Security Market Line.
where<br>
17
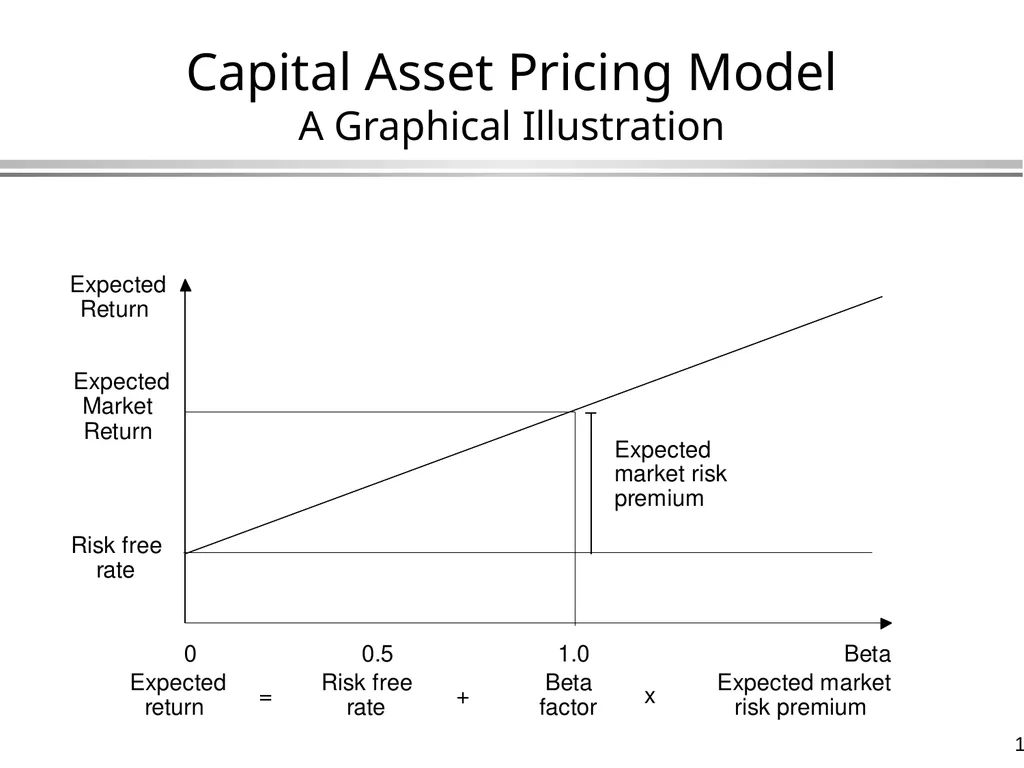
Capital Asset Pricing Model
A Graphical Illustration<br>
18
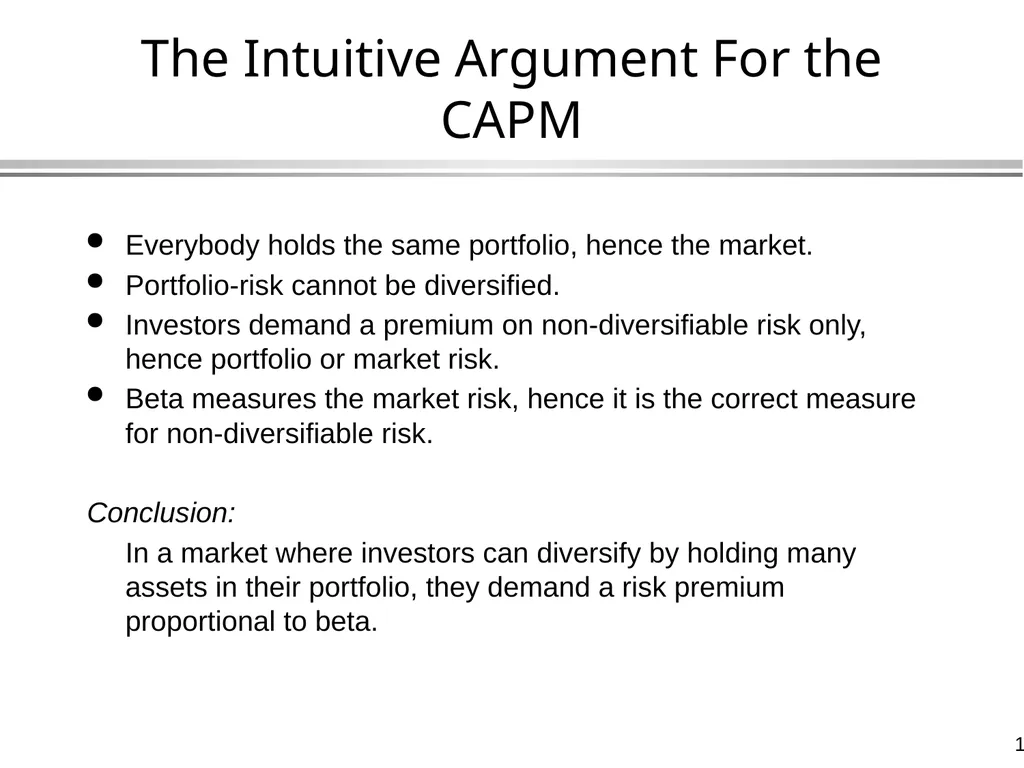
The Intuitive Argument For the CAPM Everybody holds the same portfolio, hence the market.
Portfolio-risk cannot be diversified.
Investors demand a premium on non-diversifiable risk only, hence portfolio or market risk.
Beta measures the market risk, hence it is the correct measure for non-diversifiable risk.
Conclusion:
In a market where investors can diversify by holding many assets in their portfolio, they demand a risk premium proportional to beta.<br>
Portfolio-risk cannot be diversified.
Investors demand a premium on non-diversifiable risk only, hence portfolio or market risk.
Beta measures the market risk, hence it is the correct measure for non-diversifiable risk.
Conclusion:
In a market where investors can diversify by holding many assets in their portfolio, they demand a risk premium proportional to beta.<br>
19
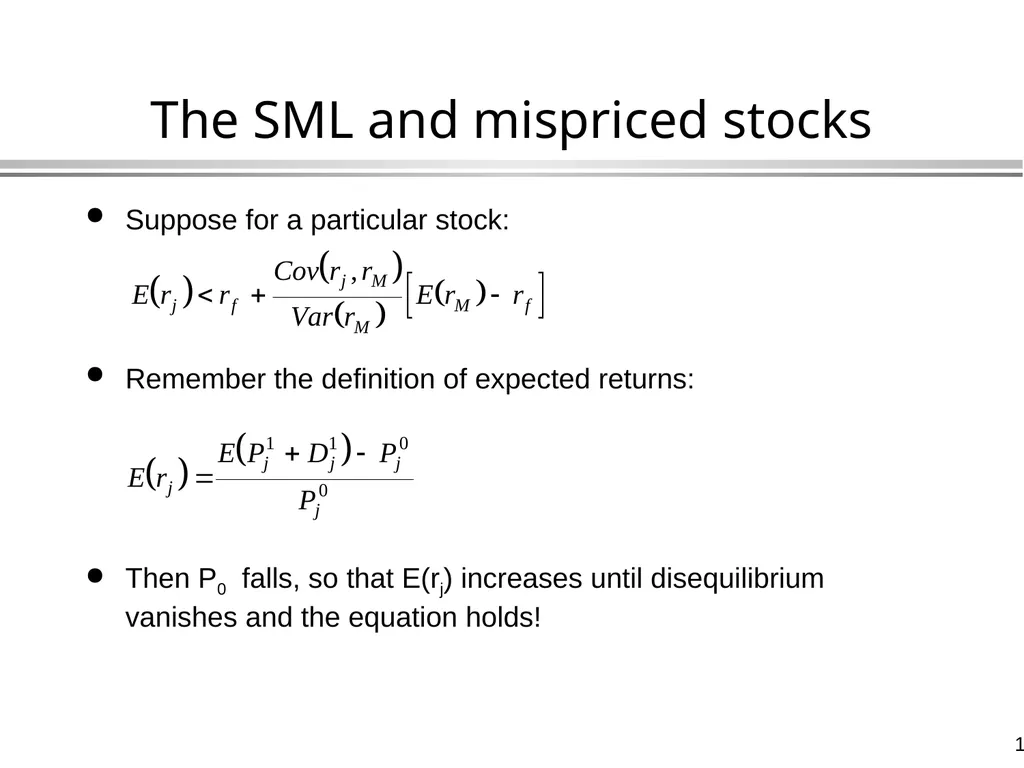
The SML and mispriced stocks Suppose for a particular stock:
Remember the definition of expected returns:
Then P0 falls, so that E(rj) increases until disequilibrium vanishes and the equation holds!<br>
Remember the definition of expected returns:
Then P0 falls, so that E(rj) increases until disequilibrium vanishes and the equation holds!<br>
20
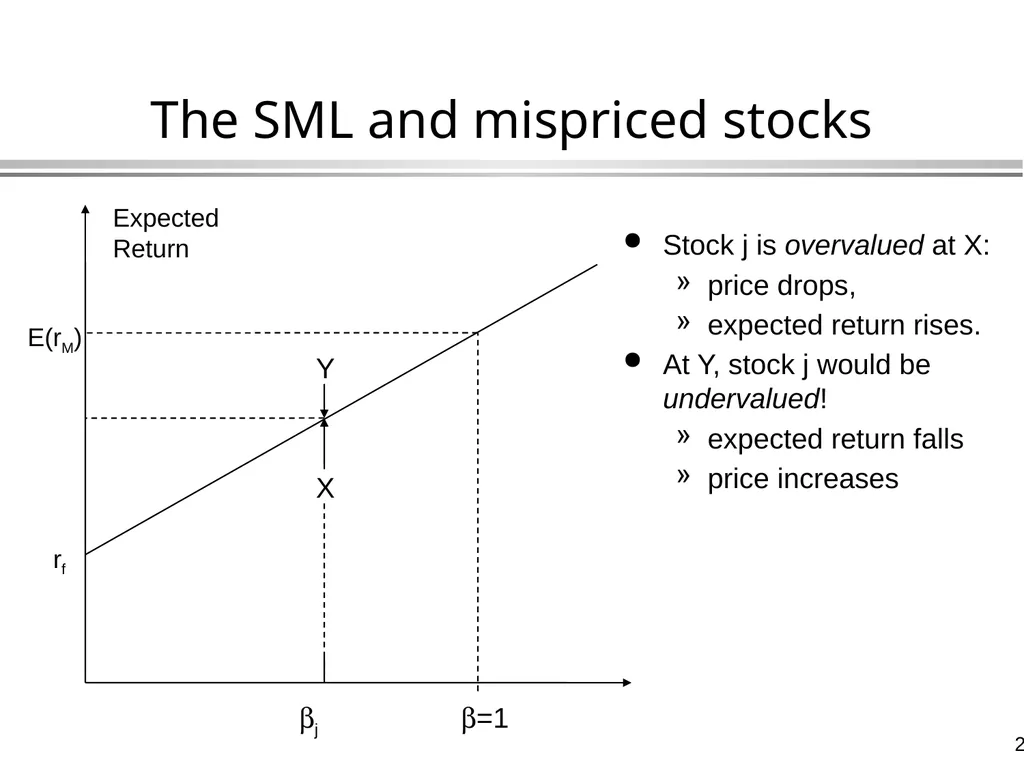
Stock j is overvalued at X:
price drops,
expected return rises.
At Y, stock j would be undervalued!
expected return falls
price increases Expected Return rf E(rM) b=1 bj X Y The SML and mispriced stocks<br>
price drops,
expected return rises.
At Y, stock j would be undervalued!
expected return falls
price increases Expected Return rf E(rM) b=1 bj X Y The SML and mispriced stocks<br>
21
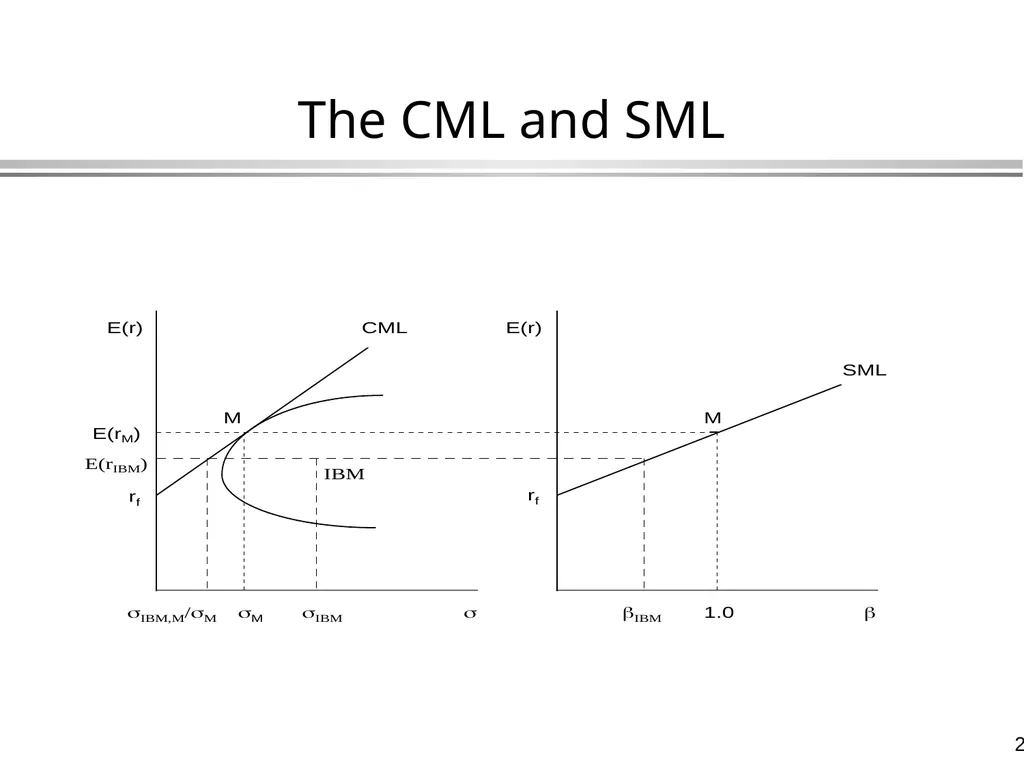
The CML and SML<br>
22
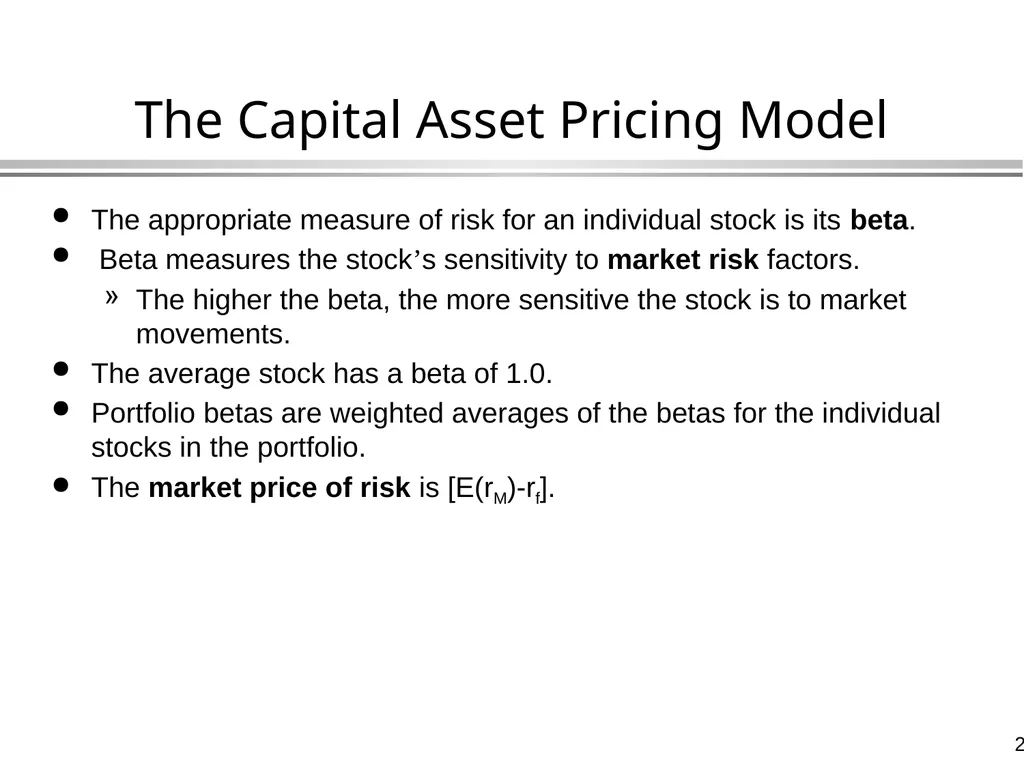
The Capital Asset Pricing Model The appropriate measure of risk for an individual stock is its beta.
Beta measures the stock’s sensitivity to market risk factors.
The higher the beta, the more sensitive the stock is to market movements.
The average stock has a beta of 1.0.
Portfolio betas are weighted averages of the betas for the individual stocks in the portfolio.
The market price of risk is [E(rM)-rf].<br>
Beta measures the stock’s sensitivity to market risk factors.
The higher the beta, the more sensitive the stock is to market movements.
The average stock has a beta of 1.0.
Portfolio betas are weighted averages of the betas for the individual stocks in the portfolio.
The market price of risk is [E(rM)-rf].<br>
23
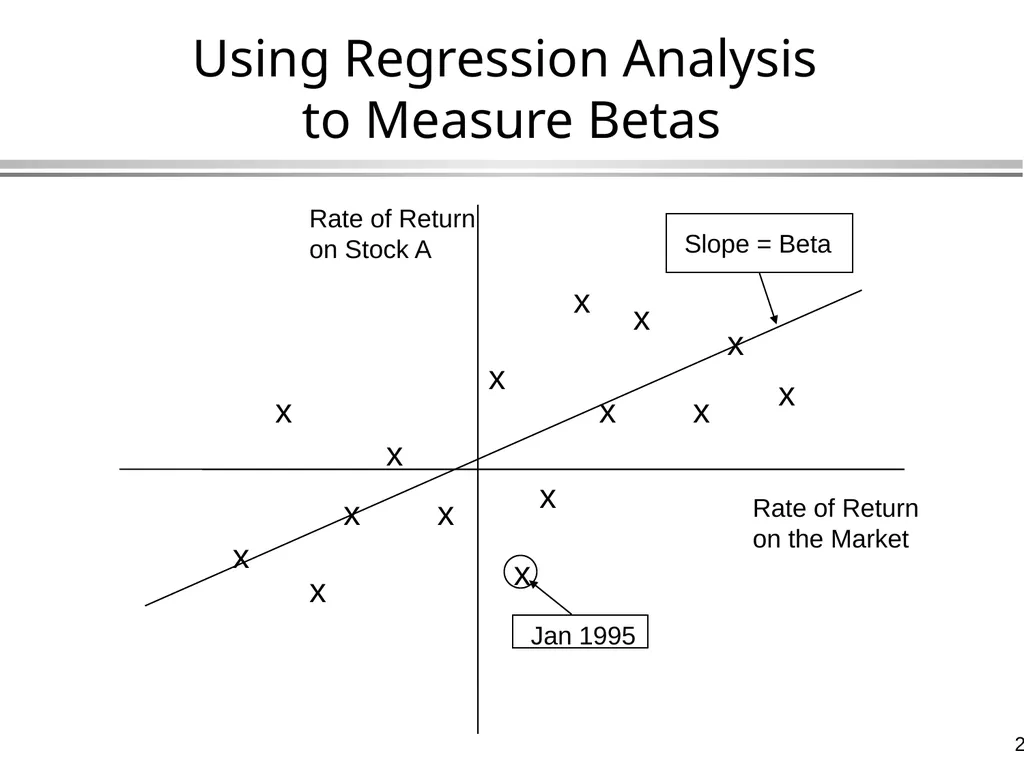
Using Regression Analysis
to Measure Betas Rate of Return on the Market Rate of Return on Stock A x x x x x x x x x x x x x x x Jan 1995 Slope = Beta<br>
24
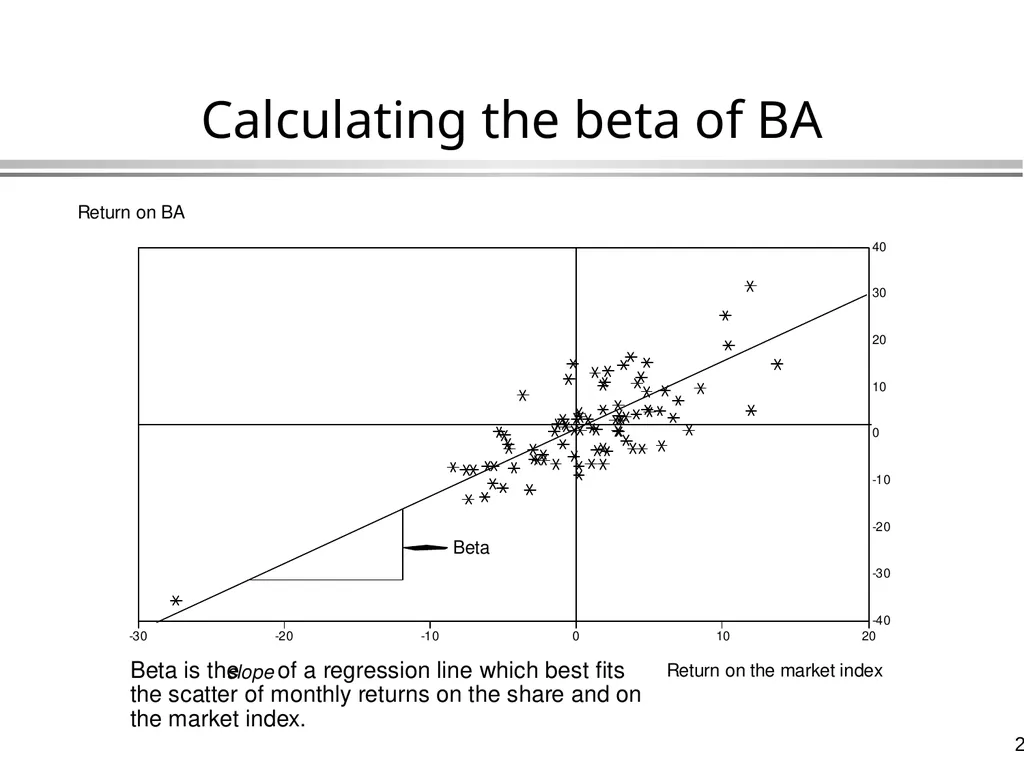
Calculating the beta of BA<br>
25
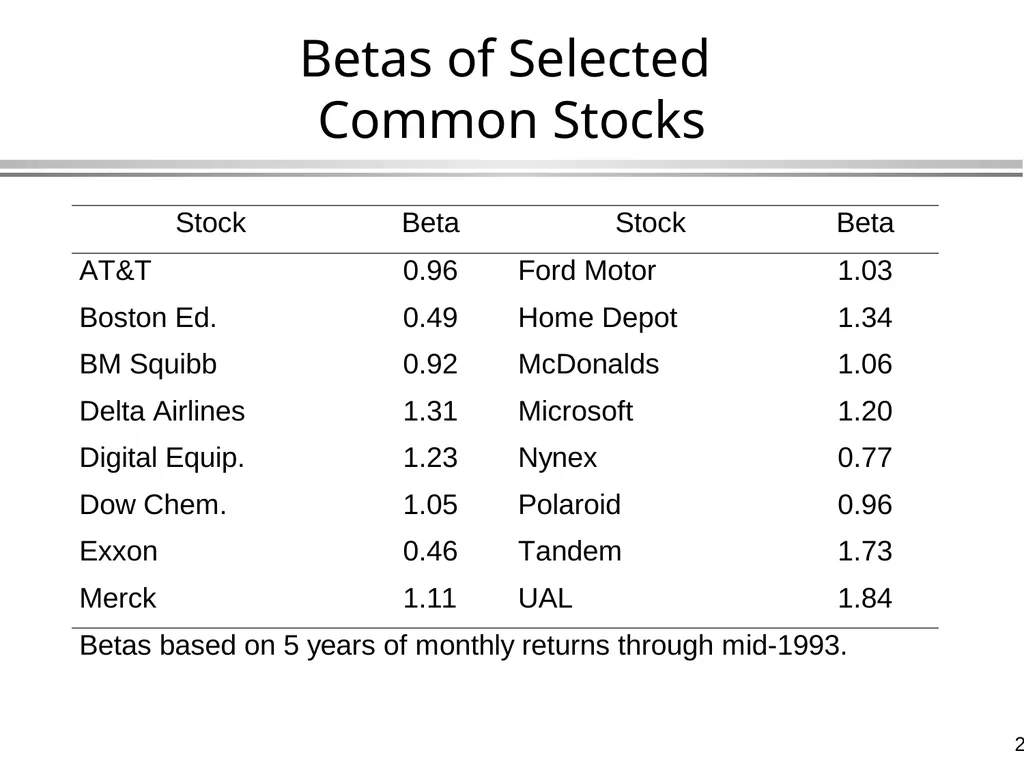
Betas of Selected
Common Stocks<br>
26
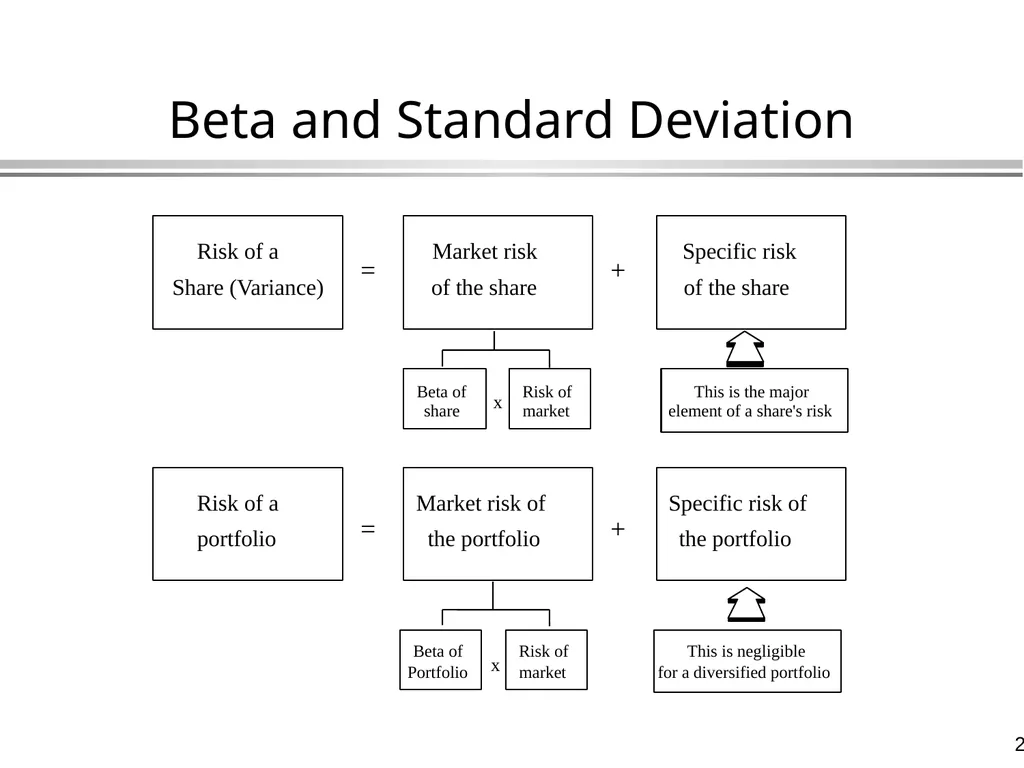
Beta and Standard Deviation Risk of a Share (Variance) Market risk Specific risk of the share of the share Risk of a portfolio Market risk of the portfolio Specific risk of the portfolio Beta of share Risk of market Beta of Portfolio Risk of market This is the major element of a share's risk This is negligible for a diversified portfolio = + x = + x<br>
27
Testing the CAPM
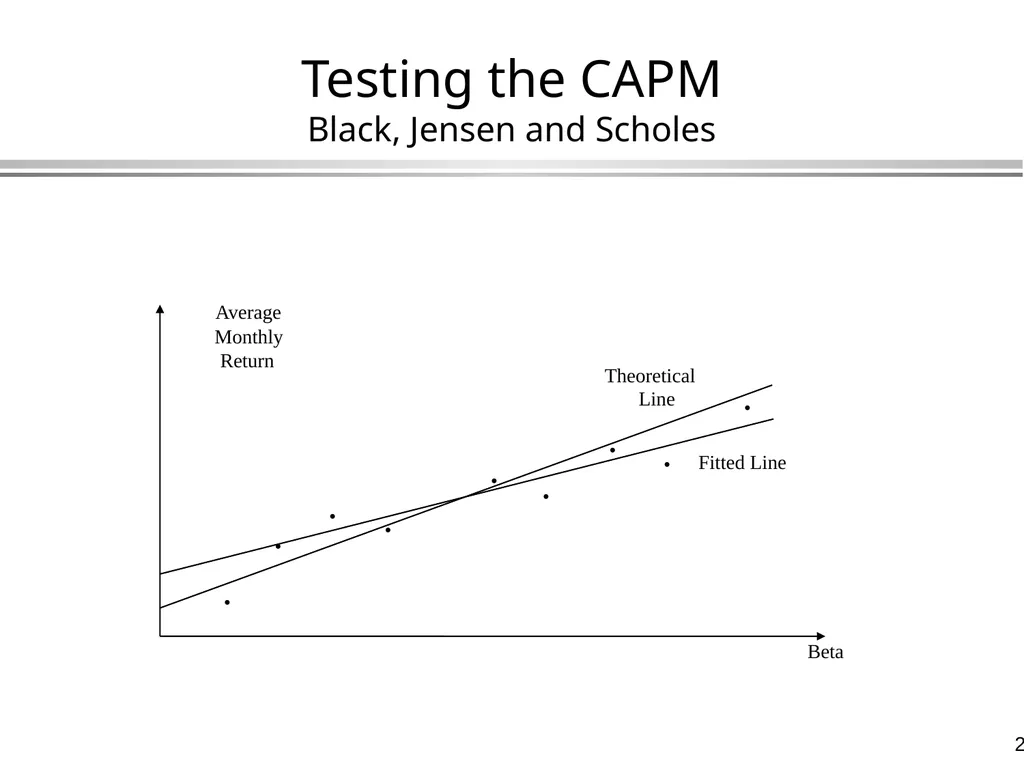
Black, Jensen and Scholes Fitted Line Theoretical Line Beta Average Monthly Return • • • • • • • • •<br>
28
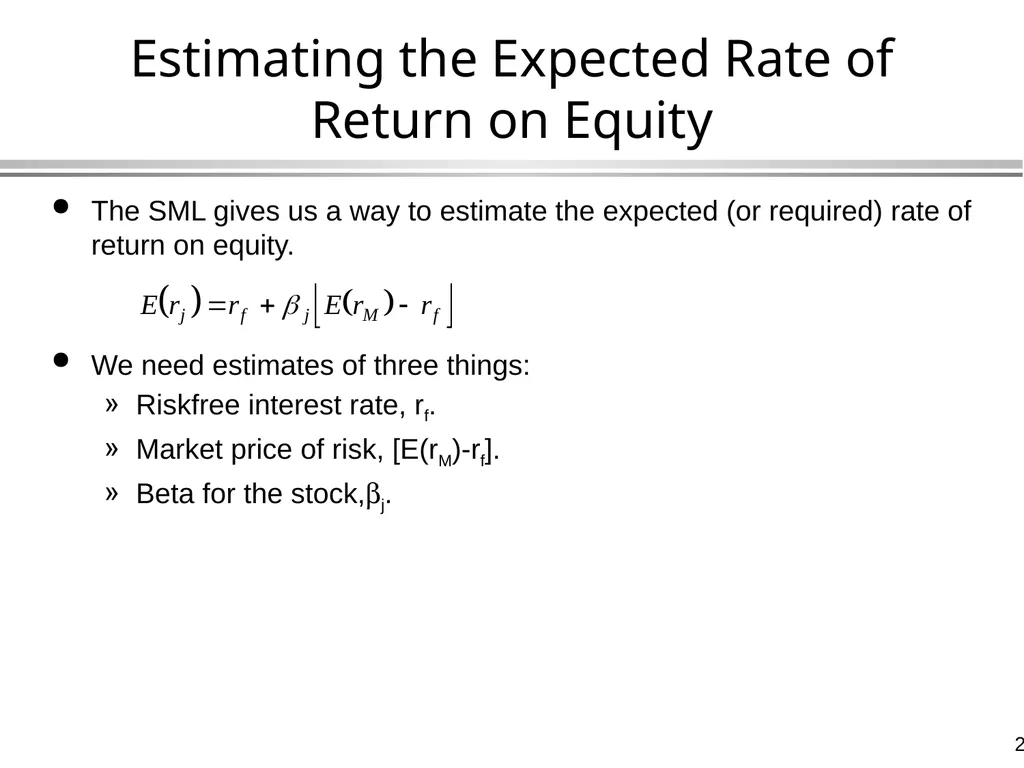
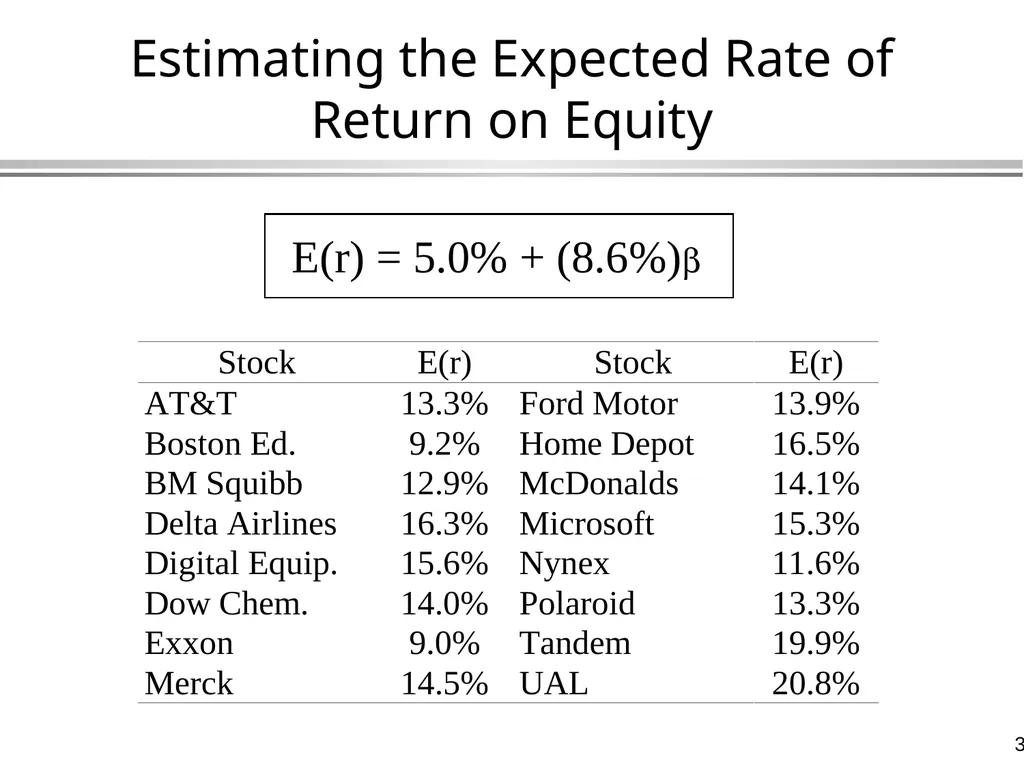
Estimating the Expected Rate of Return on Equity The SML gives us a way to estimate the expected (or required) rate of return on equity.
We need estimates of three things:
Riskfree interest rate, rf.
Market price of risk, [E(rM)-rf].
Beta for the stock,bj.<br>
We need estimates of three things:
Riskfree interest rate, rf.
Market price of risk, [E(rM)-rf].
Beta for the stock,bj.<br>
29
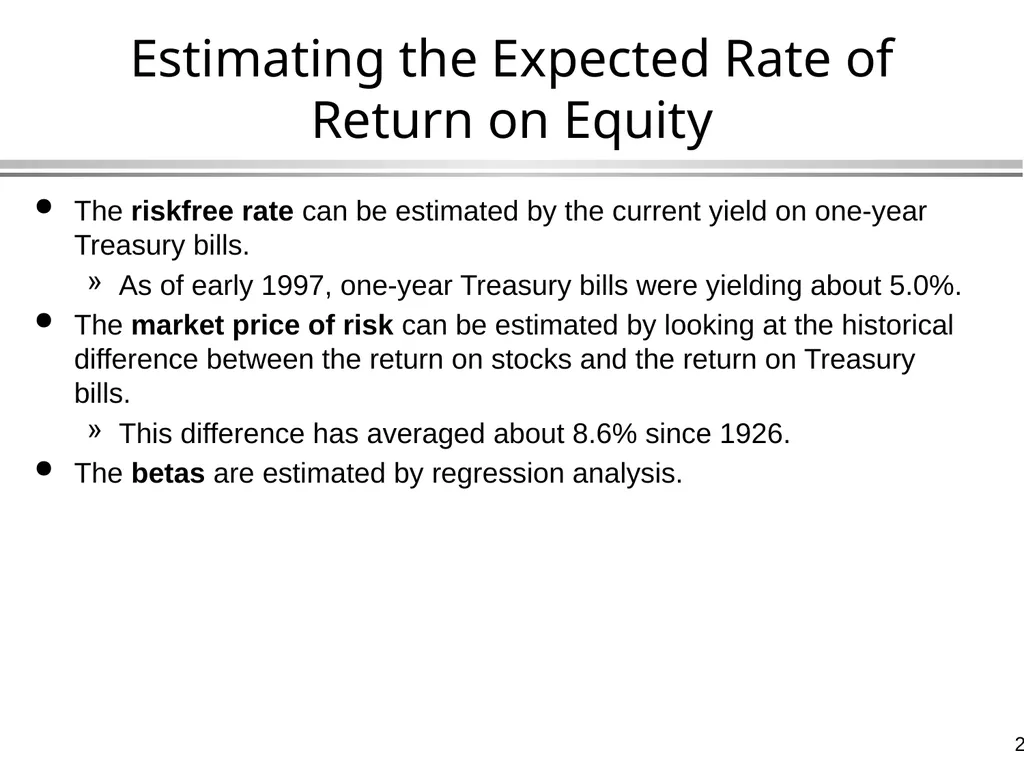
Estimating the Expected Rate of Return on Equity The riskfree rate can be estimated by the current yield on one-year Treasury bills.
As of early 1997, one-year Treasury bills were yielding about 5.0%.
The market price of risk can be estimated by looking at the historical difference between the return on stocks and the return on Treasury bills.
This difference has averaged about 8.6% since 1926.
The betas are estimated by regression analysis.<br>
As of early 1997, one-year Treasury bills were yielding about 5.0%.
The market price of risk can be estimated by looking at the historical difference between the return on stocks and the return on Treasury bills.
This difference has averaged about 8.6% since 1926.
The betas are estimated by regression analysis.<br>
30
Estimating the Expected Rate of Return on Equity E(r) = 5.0% + (8.6%)b<br>
31
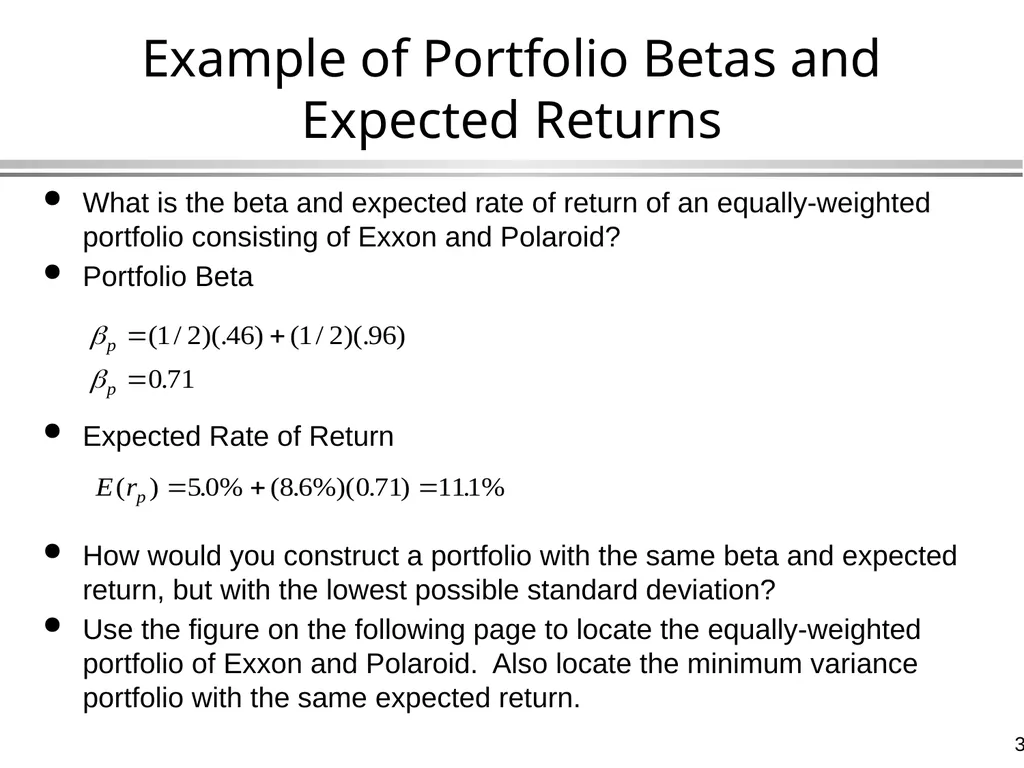
Example of Portfolio Betas and Expected Returns What is the beta and expected rate of return of an equally-weighted portfolio consisting of Exxon and Polaroid?
Portfolio Beta
Expected Rate of Return
How would you construct a portfolio with the same beta and expected return, but with the lowest possible standard deviation?
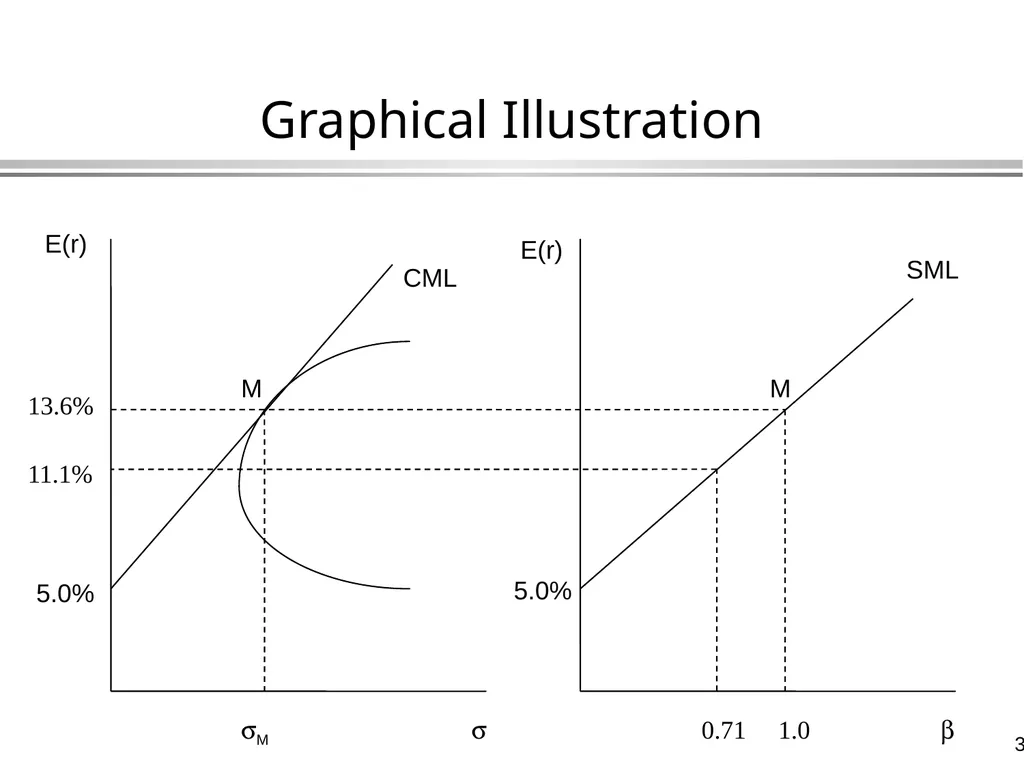
Use the figure on the following page to locate the equally-weighted portfolio of Exxon and Polaroid. Also locate the minimum variance portfolio with the same expected return.<br>
Portfolio Beta
Expected Rate of Return
How would you construct a portfolio with the same beta and expected return, but with the lowest possible standard deviation?
Use the figure on the following page to locate the equally-weighted portfolio of Exxon and Polaroid. Also locate the minimum variance portfolio with the same expected return.<br>
32
Graphical Illustration E(r) s b E(r) 5.0% M sM 5.0% CML SML 1.0 M 0.71 13.6% 11.1%<br>
33
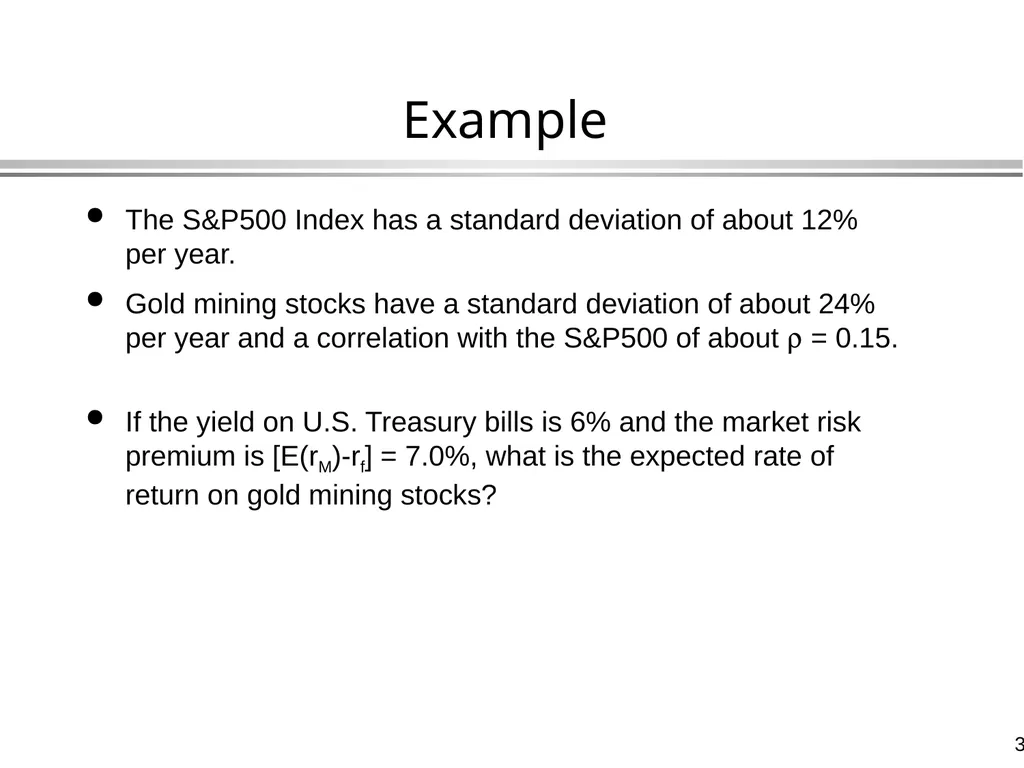
Example The S&P500 Index has a standard deviation of about 12% per year.
Gold mining stocks have a standard deviation of about 24% per year and a correlation with the S&P500 of about r = 0.15.
If the yield on U.S. Treasury bills is 6% and the market risk premium is [E(rM)-rf] = 7.0%, what is the expected rate of return on gold mining stocks?<br>
Gold mining stocks have a standard deviation of about 24% per year and a correlation with the S&P500 of about r = 0.15.
If the yield on U.S. Treasury bills is 6% and the market risk premium is [E(rM)-rf] = 7.0%, what is the expected rate of return on gold mining stocks?<br>
34
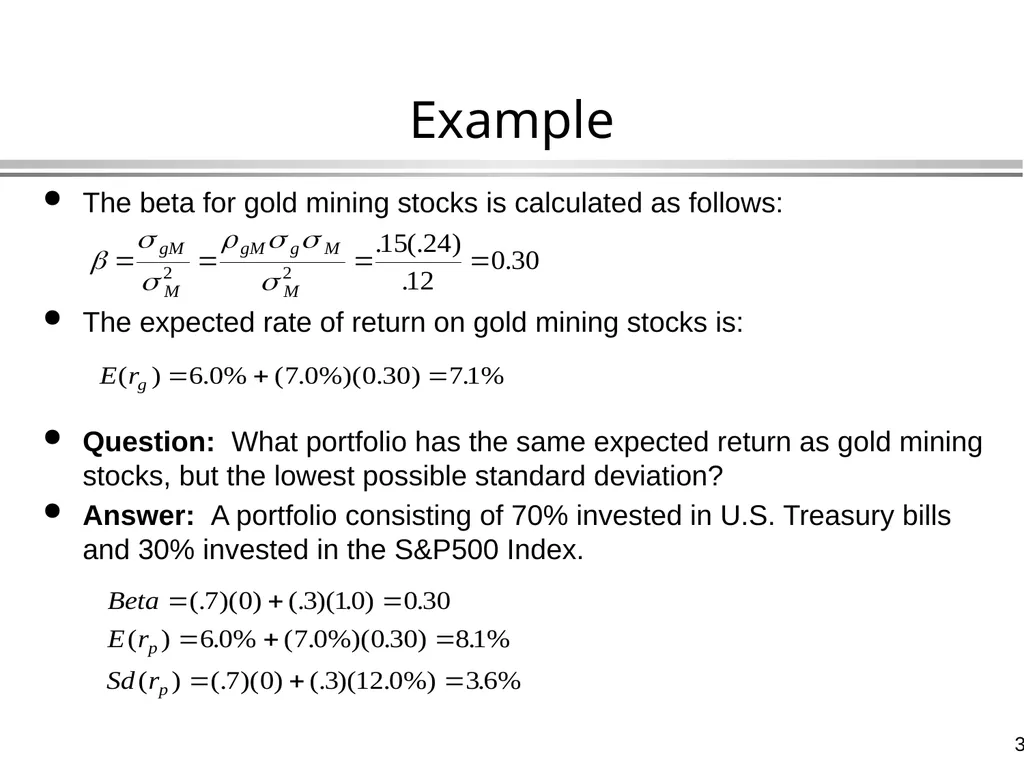
Example The beta for gold mining stocks is calculated as follows:
The expected rate of return on gold mining stocks is:
Question: What portfolio has the same expected return as gold mining stocks, but the lowest possible standard deviation?
Answer: A portfolio consisting of 70% invested in U.S. Treasury bills and 30% invested in the S&P500 Index.<br>
The expected rate of return on gold mining stocks is:
Question: What portfolio has the same expected return as gold mining stocks, but the lowest possible standard deviation?
Answer: A portfolio consisting of 70% invested in U.S. Treasury bills and 30% invested in the S&P500 Index.<br>
35
Using the CAPM for
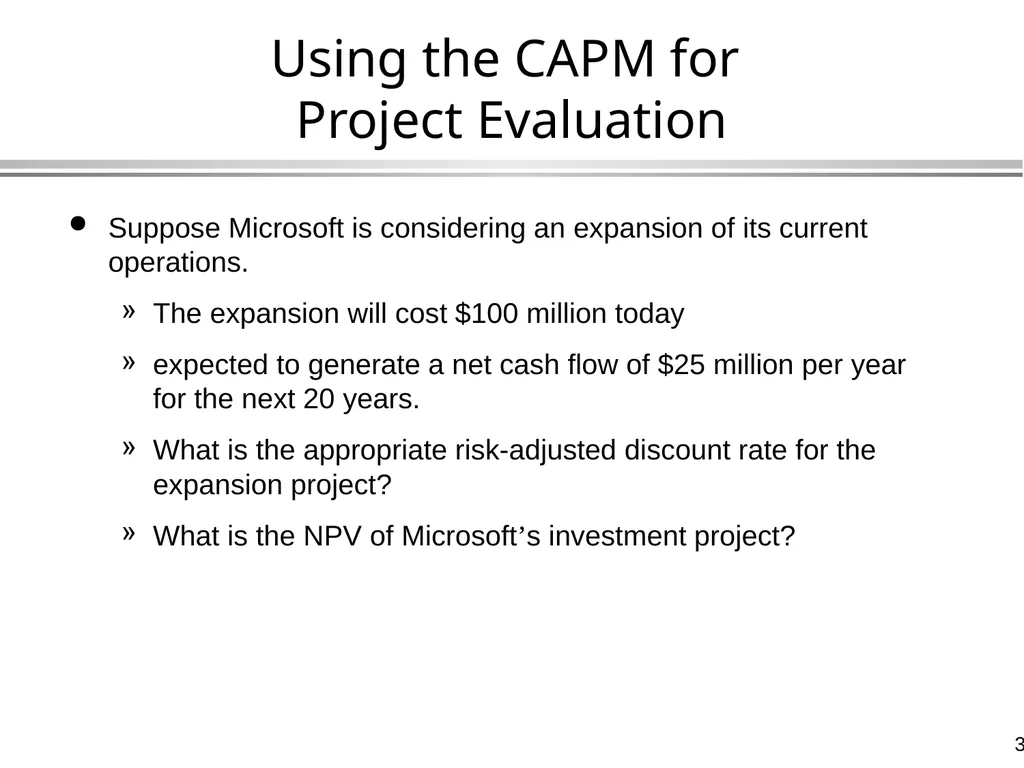
Project Evaluation Suppose Microsoft is considering an expansion of its current operations.
The expansion will cost $100 million today
expected to generate a net cash flow of $25 million per year for the next 20 years.
What is the appropriate risk-adjusted discount rate for the expansion project?
What is the NPV of Microsoft’s investment project?<br>
The expansion will cost $100 million today
expected to generate a net cash flow of $25 million per year for the next 20 years.
What is the appropriate risk-adjusted discount rate for the expansion project?
What is the NPV of Microsoft’s investment project?<br>
36
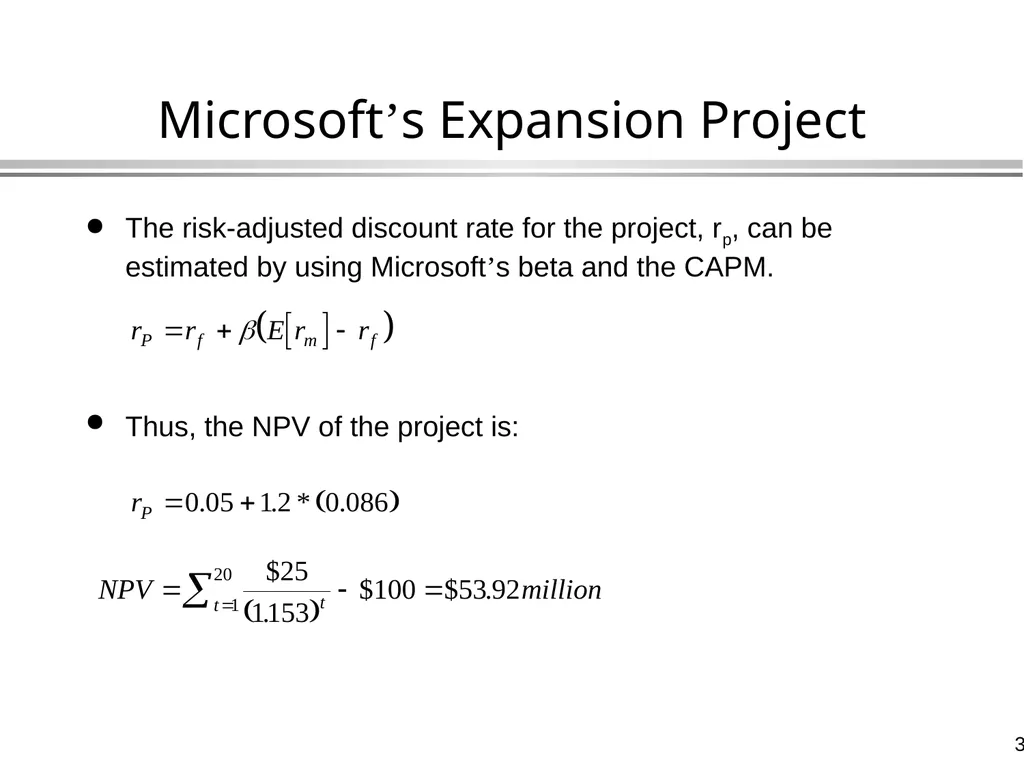
Microsoft’s Expansion Project The risk-adjusted discount rate for the project, rp, can be estimated by using Microsoft’s beta and the CAPM.
Thus, the NPV of the project is:<br>
Thus, the NPV of the project is:<br>
37
Company Risk Versus
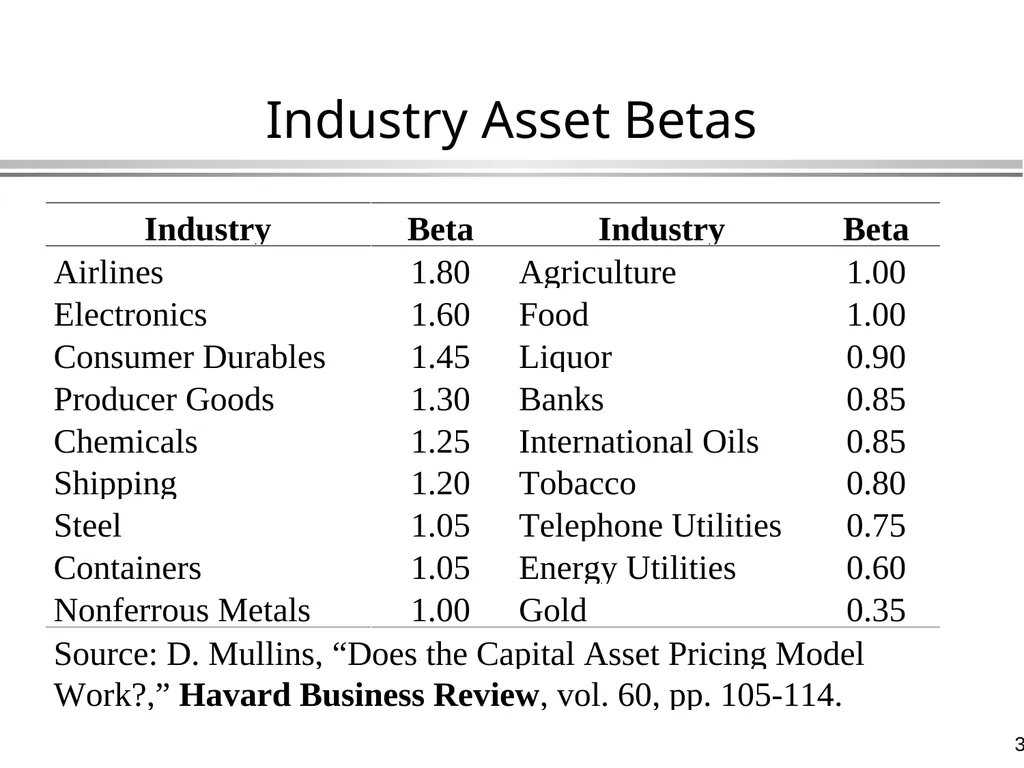
Project Risk The company-wide discount rate is the appropriate discount rate for evaluating investment projects that have the same risk as the firm as a whole.
For investment projects that have different risk from the firm’s existing assets, the company-wide discount rate is not the appropriate discount rate.
In these cases, we must rely on industry betas for estimates of project risk.<br>
For investment projects that have different risk from the firm’s existing assets, the company-wide discount rate is not the appropriate discount rate.
In these cases, we must rely on industry betas for estimates of project risk.<br>
38
Company Risk versus
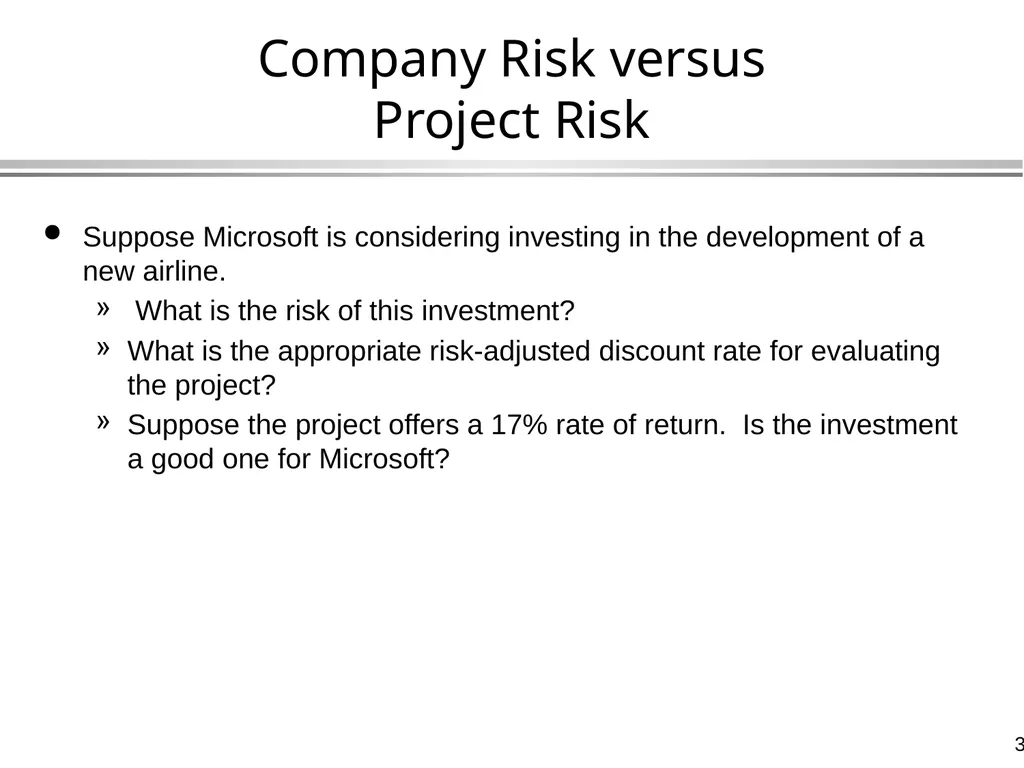
Project Risk Suppose Microsoft is considering investing in the development of a new airline.
What is the risk of this investment?
What is the appropriate risk-adjusted discount rate for evaluating the project?
Suppose the project offers a 17% rate of return. Is the investment a good one for Microsoft?<br>
What is the risk of this investment?
What is the appropriate risk-adjusted discount rate for evaluating the project?
Suppose the project offers a 17% rate of return. Is the investment a good one for Microsoft?<br>
39
Industry Asset Betas<br>
40
Company Risk versus
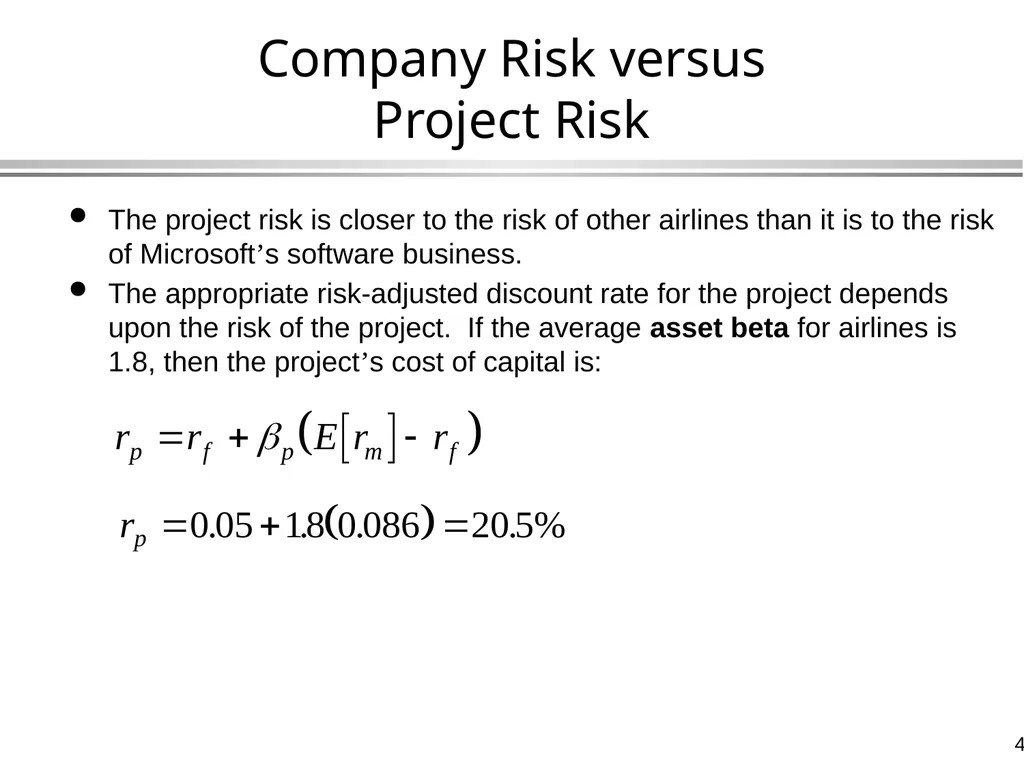
Project Risk The project risk is closer to the risk of other airlines than it is to the risk of Microsoft’s software business.
The appropriate risk-adjusted discount rate for the project depends upon the risk of the project. If the average asset beta for airlines is 1.8, then the project’s cost of capital is:<br>
The appropriate risk-adjusted discount rate for the project depends upon the risk of the project. If the average asset beta for airlines is 1.8, then the project’s cost of capital is:<br>
41
Company Risk versus
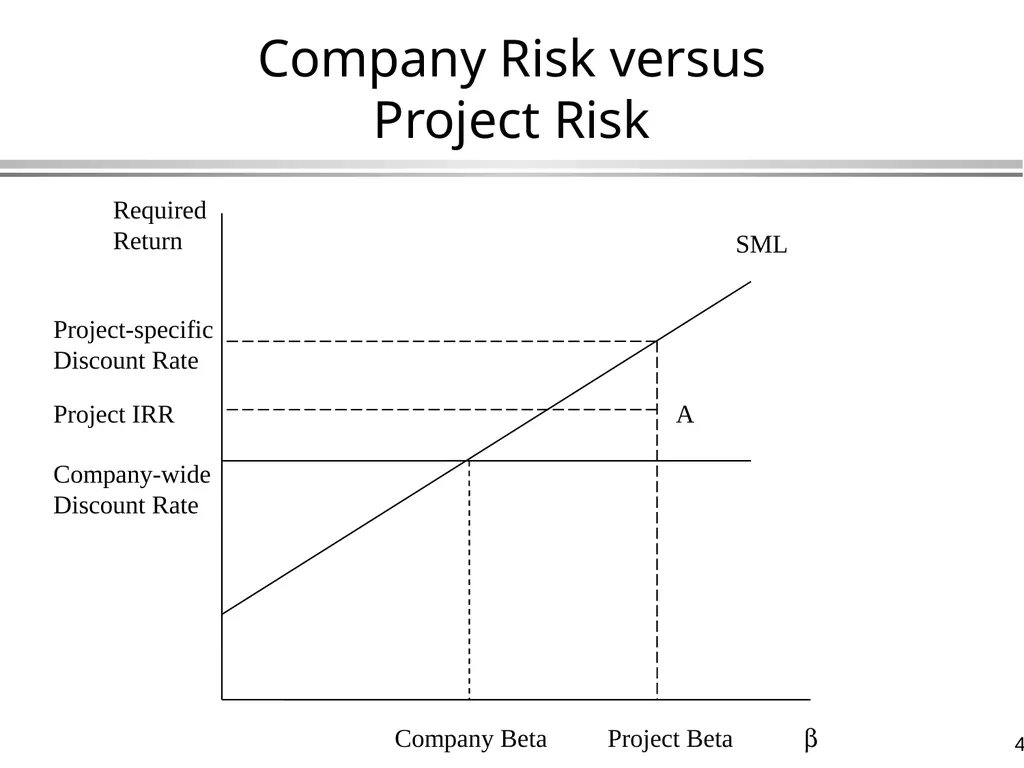
Project Risk Required Return b SML Company Beta Company-wide Discount Rate A Project Beta Project IRR Project-specific Discount Rate<br>
42
Project Evaluation: Rules The risk of an investment project is given by the project’s beta.
Can be different from company’s beta
Can often use industry as approximation
The Security Market Line provides an estimate of an appropriate discount rate for the project based upon the project’s beta.
Same company may use different discount rates for different projects
This discount rate is used when computing the project’s net present value.<br>
Can be different from company’s beta
Can often use industry as approximation
The Security Market Line provides an estimate of an appropriate discount rate for the project based upon the project’s beta.
Same company may use different discount rates for different projects
This discount rate is used when computing the project’s net present value.<br>
43
Summary Optimal investments depend on trading off risk and return
Investors with higher risk tolerance invest more in risky assets
Only risk that can’t be diversified counts
If investors can borrow and lend, then everybody holds a combination of two portfolios
The market portfolio of all risky assets
The riskless asset
Covariance with the market portfolio counts
In equilibrium, all stocks must lie on the security market line
Beta measures the amount of nondiversifiable risk
Expected returns reflect only market risk
Use these as required returns in project evaluation<br>
Investors with higher risk tolerance invest more in risky assets
Only risk that can’t be diversified counts
If investors can borrow and lend, then everybody holds a combination of two portfolios
The market portfolio of all risky assets
The riskless asset
Covariance with the market portfolio counts
In equilibrium, all stocks must lie on the security market line
Beta measures the amount of nondiversifiable risk
Expected returns reflect only market risk
Use these as required returns in project evaluation<br>