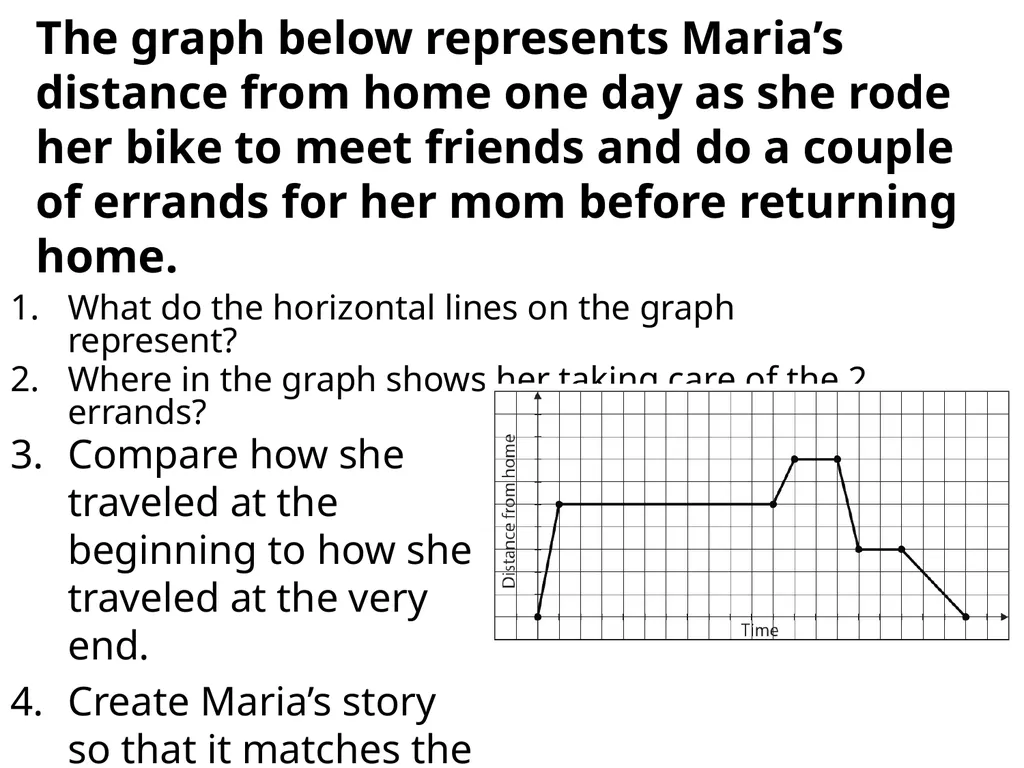
The graph below represents Marias distance from home one day as she rode her bike to meet friends and do a couple of errands for her mom before returning home. What do the horizontal lines on the graph represent? Where in the graph shows
"The graph below represents Maria’s distance from" is the property of its rightful owner. Permission is granted to
download and print the materials on this website for personal, non-commercial use only, and to display it
on your personal computer provided you do not modify the materials and that you retain all copyright
notices contained in the materials. By downloading content from our website, you accept the terms of this
agreement.
Presentation Transcript
01
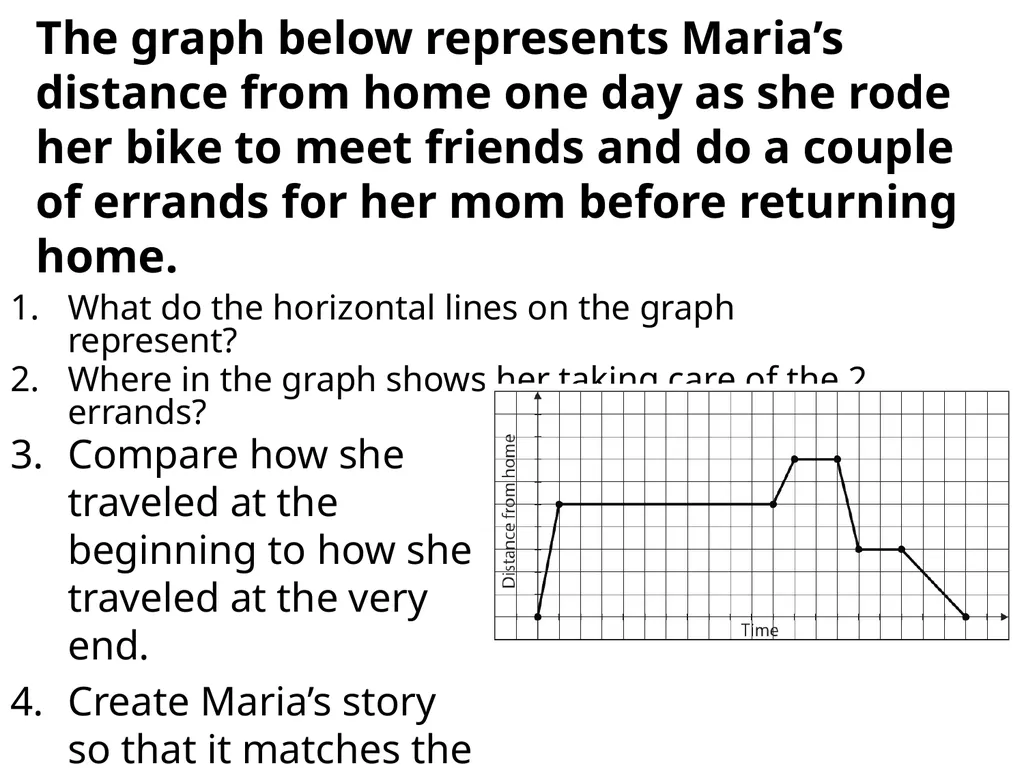
The graph below represents Maria’s distance from home one day as she rode her bike to meet friends and do a couple of errands for her mom before returning home. What do the horizontal lines on the graph represent?
Where in the graph shows her taking care of the 2 errands? Compare how she traveled at the beginning to how she traveled at the very end.
Create Maria’s story so that it matches the graph.<br>
02
MCC9-12.F.IF.4 (p. 51) For a function that models a relationship between two quantities, interpret key features of graphs and tables in terms of the quantities, and sketch graphs showing key features given a verbal description of the relationship. Key features include: intercepts; intervals where the function is increasing, decreasing, positive, or negative; relative maximums and minimums; symmetries; end behavior.<br>
03
Characteristics of Functions<br>
04
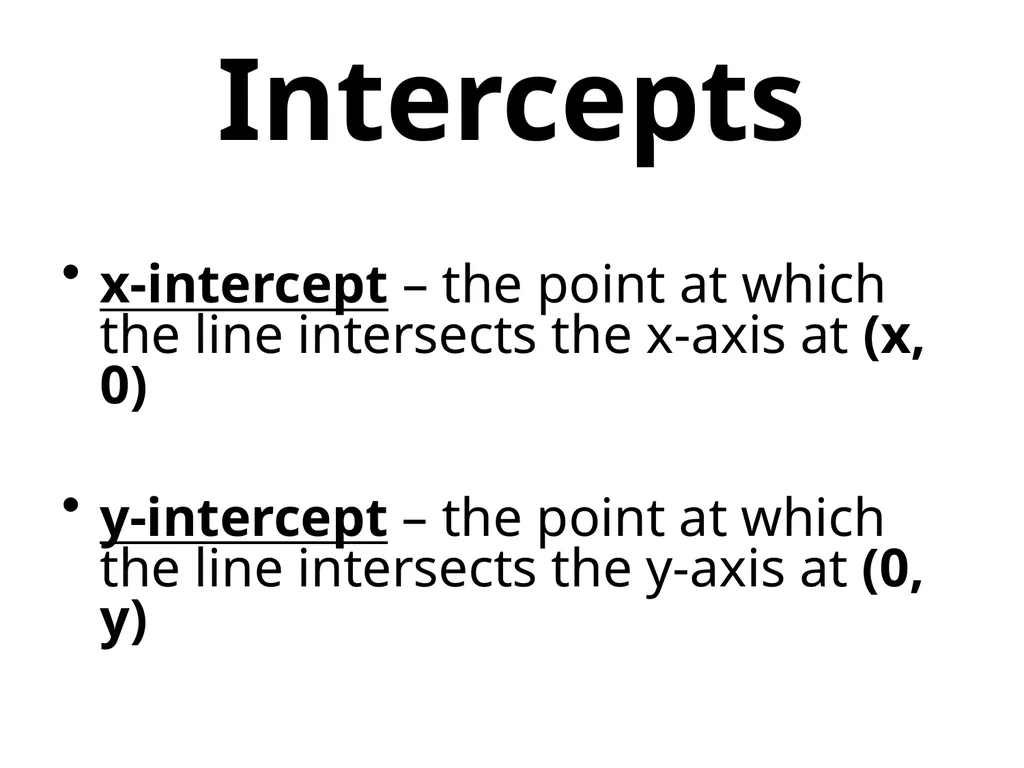
Intercepts x-intercept – the point at which the line intersects the x-axis at (x, 0)
y-intercept – the point at which the line intersects the y-axis at (0, y)<br>
05
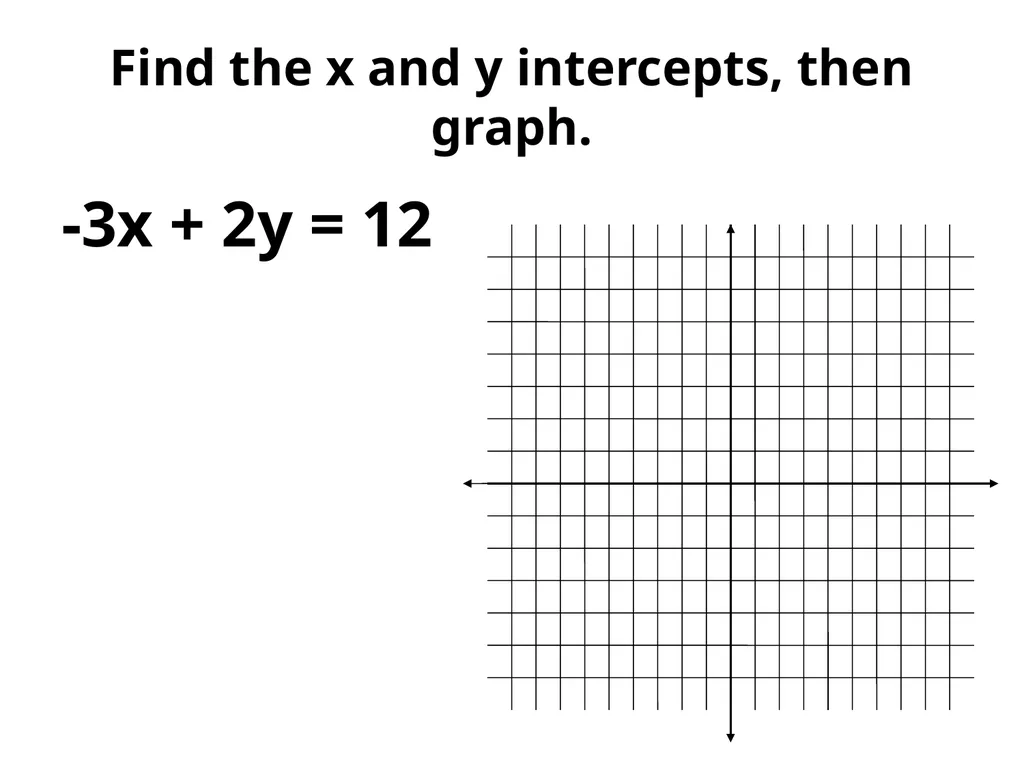
Find the x and y intercepts, then graph. -3x + 2y = 12<br>
06
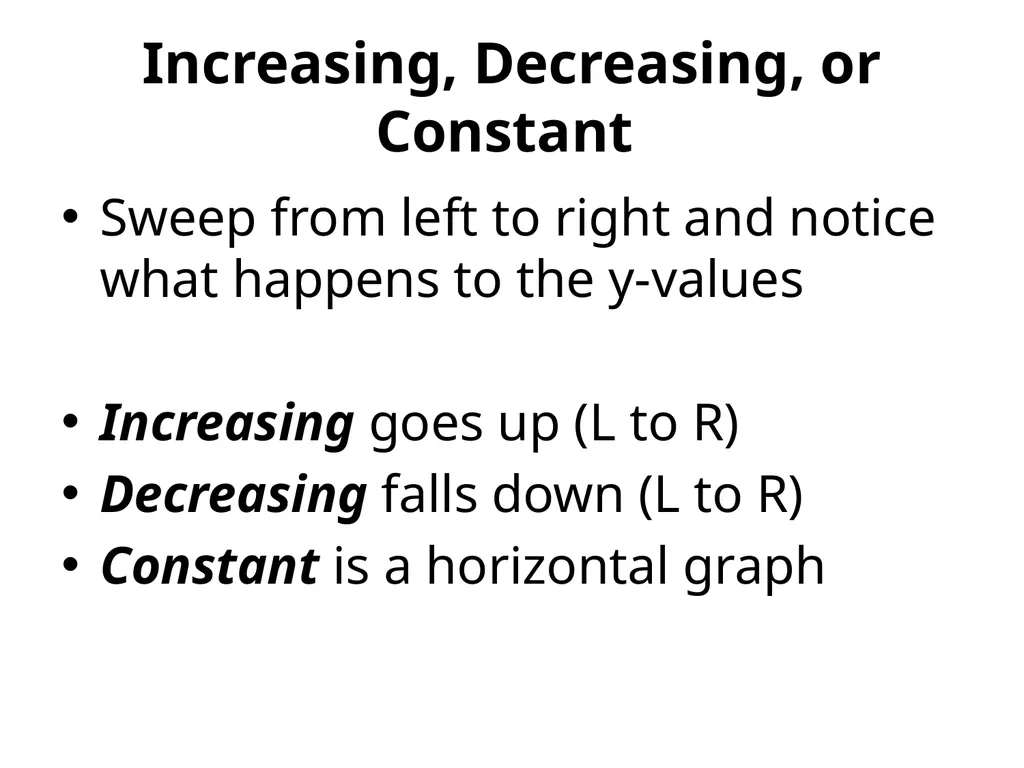
Increasing, Decreasing, or Constant Sweep from left to right and notice what happens to the y-values
Increasing goes up (L to R)
Decreasing falls down (L to R)
Constant is a horizontal graph<br>
07
Continuous vs Discrete Continuous has NO breaks
Discrete has gaps or breaks<br>
08
Extrema Maximum Point – greatest value of the function
Minimum Point – least value of the function<br>
09
Domain & Range Domain – all x-values of a function
Range – all y-values of a function<br>
10
Notation Interval – represents an interval as a pair of numbers. The numbers are the endpoints of the interval. Parentheses and/or brackets are used to show whether the endpoints are excluded or included
Set – using inequalities to describe the values<br>
11
Asymptote A line that a graph gets closer and closer to, but never crosses or touches<br>
12
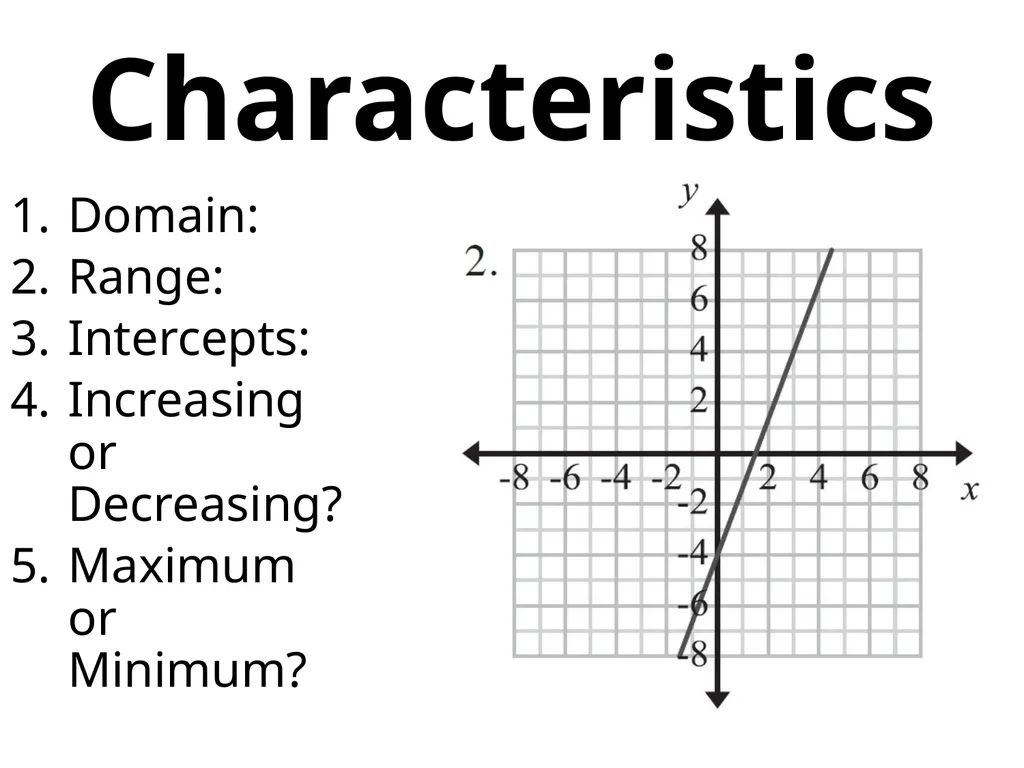
Characteristics Domain:
Range:
Intercepts:
Increasing or Decreasing?
Maximum or Minimum?<br>
13
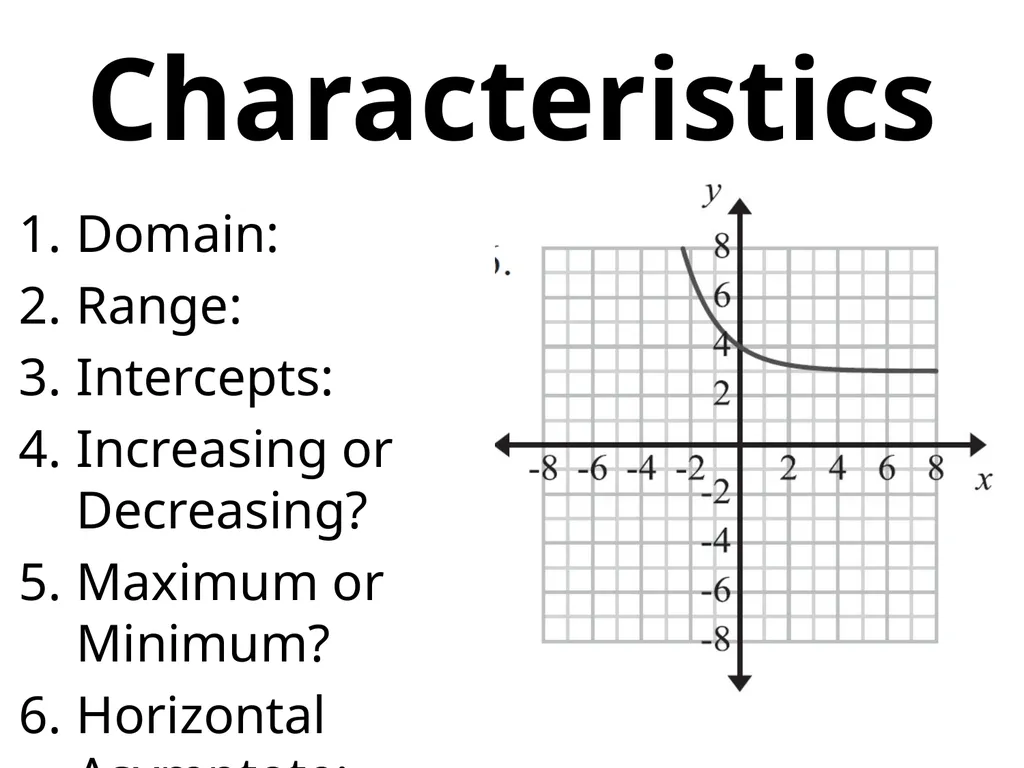
Characteristics Domain:
Range:
Intercepts:
Increasing or Decreasing?
Maximum or Minimum?
Horizontal Asymptote:<br>
14
Classwork Characteristics of Functions
Worksheet 5 problems<br>
15
Homework Characteristics of Functions
Worksheet 6 problems<br>