
The Implementation of House Bill 22 Collaborating
CS
Published · 48 slides · 0 views

1 / 1
Description
The Implementation of House Bill 22 Collaborating to Build a Better accountability system House Bill 22, 85th Texas Legislature The commissioner shall evaluate school district and campus performance and assign each district and campus an
Related Topics
Share
Embed code
Download this presentation From Below
"The Implementation of House Bill 22 Collaborating" is the property of its rightful owner. Permission is granted to download and print the materials on this website for personal, non-commercial use only, and to display it on your personal computer provided you do not modify the materials and that you retain all copyright notices contained in the materials. By downloading content from our website, you accept the terms of this agreement.
Presentation Transcript
01
The Implementation of House Bill 22 Collaborating to Build a Better accountability system<br>
02
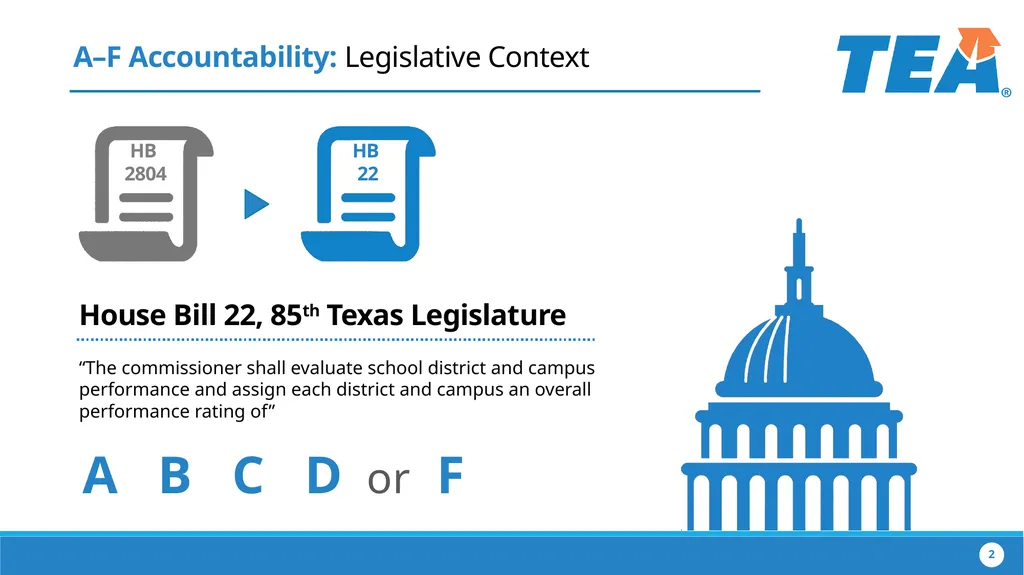
House Bill 22, 85th Texas Legislature “The commissioner shall evaluate school district and campus performance and assign each district and campus an overall performance rating of” A–F Accountability: Legislative Context A B C D or F HB
2804 HB
22 2<br>
2804 HB
22 2<br>
03
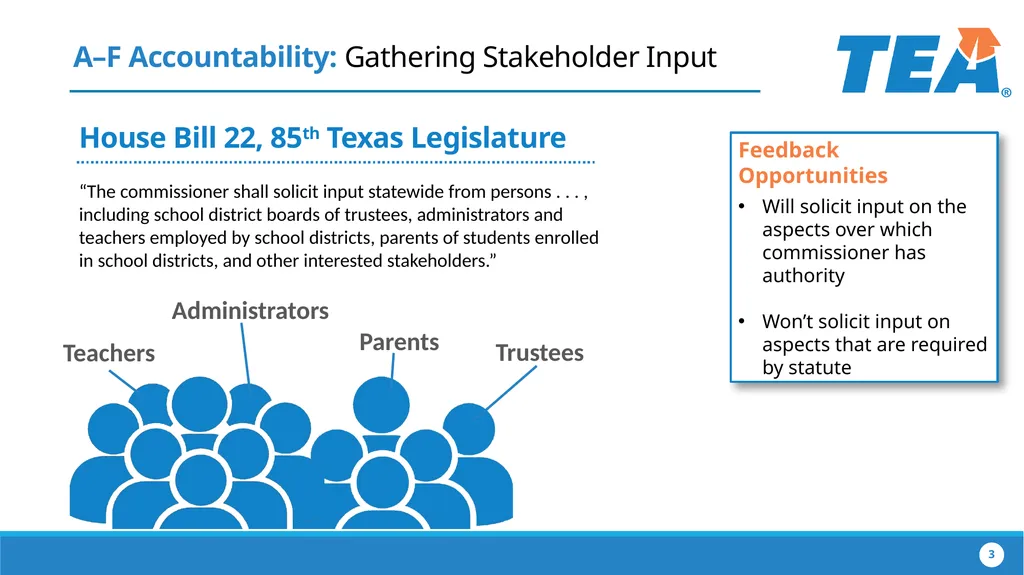
House Bill 22, 85th Texas Legislature “The commissioner shall solicit input statewide from persons . . . , including school district boards of trustees, administrators and teachers employed by school districts, parents of students enrolled in school districts, and other interested stakeholders.” A–F Accountability: Gathering Stakeholder Input 3 Feedback Opportunities
Will solicit input on the aspects over which commissioner has authority
Won’t solicit input on aspects that are required by statute Trustees Parents Administrators Teachers<br>
Will solicit input on the aspects over which commissioner has authority
Won’t solicit input on aspects that are required by statute Trustees Parents Administrators Teachers<br>
04
Closing
The Gaps School
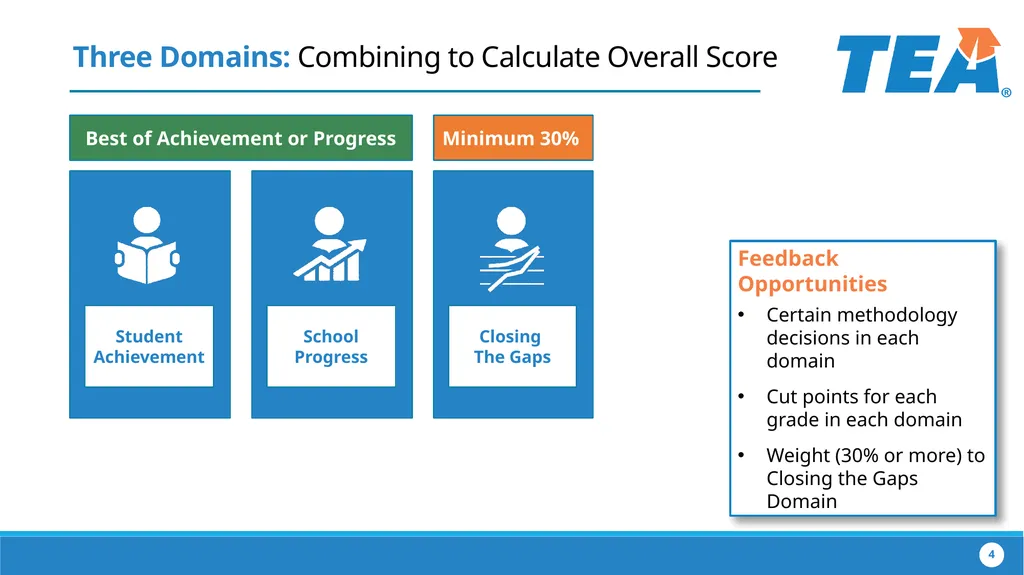
Progress Student Achievement Best of Achievement or Progress Minimum 30% Three Domains: Combining to Calculate Overall Score 4 4 Feedback Opportunities
Certain methodology decisions in each domain
Cut points for each grade in each domain
Weight (30% or more) to Closing the Gaps Domain<br>
The Gaps School
Progress Student Achievement Best of Achievement or Progress Minimum 30% Three Domains: Combining to Calculate Overall Score 4 4 Feedback Opportunities
Certain methodology decisions in each domain
Cut points for each grade in each domain
Weight (30% or more) to Closing the Gaps Domain<br>
05
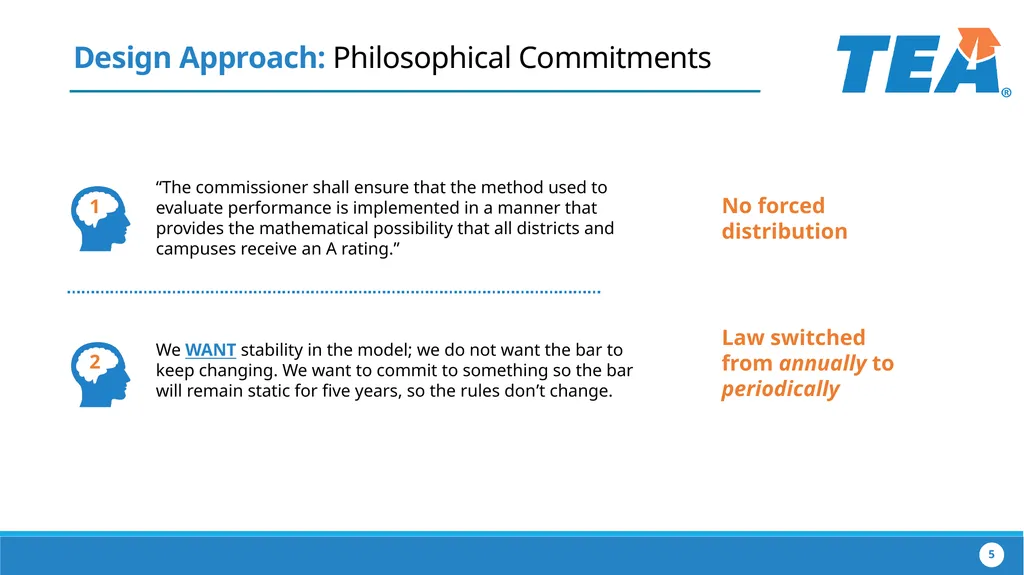
“The commissioner shall ensure that the method used to evaluate performance is implemented in a manner that provides the mathematical possibility that all districts and campuses receive an A rating.” We WANT stability in the model; we do not want the bar to
keep changing. We want to commit to something so the bar will remain static for five years, so the rules don’t change. Design Approach: Philosophical Commitments No forced distribution Law switched from annually to periodically 5<br>
keep changing. We want to commit to something so the bar will remain static for five years, so the rules don’t change. Design Approach: Philosophical Commitments No forced distribution Law switched from annually to periodically 5<br>
06
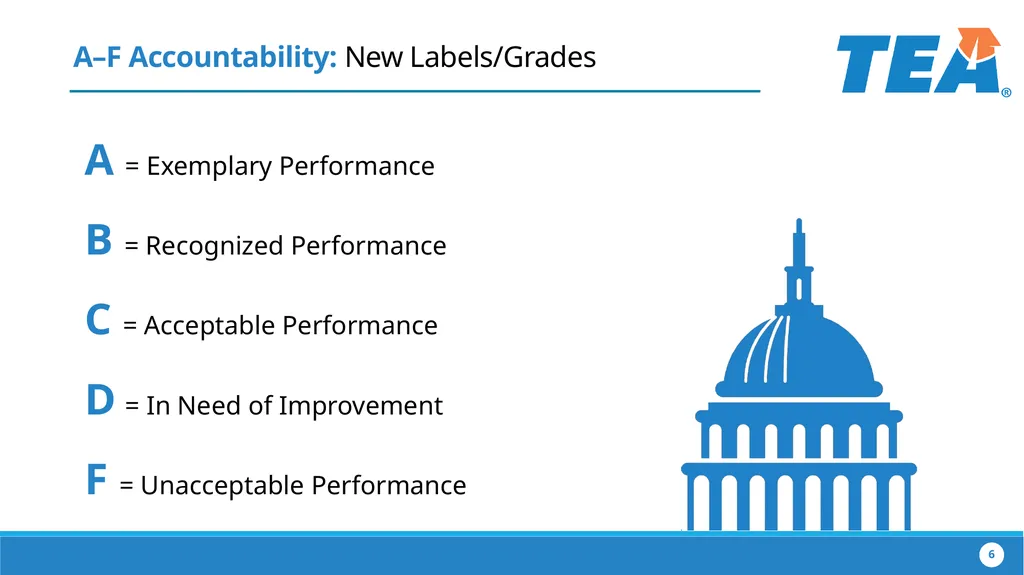
A–F Accountability: New Labels/Grades A = Exemplary Performance
B = Recognized Performance
C = Acceptable Performance
D = In Need of Improvement
F = Unacceptable Performance 6<br>
B = Recognized Performance
C = Acceptable Performance
D = In Need of Improvement
F = Unacceptable Performance 6<br>
07
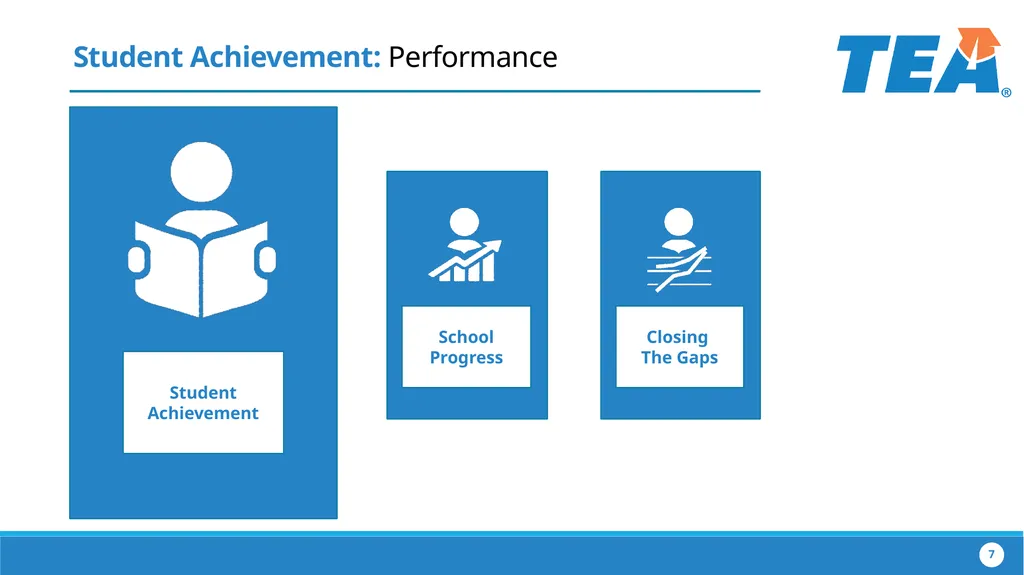
Approaches or Above Meets or Above Masters Student Achievement: Performance 7 7 Student Achievement Closing
The Gaps School
Progress<br>
The Gaps School
Progress<br>
08
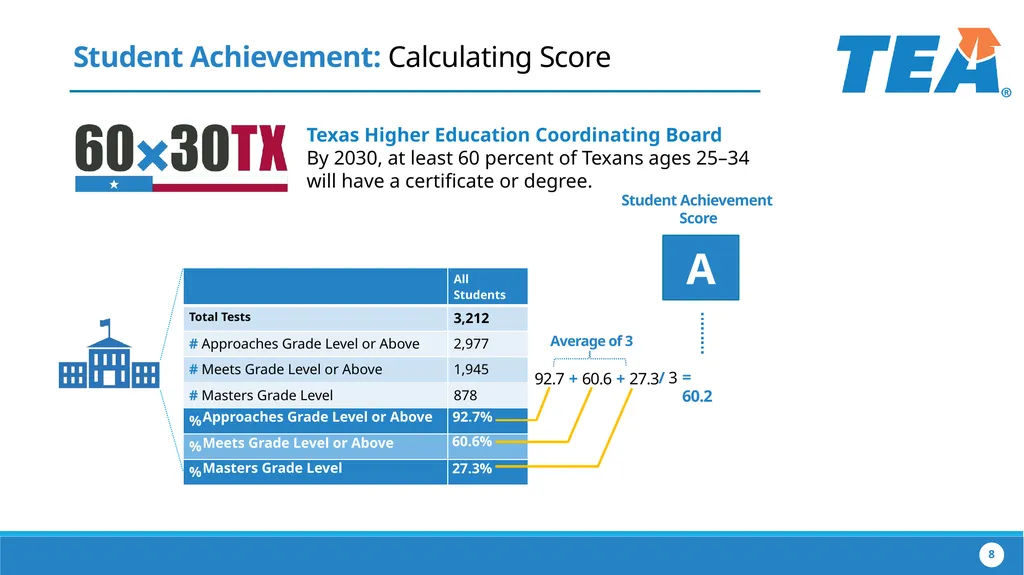
/ 3 Student Achievement Score = 60.2 A Approaches Grade Level or Above Meets Grade Level or Above Masters Grade Level 92.7% 60.6% 27.3% Student Achievement: Calculating Score 8 8 Texas Higher Education Coordinating Board
By 2030, at least 60 percent of Texans ages 25–34 will have a certificate or degree.<br>
By 2030, at least 60 percent of Texans ages 25–34 will have a certificate or degree.<br>
09
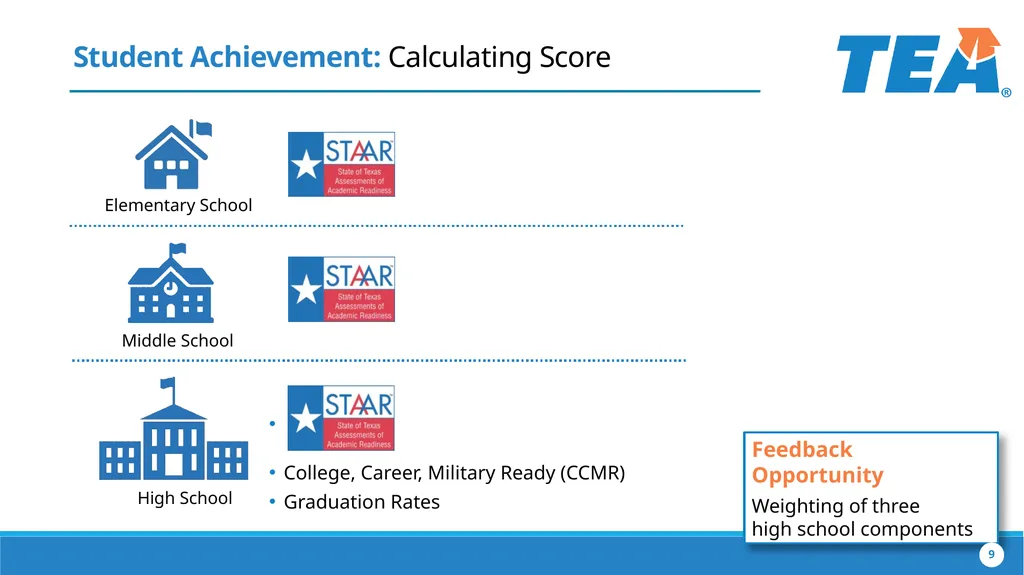
Student Achievement: Calculating Score College, Career, Military Ready (CCMR)
Graduation Rates Elementary School Middle School High School Feedback Opportunity
Weighting of three high school components 9<br>
Graduation Rates Elementary School Middle School High School Feedback Opportunity
Weighting of three high school components 9<br>
10
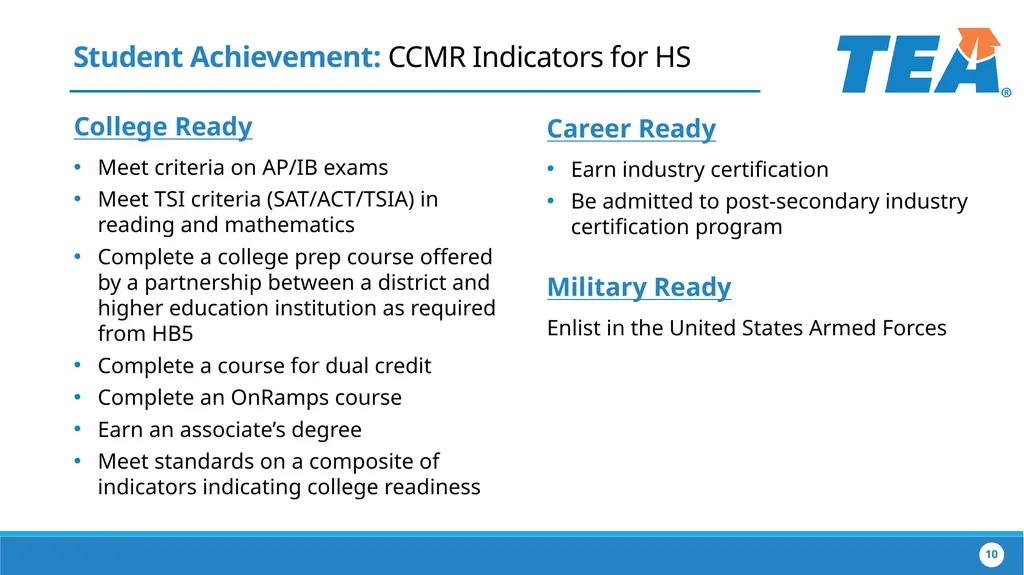
Student Achievement: CCMR Indicators for HS College Ready
Meet criteria on AP/IB exams
Meet TSI criteria (SAT/ACT/TSIA) in reading and mathematics
Complete a college prep course offered by a partnership between a district and higher education institution as required from HB5
Complete a course for dual credit
Complete an OnRamps course
Earn an associate’s degree
Meet standards on a composite of indicators indicating college readiness Career Ready
Earn industry certification
Be admitted to post-secondary industry certification program
Military Ready
Enlist in the United States Armed Forces 10<br>
Meet criteria on AP/IB exams
Meet TSI criteria (SAT/ACT/TSIA) in reading and mathematics
Complete a college prep course offered by a partnership between a district and higher education institution as required from HB5
Complete a course for dual credit
Complete an OnRamps course
Earn an associate’s degree
Meet standards on a composite of indicators indicating college readiness Career Ready
Earn industry certification
Be admitted to post-secondary industry certification program
Military Ready
Enlist in the United States Armed Forces 10<br>
11
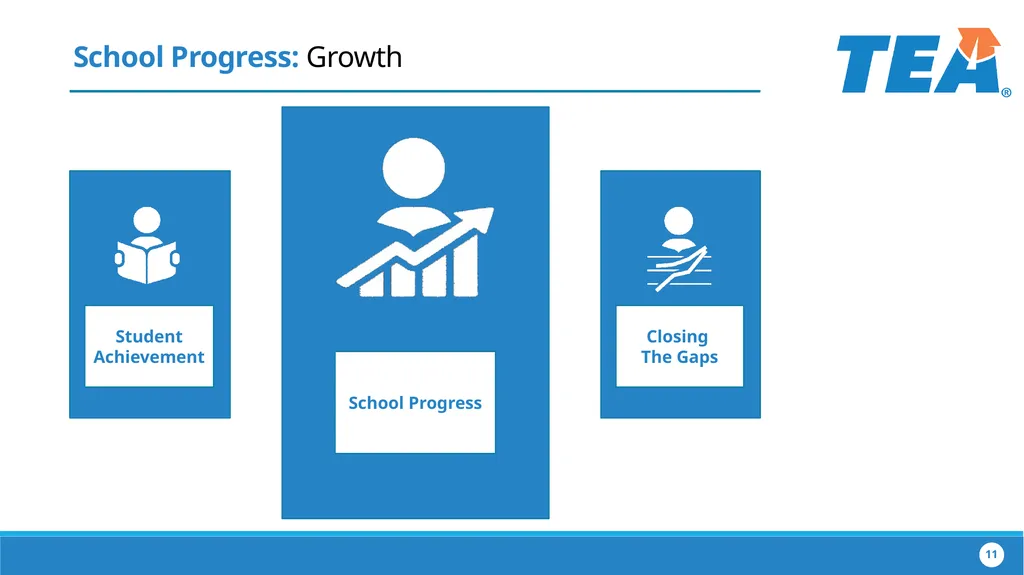
School Progress: Growth 11 School Progress Closing
The Gaps Student Achievement<br>
The Gaps Student Achievement<br>
12
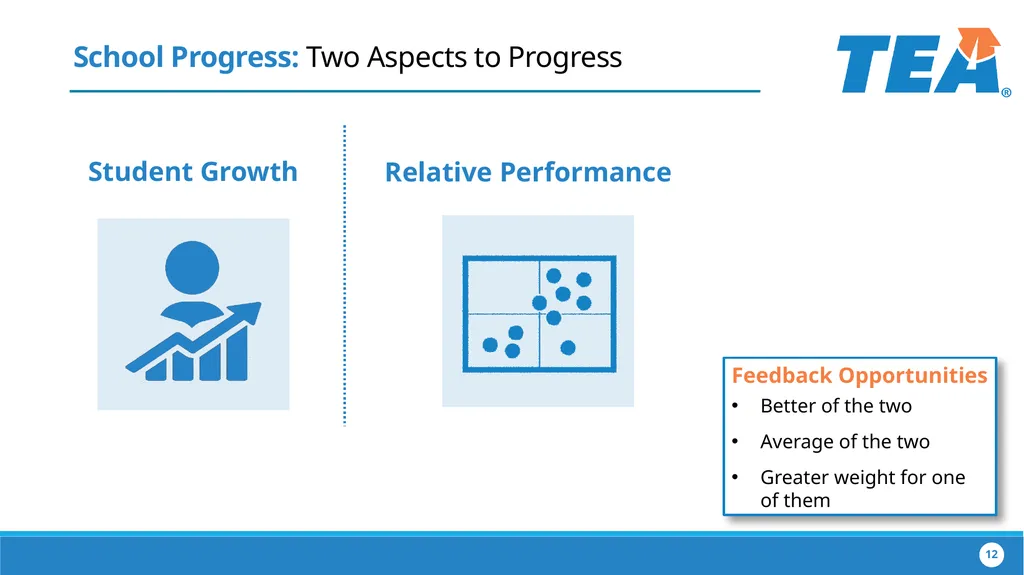
School Progress: Two Aspects to Progress Student Growth Relative Performance 12 Feedback Opportunities
Better of the two
Average of the two
Greater weight for one of them<br>
Better of the two
Average of the two
Greater weight for one of them<br>
13
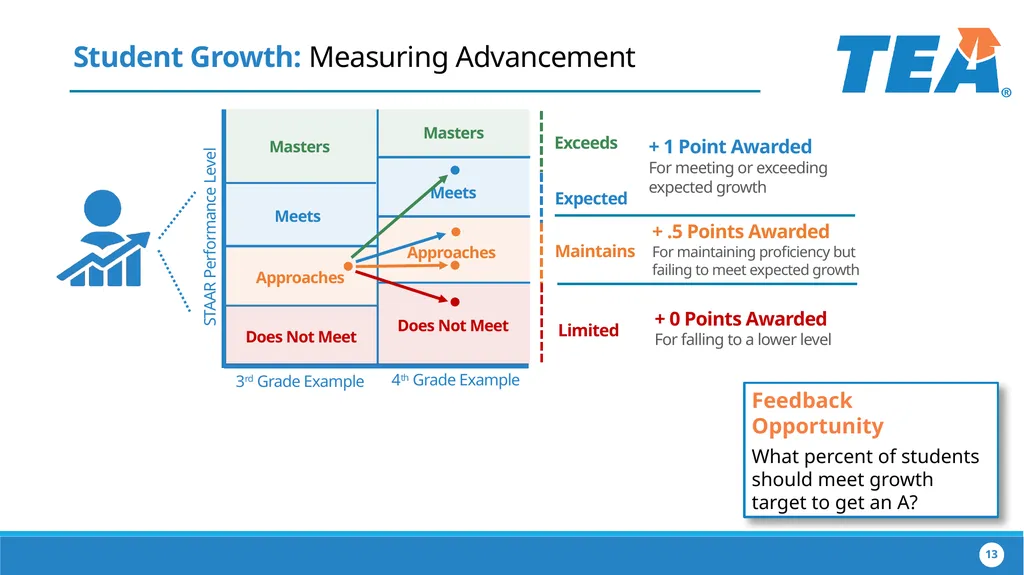
Student Growth: Measuring Advancement STAAR Performance Level 3rd Grade Example 4th Grade Example Does Not Meet Does Not Meet Approaches Approaches Meets Meets Masters Masters + 1 Point Awarded
For meeting or exceeding expected growth + .5 Points Awarded
For maintaining proficiency but failing to meet expected growth + 0 Points Awarded
For falling to a lower level 13 13 Feedback Opportunity
What percent of students should meet growth target to get an A?<br>
For meeting or exceeding expected growth + .5 Points Awarded
For maintaining proficiency but failing to meet expected growth + 0 Points Awarded
For falling to a lower level 13 13 Feedback Opportunity
What percent of students should meet growth target to get an A?<br>
14
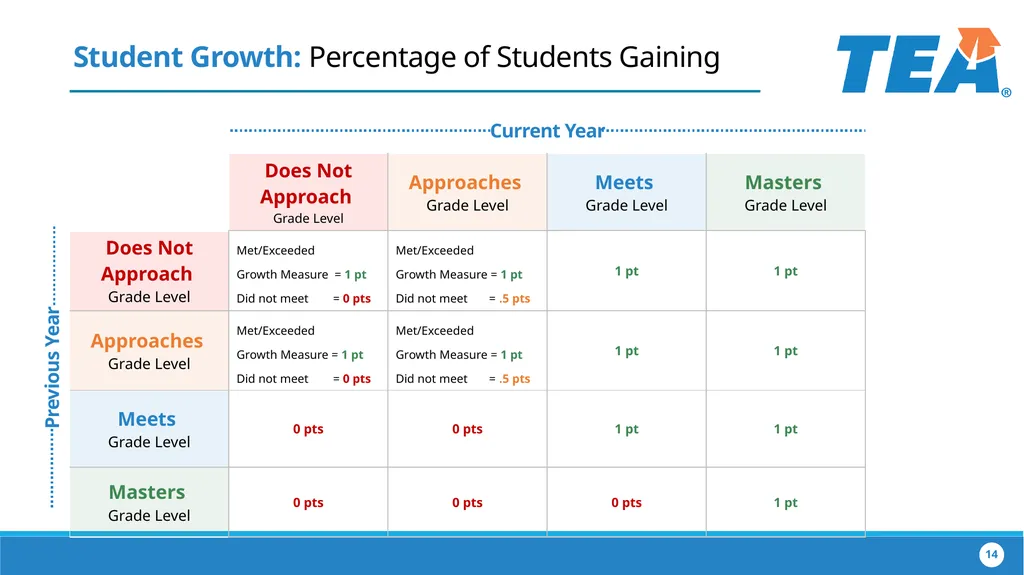
Student Growth: Percentage of Students Gaining Current Year Previous Year 14<br>
15
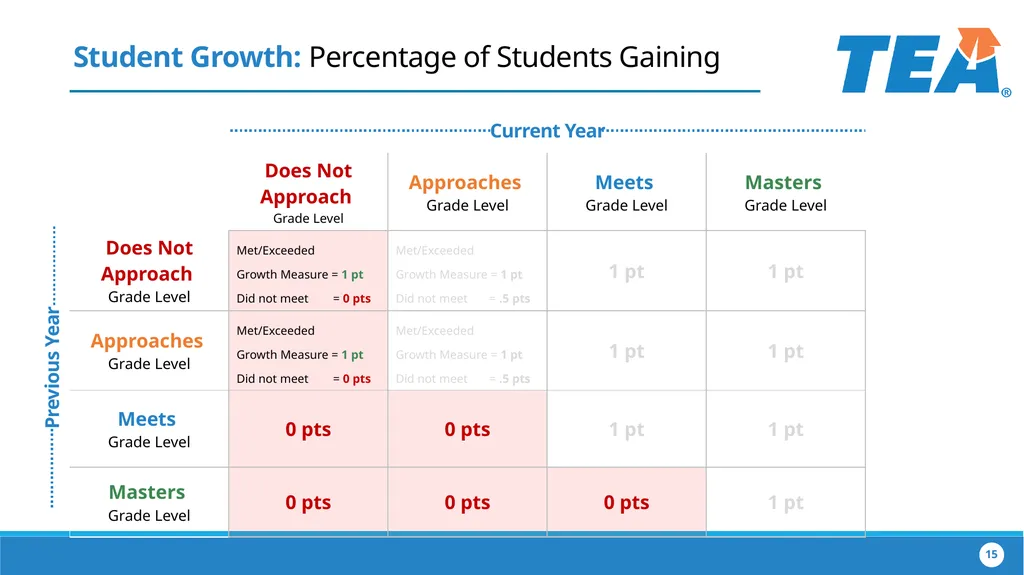
Student Growth: Percentage of Students Gaining Current Year Previous Year 15 15<br>
16
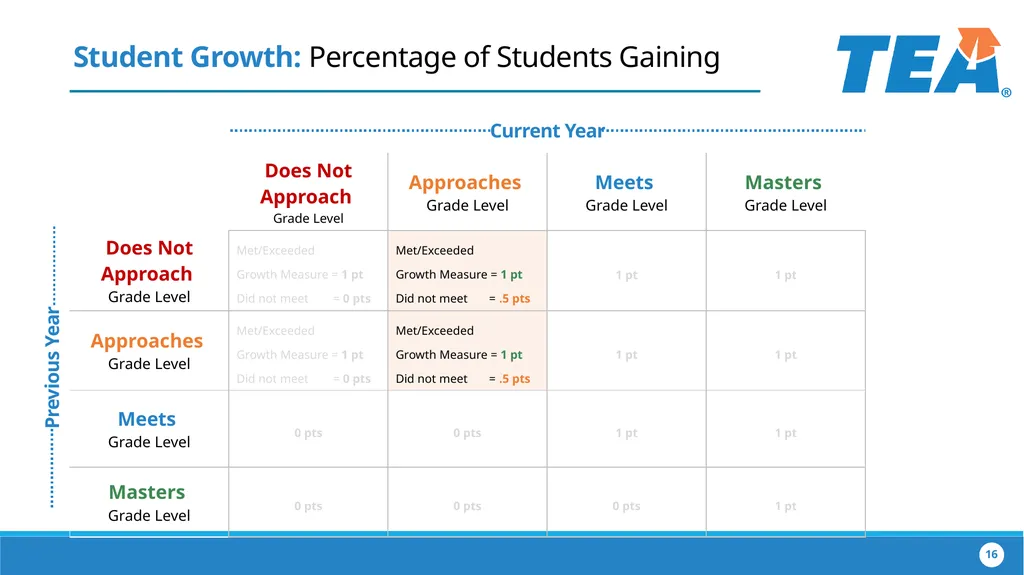
Student Growth: Percentage of Students Gaining Current Year Previous Year 16 16<br>
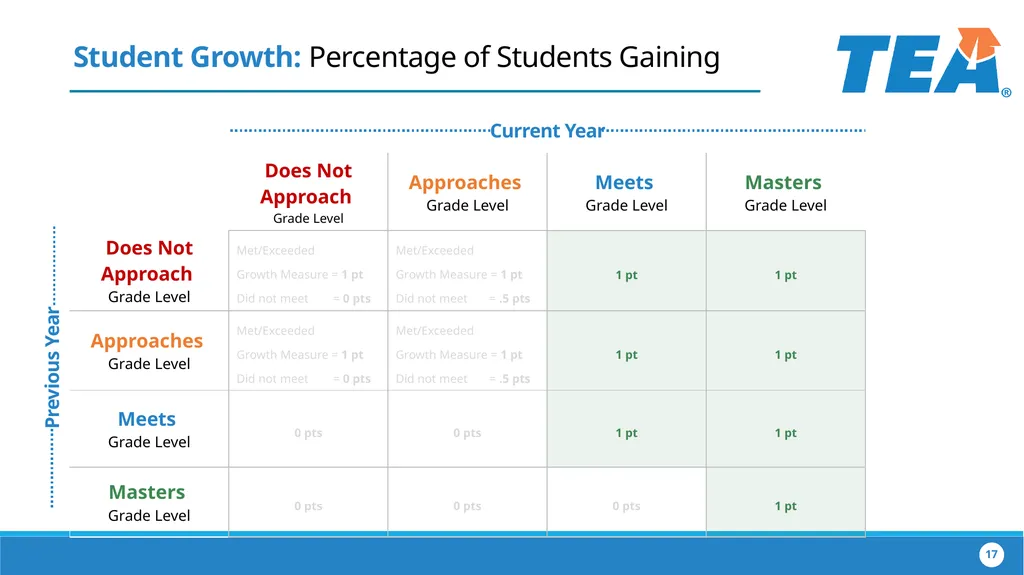
17
Student Growth: Percentage of Students Gaining Current Year Previous Year 17 17<br>
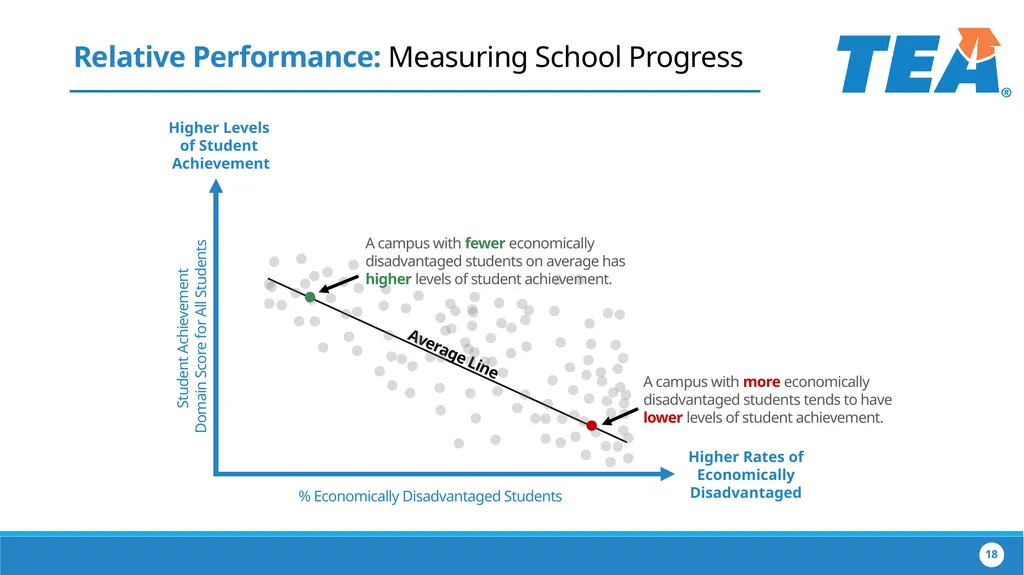
18
Student Achievement
Domain Score for All Students % Economically Disadvantaged Students Average Line Higher Levels
of Student
Achievement Higher Rates of
Economically
Disadvantaged Relative Performance: Measuring School Progress 18 18<br>
of Student
Achievement Higher Rates of
Economically
Disadvantaged Relative Performance: Measuring School Progress 18 18<br>
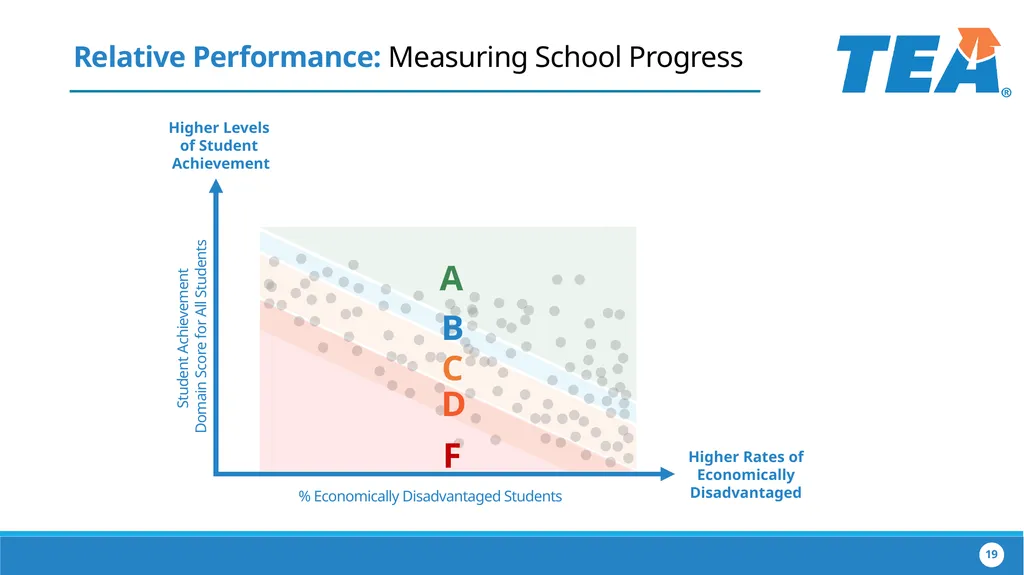
19
Student Achievement
Domain Score for All Students % Economically Disadvantaged Students Higher Levels
of Student
Achievement Higher Rates of
Economically
Disadvantaged Relative Performance: Measuring School Progress A B C D F 19 19<br>
of Student
Achievement Higher Rates of
Economically
Disadvantaged Relative Performance: Measuring School Progress A B C D F 19 19<br>
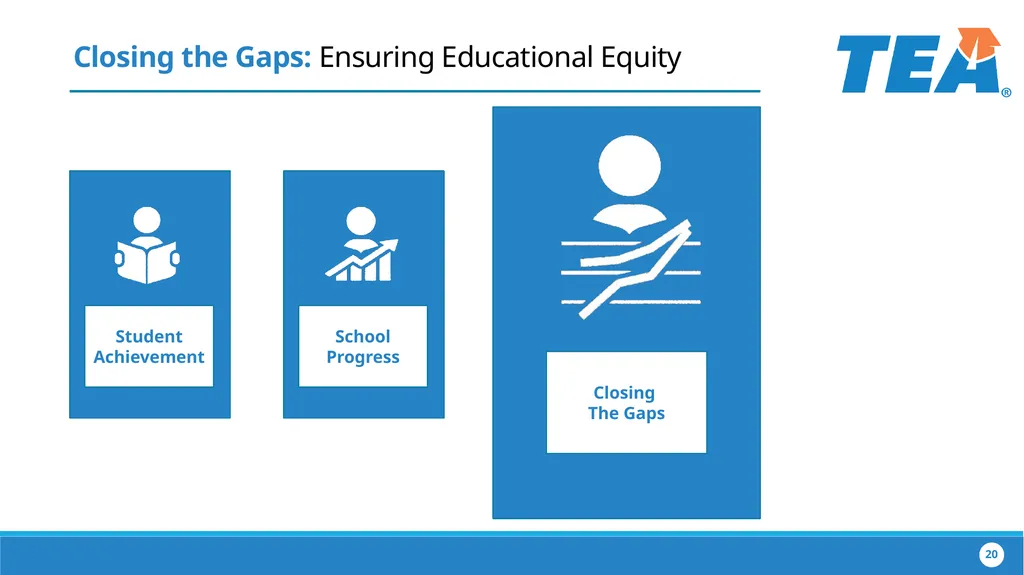
20
Closing the Gaps: Ensuring Educational Equity 20 Closing
The Gaps Student Achievement School
Progress<br>
The Gaps Student Achievement School
Progress<br>
21
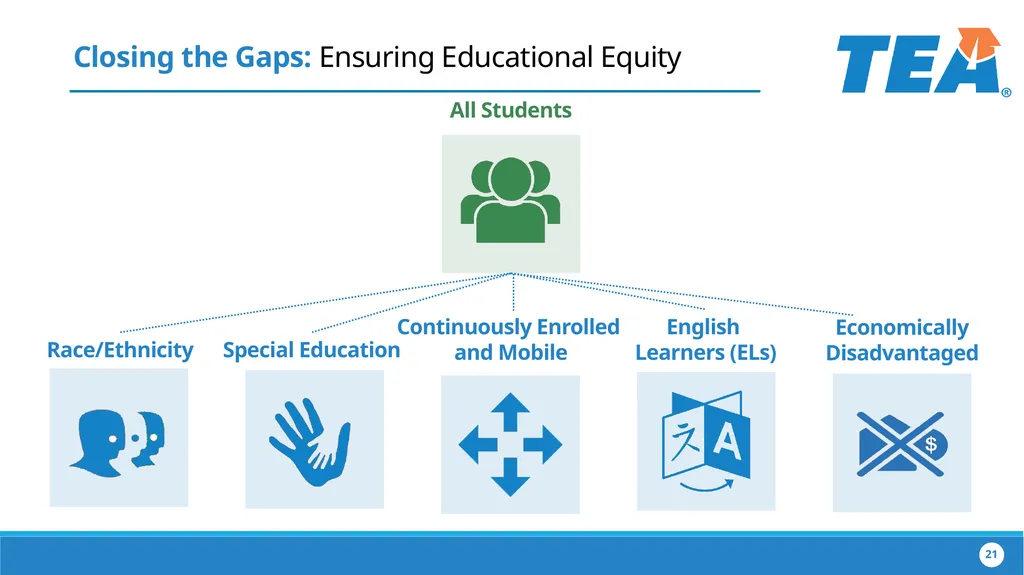
Closing the Gaps: Ensuring Educational Equity Race/Ethnicity Special Education English
Learners (ELs) Continuously Enrolled
and Mobile All Students 21 Economically
Disadvantaged<br>
22
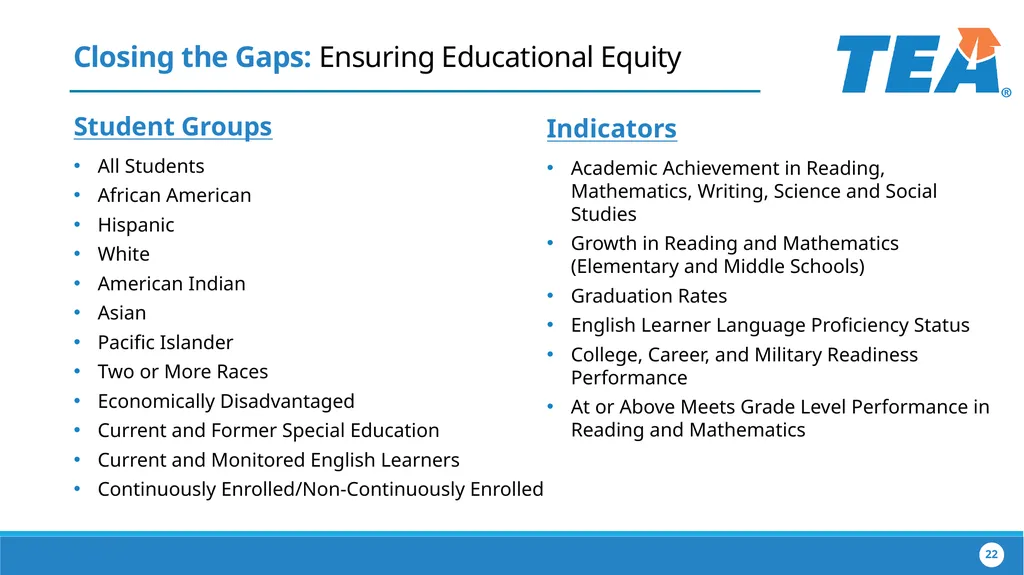
Closing the Gaps: Ensuring Educational Equity 22 Student Groups
All Students
African American
Hispanic
White
American Indian
Asian
Pacific Islander
Two or More Races
Economically Disadvantaged
Current and Former Special Education
Current and Monitored English Learners
Continuously Enrolled/Non-Continuously Enrolled Indicators
Academic Achievement in Reading, Mathematics, Writing, Science and Social Studies
Growth in Reading and Mathematics (Elementary and Middle Schools)
Graduation Rates
English Learner Language Proficiency Status
College, Career, and Military Readiness Performance
At or Above Meets Grade Level Performance in Reading and Mathematics<br>
All Students
African American
Hispanic
White
American Indian
Asian
Pacific Islander
Two or More Races
Economically Disadvantaged
Current and Former Special Education
Current and Monitored English Learners
Continuously Enrolled/Non-Continuously Enrolled Indicators
Academic Achievement in Reading, Mathematics, Writing, Science and Social Studies
Growth in Reading and Mathematics (Elementary and Middle Schools)
Graduation Rates
English Learner Language Proficiency Status
College, Career, and Military Readiness Performance
At or Above Meets Grade Level Performance in Reading and Mathematics<br>
23
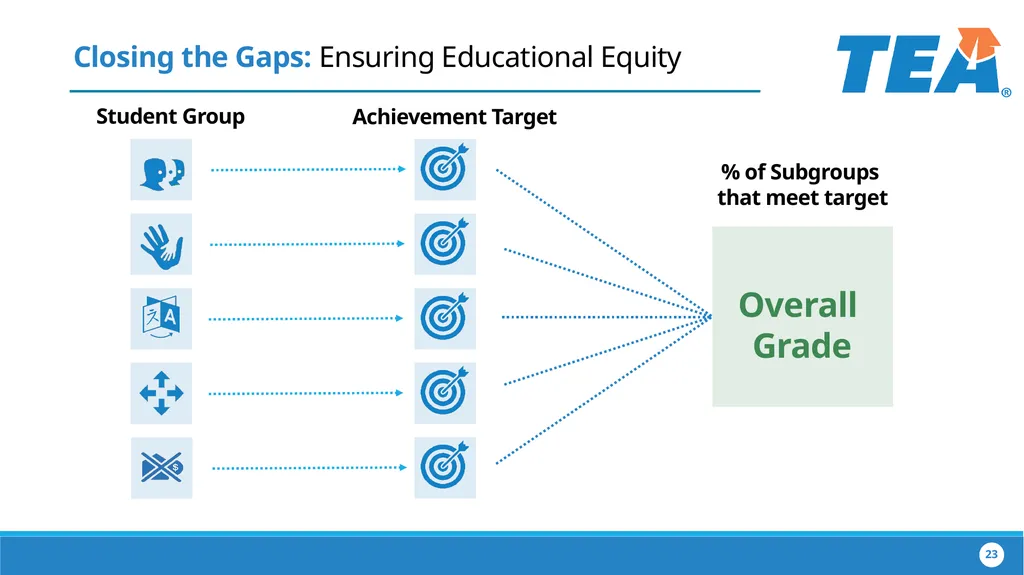
Closing the Gaps: Ensuring Educational Equity Student Group Achievement Target % of Subgroups
that meet target Overall
Grade 23<br>
that meet target Overall
Grade 23<br>
24
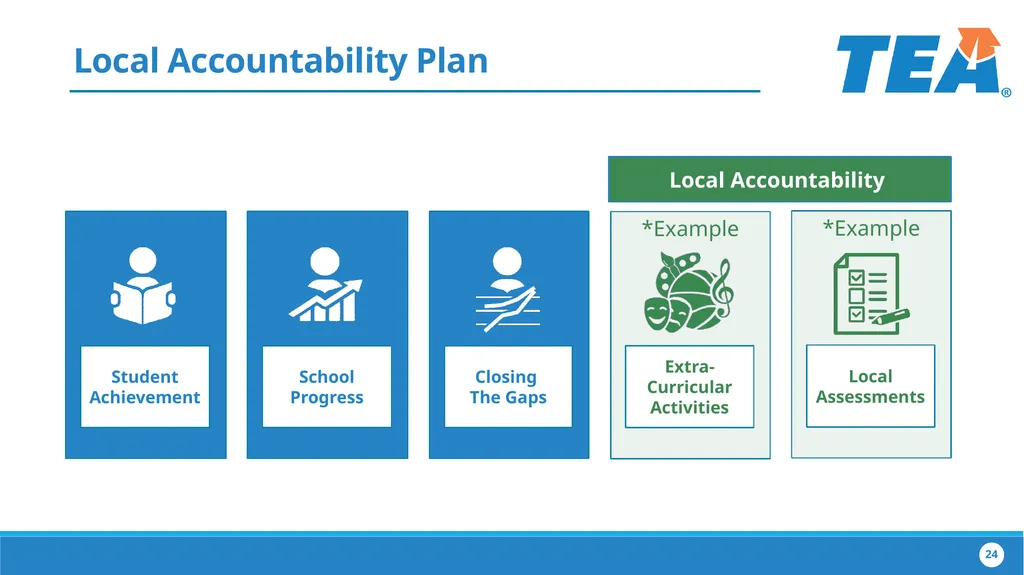
Local Accountability Plan Closing
The Gaps School
Progress Student Achievement *Example
Sa Extra-Curricular Activities *Example Local
Assessments Local Accountability 24<br>
The Gaps School
Progress Student Achievement *Example
Sa Extra-Curricular Activities *Example Local
Assessments Local Accountability 24<br>
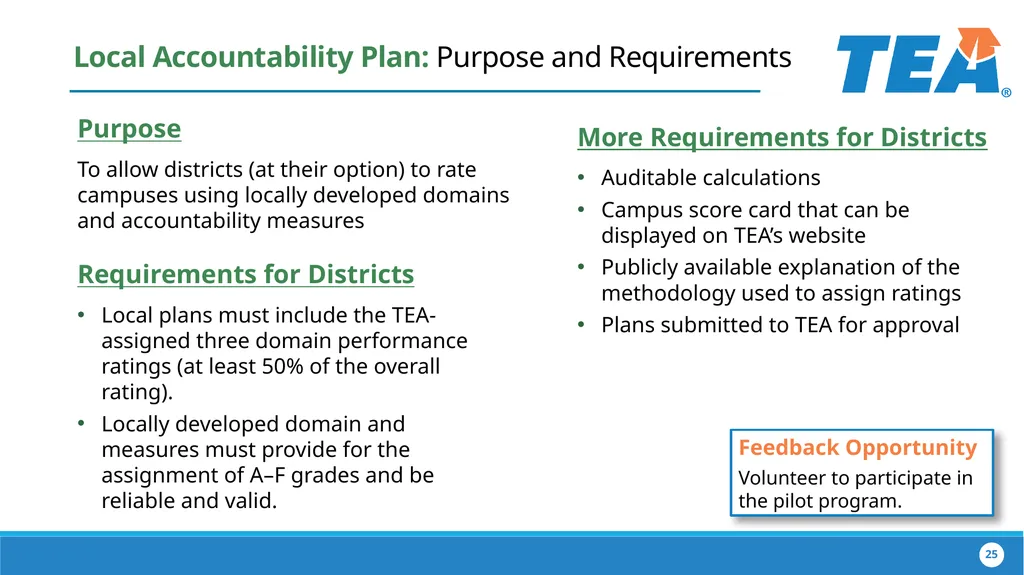
25
Local Accountability Plan: Purpose and Requirements Requirements for Districts
Local plans must include the TEA-assigned three domain performance ratings (at least 50% of the overall rating).
Locally developed domain and measures must provide for the assignment of A–F grades and be reliable and valid. Purpose
To allow districts (at their option) to rate campuses using locally developed domains and accountability measures 25 Feedback Opportunity
Volunteer to participate in the pilot program. More Requirements for Districts
Auditable calculations
Campus score card that can be displayed on TEA’s website
Publicly available explanation of the methodology used to assign ratings
Plans submitted to TEA for approval<br>
Local plans must include the TEA-assigned three domain performance ratings (at least 50% of the overall rating).
Locally developed domain and measures must provide for the assignment of A–F grades and be reliable and valid. Purpose
To allow districts (at their option) to rate campuses using locally developed domains and accountability measures 25 Feedback Opportunity
Volunteer to participate in the pilot program. More Requirements for Districts
Auditable calculations
Campus score card that can be displayed on TEA’s website
Publicly available explanation of the methodology used to assign ratings
Plans submitted to TEA for approval<br>
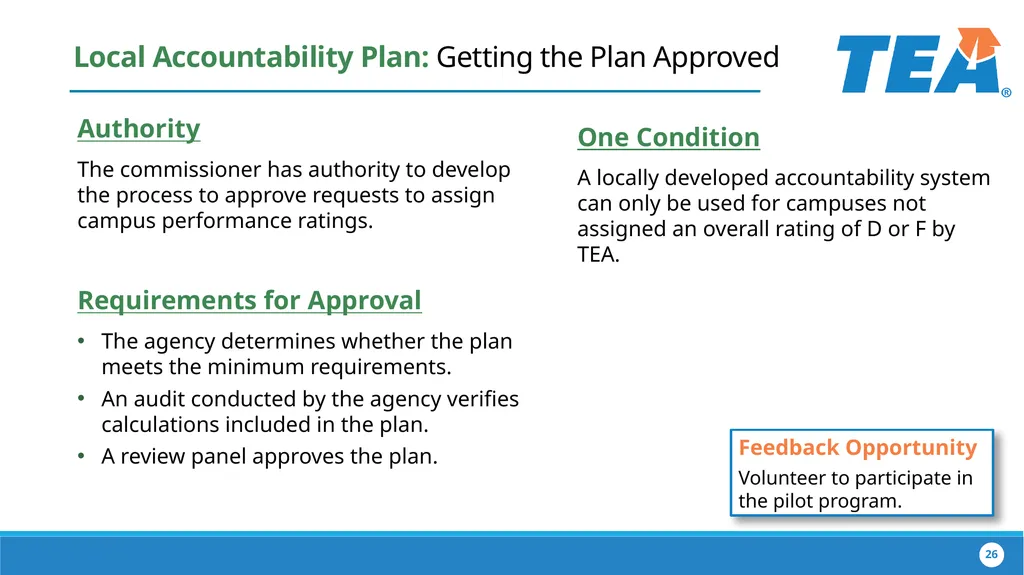
26
Local Accountability Plan: Getting the Plan Approved Requirements for Approval
The agency determines whether the plan meets the minimum requirements.
An audit conducted by the agency verifies calculations included in the plan.
A review panel approves the plan. Authority
The commissioner has authority to develop the process to approve requests to assign campus performance ratings. 26 One Condition
A locally developed accountability system can only be used for campuses not assigned an overall rating of D or F by TEA. Feedback Opportunity
Volunteer to participate in the pilot program.<br>
The agency determines whether the plan meets the minimum requirements.
An audit conducted by the agency verifies calculations included in the plan.
A review panel approves the plan. Authority
The commissioner has authority to develop the process to approve requests to assign campus performance ratings. 26 One Condition
A locally developed accountability system can only be used for campuses not assigned an overall rating of D or F by TEA. Feedback Opportunity
Volunteer to participate in the pilot program.<br>
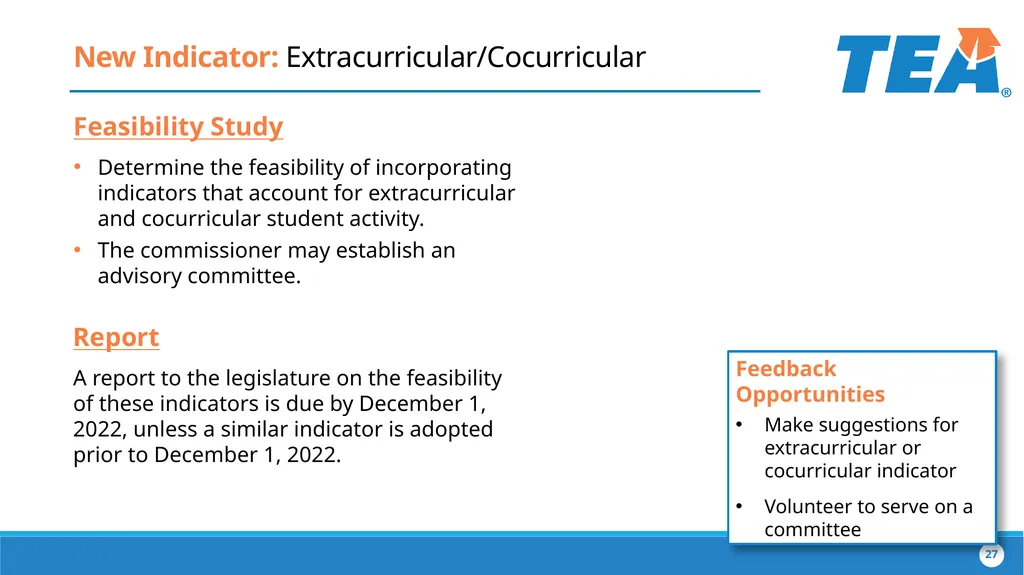
27
New Indicator: Extracurricular/Cocurricular Feasibility Study
Determine the feasibility of incorporating indicators that account for extracurricular and cocurricular student activity.
The commissioner may establish an advisory committee. Report
A report to the legislature on the feasibility of these indicators is due by December 1, 2022, unless a similar indicator is adopted prior to December 1, 2022. 27 Feedback Opportunities
Make suggestions for extracurricular or cocurricular indicator
Volunteer to serve on a committee<br>
Determine the feasibility of incorporating indicators that account for extracurricular and cocurricular student activity.
The commissioner may establish an advisory committee. Report
A report to the legislature on the feasibility of these indicators is due by December 1, 2022, unless a similar indicator is adopted prior to December 1, 2022. 27 Feedback Opportunities
Make suggestions for extracurricular or cocurricular indicator
Volunteer to serve on a committee<br>
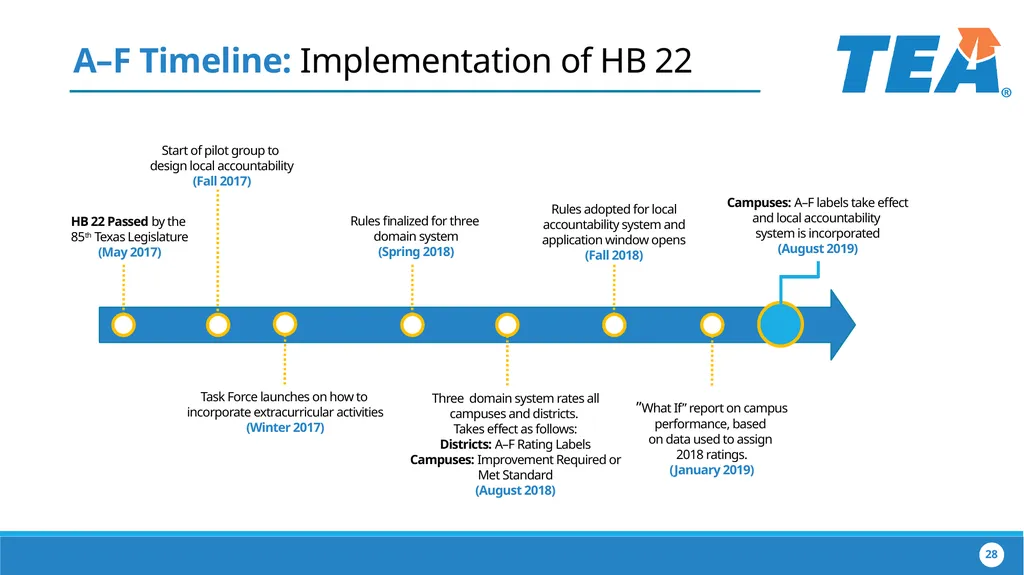
28
HB 22 Passed by the
85th Texas Legislature
(May 2017) Rules adopted for local accountability system and application window opens
(Fall 2018) Rules finalized for three
domain system
(Spring 2018) Three domain system rates all campuses and districts. Takes effect as follows:
Districts: A–F Rating Labels
Campuses: Improvement Required or Met Standard
(August 2018) Campuses: A–F labels take effect
and local accountability
system is incorporated
(August 2019) ”What If” report on campus performance, based
on data used to assign 2018 ratings.
(January 2019) Task Force launches on how to incorporate extracurricular activities
(Winter 2017) A–F Timeline: Implementation of HB 22 Start of pilot group to
design local accountability
(Fall 2017) 28 28<br>
85th Texas Legislature
(May 2017) Rules adopted for local accountability system and application window opens
(Fall 2018) Rules finalized for three
domain system
(Spring 2018) Three domain system rates all campuses and districts. Takes effect as follows:
Districts: A–F Rating Labels
Campuses: Improvement Required or Met Standard
(August 2018) Campuses: A–F labels take effect
and local accountability
system is incorporated
(August 2019) ”What If” report on campus performance, based
on data used to assign 2018 ratings.
(January 2019) Task Force launches on how to incorporate extracurricular activities
(Winter 2017) A–F Timeline: Implementation of HB 22 Start of pilot group to
design local accountability
(Fall 2017) 28 28<br>
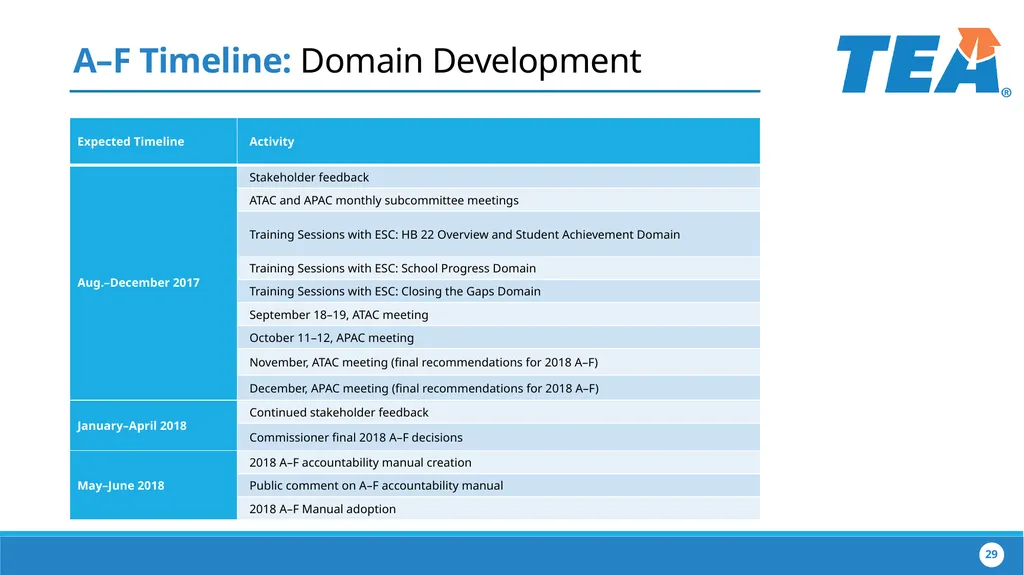
29
A–F Timeline: Domain Development 29 29<br>
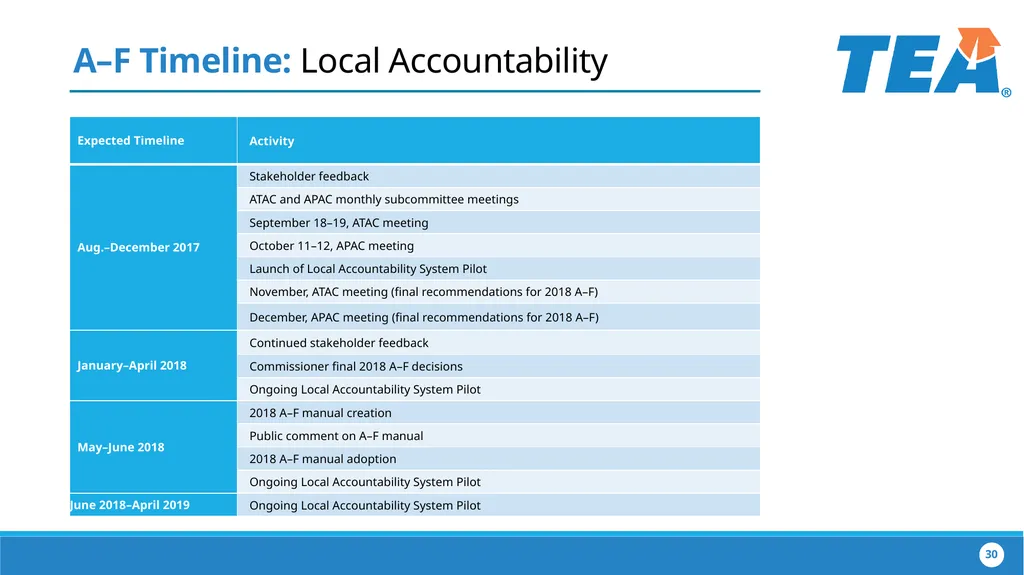
30
A–F Timeline: Local Accountability 30 30<br>
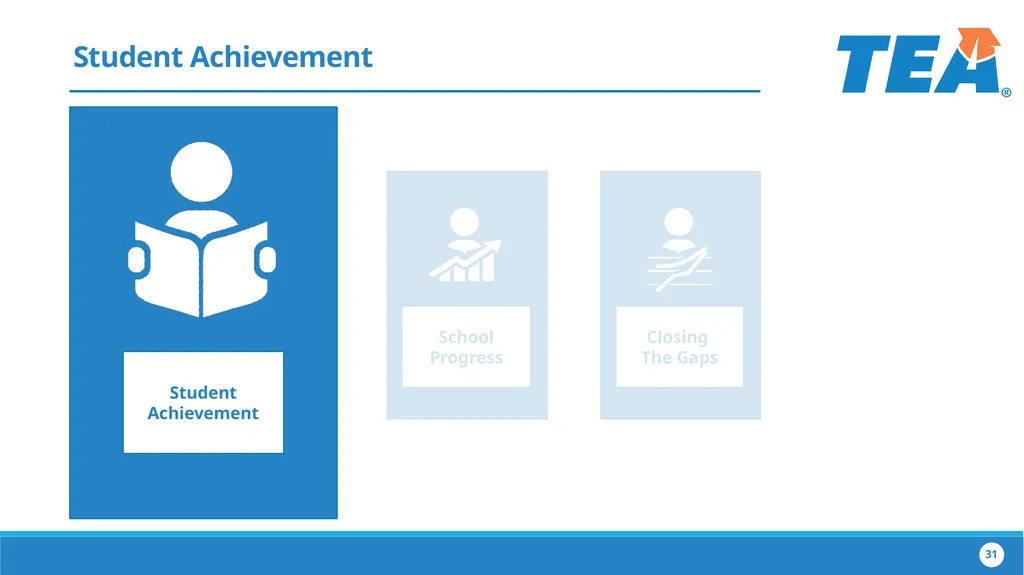
31
Approaches or Above Meets or Above Masters Student Achievement 31 31 Student Achievement Closing
The Gaps School
Progress<br>
The Gaps School
Progress<br>
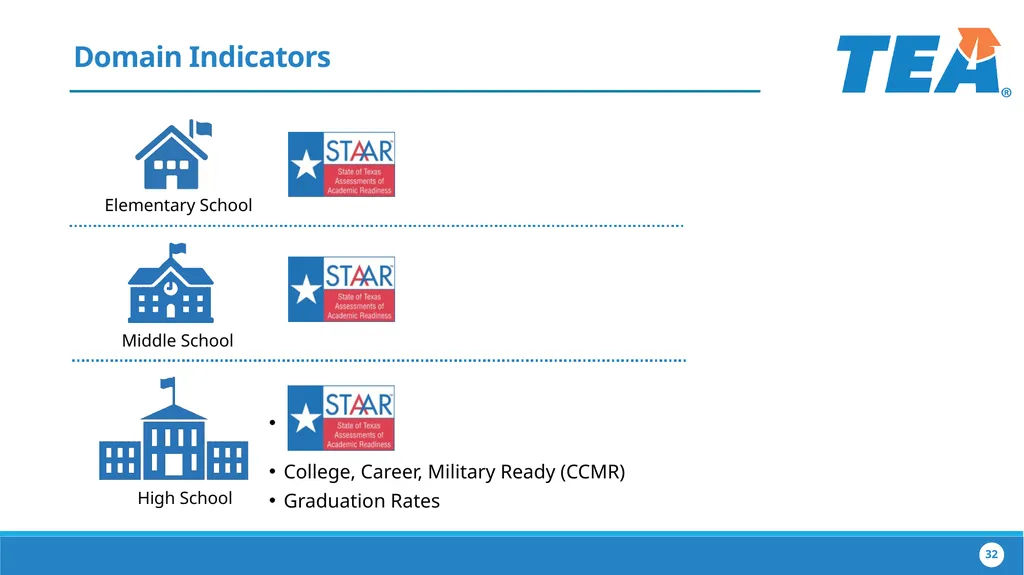
32
Domain Indicators College, Career, Military Ready (CCMR)
Graduation Rates High School Elementary School Middle School 32<br>
Graduation Rates High School Elementary School Middle School 32<br>
33
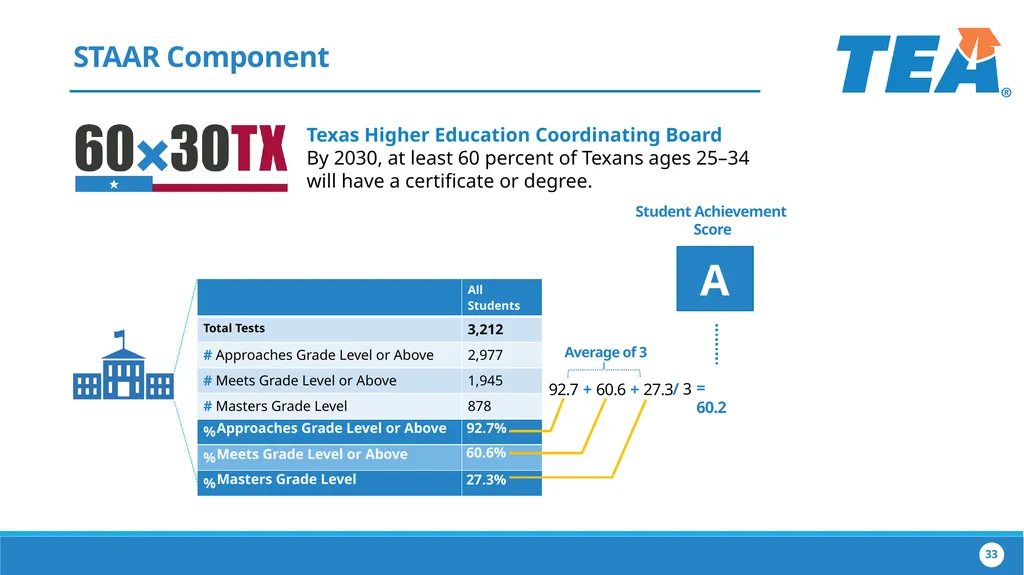
92.7 + 60.6 + 27.3 Average of 3 / 3 Student Achievement Score = 60.2 A Approaches Grade Level or Above Meets Grade Level or Above Masters Grade Level 92.7% 60.6% 27.3% STAAR Component 33 33 Texas Higher Education Coordinating Board
By 2030, at least 60 percent of Texans ages 25–34 will have a certificate or degree.<br>
By 2030, at least 60 percent of Texans ages 25–34 will have a certificate or degree.<br>
34
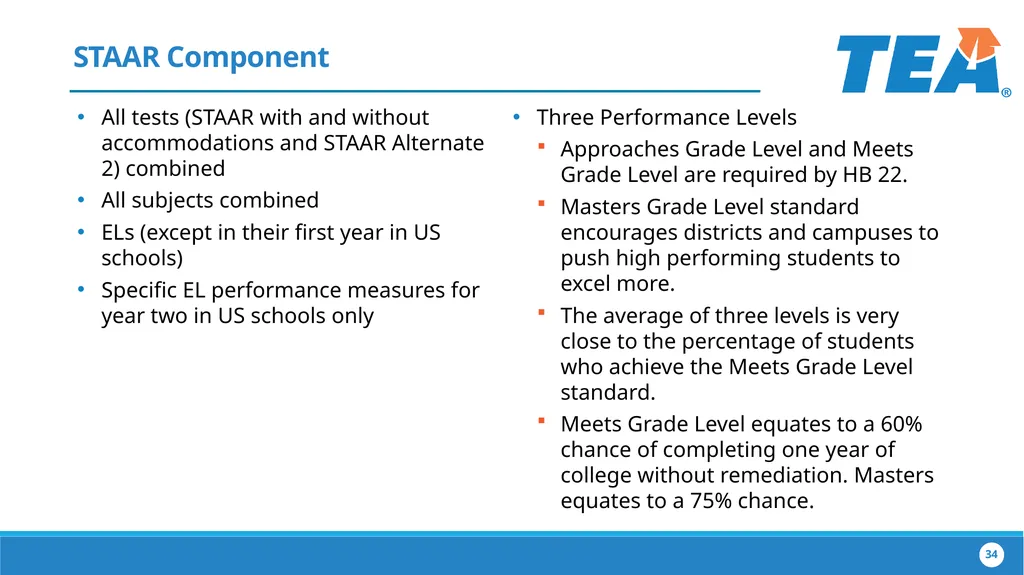
STAAR Component 34 34 All tests (STAAR with and without accommodations and STAAR Alternate 2) combined
All subjects combined
ELs (except in their first year in US schools)
Specific EL performance measures for year two in US schools only Three Performance Levels
Approaches Grade Level and Meets Grade Level are required by HB 22.
Masters Grade Level standard encourages districts and campuses to push high performing students to excel more.
The average of three levels is very close to the percentage of students who achieve the Meets Grade Level standard.
Meets Grade Level equates to a 60% chance of completing one year of college without remediation. Masters equates to a 75% chance.<br>
All subjects combined
ELs (except in their first year in US schools)
Specific EL performance measures for year two in US schools only Three Performance Levels
Approaches Grade Level and Meets Grade Level are required by HB 22.
Masters Grade Level standard encourages districts and campuses to push high performing students to excel more.
The average of three levels is very close to the percentage of students who achieve the Meets Grade Level standard.
Meets Grade Level equates to a 60% chance of completing one year of college without remediation. Masters equates to a 75% chance.<br>
35
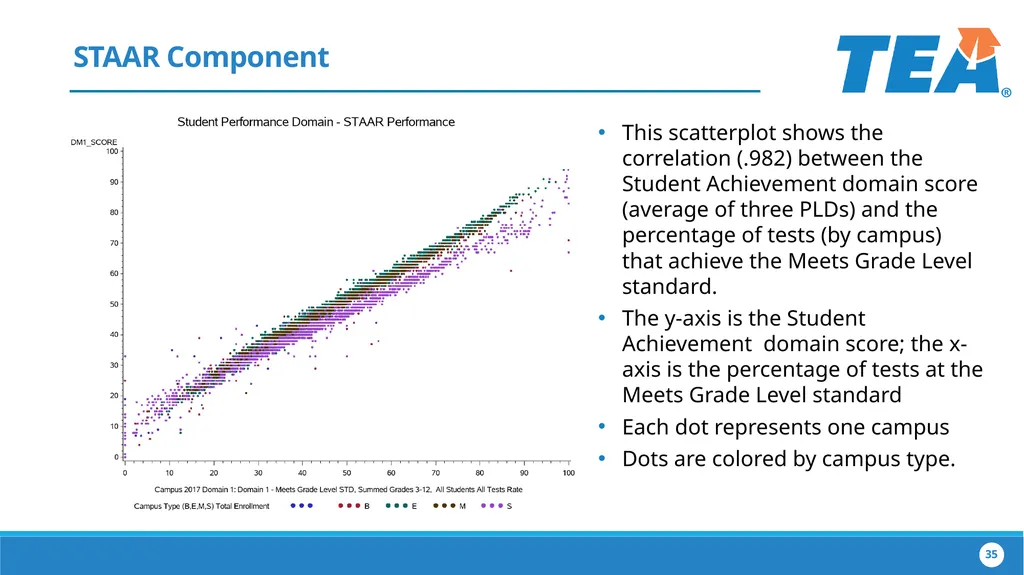
STAAR Component 35 35 This scatterplot shows the correlation (.982) between the Student Achievement domain score (average of three PLDs) and the percentage of tests (by campus) that achieve the Meets Grade Level standard.
The y-axis is the Student Achievement domain score; the x-axis is the percentage of tests at the Meets Grade Level standard
Each dot represents one campus
Dots are colored by campus type.<br>
The y-axis is the Student Achievement domain score; the x-axis is the percentage of tests at the Meets Grade Level standard
Each dot represents one campus
Dots are colored by campus type.<br>
36
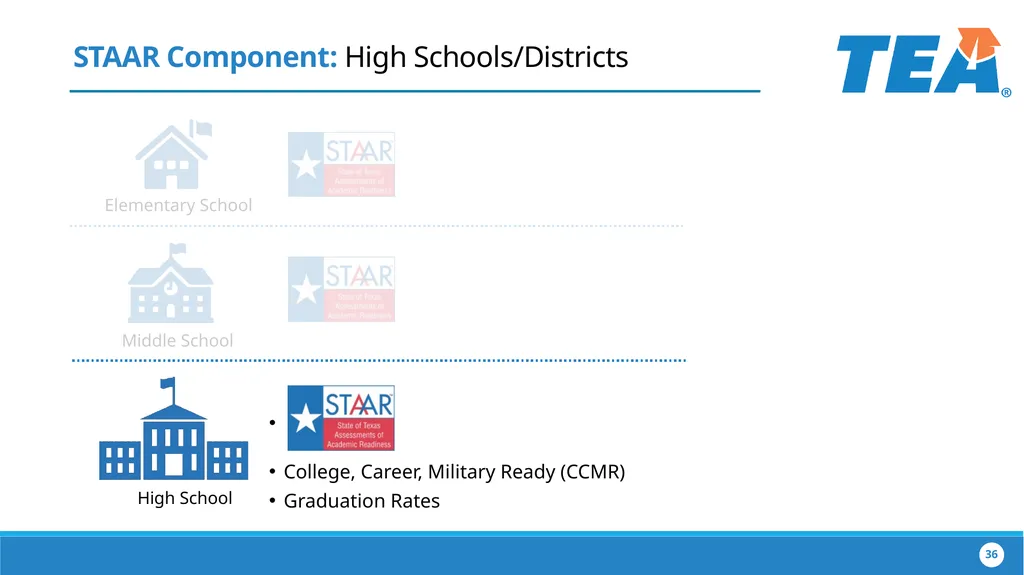
STAAR Component: High Schools/Districts College, Career, Military Ready (CCMR)
Graduation Rates Elementary School Middle School High School 36<br>
Graduation Rates Elementary School Middle School High School 36<br>
37
CCMR Indicators Computational Logic
Denominator is annual graduates.
Student who accomplishes any one is in numerator.
All CCMR indicators lag by one year. (CCMR data used in 2017–18 accountability will be from the 2016–17 school year.) 37<br>
Denominator is annual graduates.
Student who accomplishes any one is in numerator.
All CCMR indicators lag by one year. (CCMR data used in 2017–18 accountability will be from the 2016–17 school year.) 37<br>
38
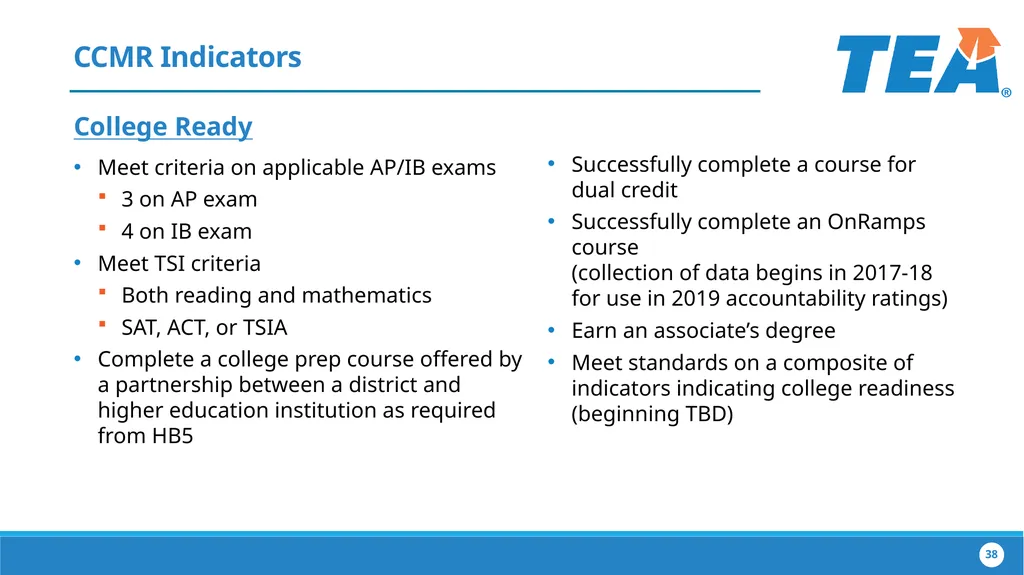
CCMR Indicators College Ready
Meet criteria on applicable AP/IB exams
3 on AP exam
4 on IB exam
Meet TSI criteria
Both reading and mathematics
SAT, ACT, or TSIA
Complete a college prep course offered by a partnership between a district and higher education institution as required from HB5 Successfully complete a course for dual credit
Successfully complete an OnRamps course (collection of data begins in 2017-18 for use in 2019 accountability ratings)
Earn an associate’s degree
Meet standards on a composite of indicators indicating college readiness (beginning TBD) 38<br>
Meet criteria on applicable AP/IB exams
3 on AP exam
4 on IB exam
Meet TSI criteria
Both reading and mathematics
SAT, ACT, or TSIA
Complete a college prep course offered by a partnership between a district and higher education institution as required from HB5 Successfully complete a course for dual credit
Successfully complete an OnRamps course (collection of data begins in 2017-18 for use in 2019 accountability ratings)
Earn an associate’s degree
Meet standards on a composite of indicators indicating college readiness (beginning TBD) 38<br>
39
CCMR Indicators Career Ready
Earn industry certification (list released August 21, 2017)
Be admitted to post-secondary industry certification program (beginning TBD)
Military Ready
Enlist in the United States Armed Forces 39<br>
Earn industry certification (list released August 21, 2017)
Be admitted to post-secondary industry certification program (beginning TBD)
Military Ready
Enlist in the United States Armed Forces 39<br>
40
CCMR Indicators: Stakeholder Input College Ready
Complete college prep course offered by a partnership between a district and higher education institution
Admitted for Credit? 40<br>
Complete college prep course offered by a partnership between a district and higher education institution
Admitted for Credit? 40<br>
41
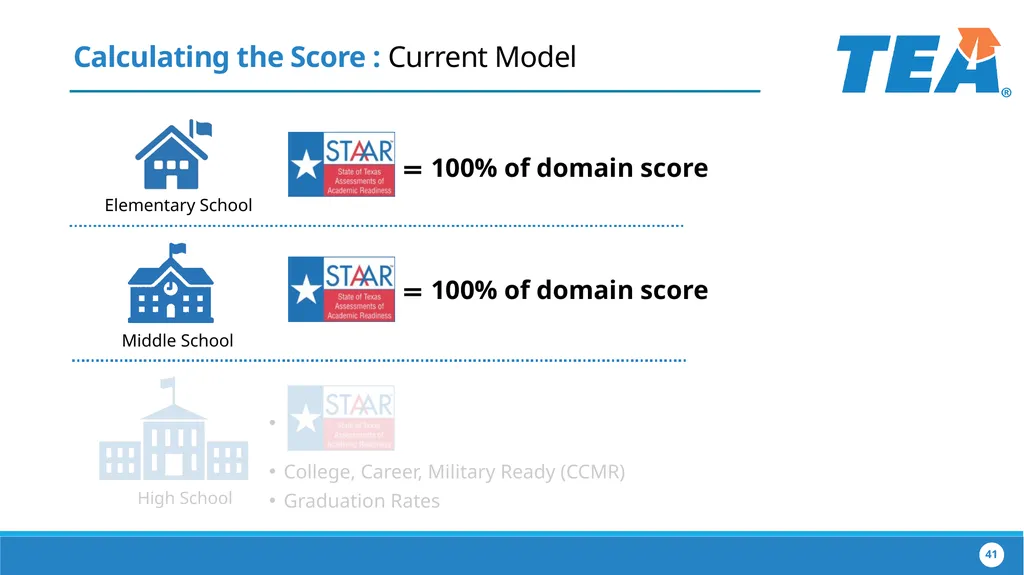
Calculating the Score : Current Model College, Career, Military Ready (CCMR)
Graduation Rates Elementary School Middle School High School 41 = 100% of domain score = 100% of domain score<br>
Graduation Rates Elementary School Middle School High School 41 = 100% of domain score = 100% of domain score<br>
42
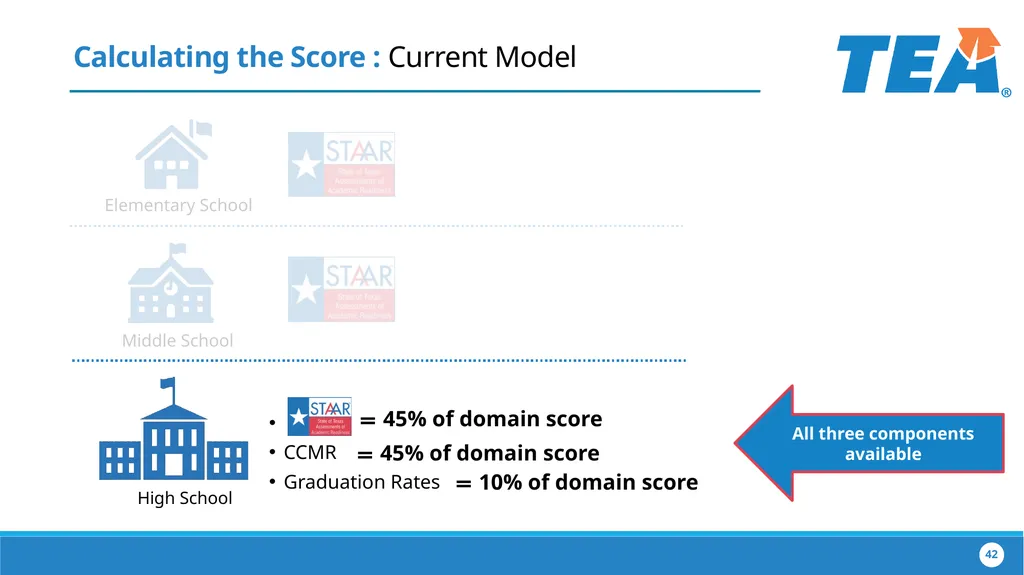
CCMR
Graduation Rates Elementary School Middle School High School 42 = 45% of domain score = 10% of domain score = 45% of domain score All three components available Calculating the Score : Current Model<br>
Graduation Rates Elementary School Middle School High School 42 = 45% of domain score = 10% of domain score = 45% of domain score All three components available Calculating the Score : Current Model<br>
43
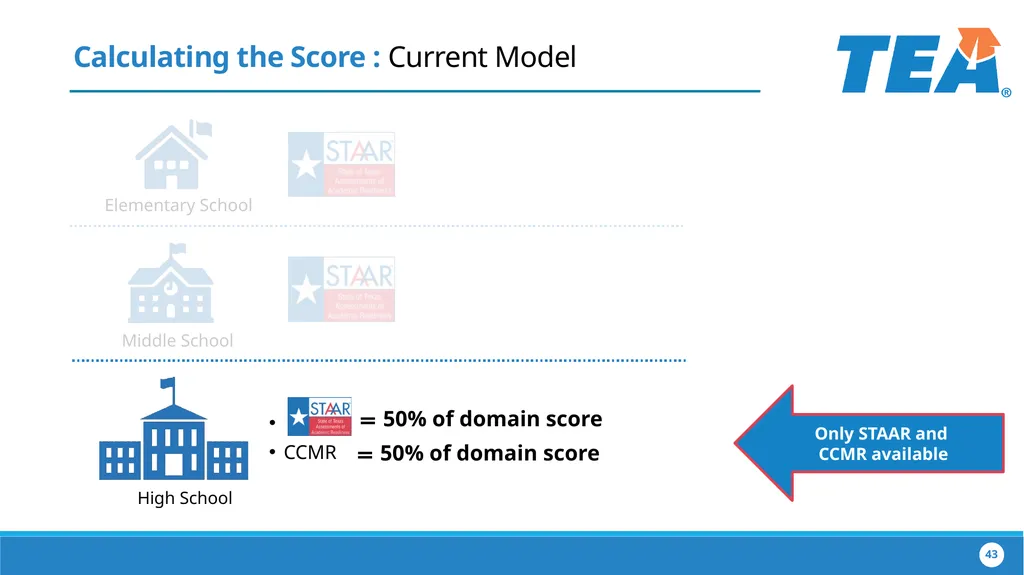
CCMR Elementary School Middle School High School 43 Only STAAR and
CCMR available = 50% of domain score = 50% of domain score Calculating the Score : Current Model<br>
44
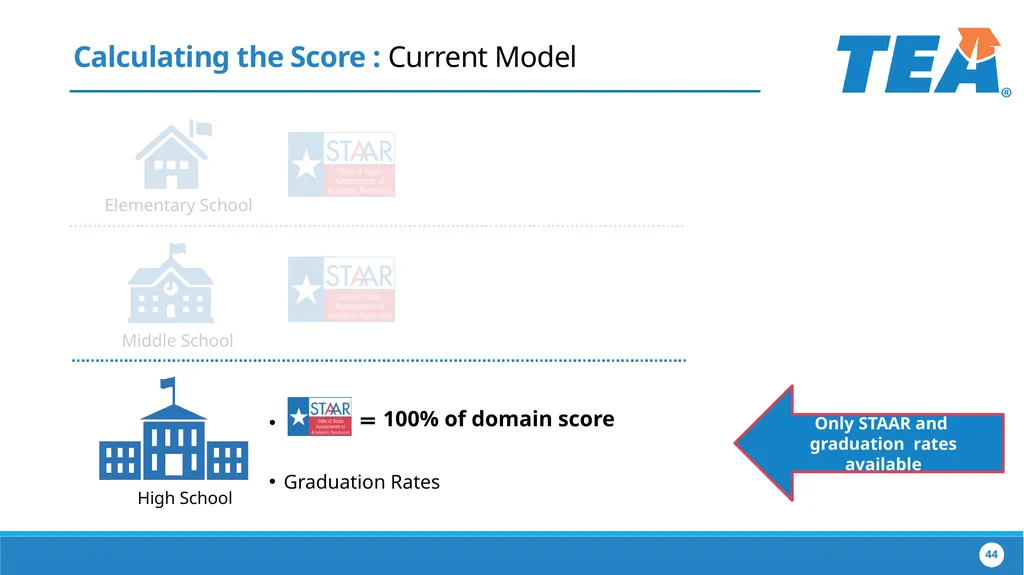
Graduation Rates Elementary School Middle School High School 44 Only STAAR and
graduation rates available = 100% of domain score Calculating the Score : Current Model<br>
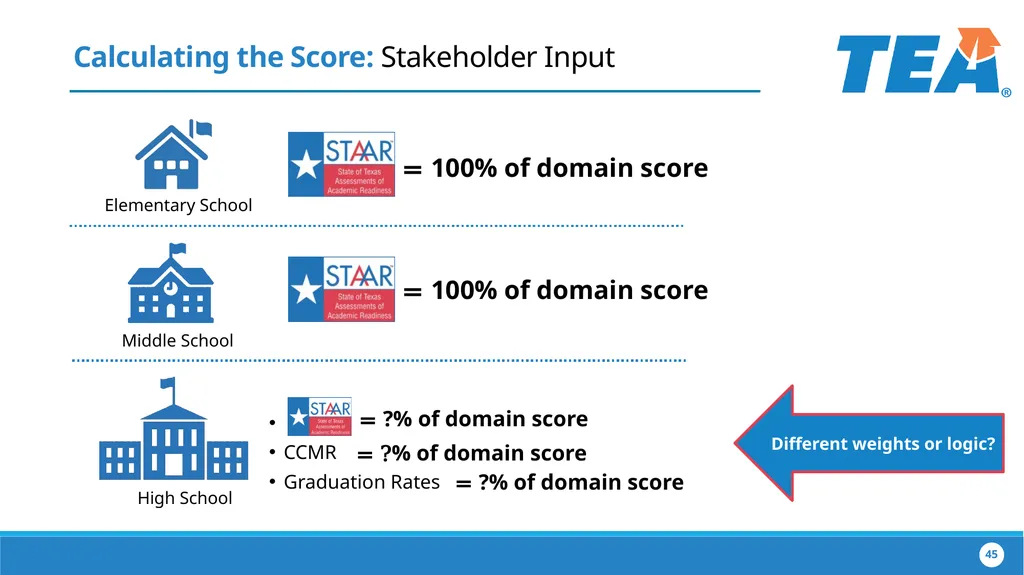
45
Elementary School Middle School High School 45 = 100% of domain score = 100% of domain score CCMR
Graduation Rates = ?% of domain score = ?% of domain score = ?% of domain score Different weights or logic? Calculating the Score: Stakeholder Input<br>
Graduation Rates = ?% of domain score = ?% of domain score = ?% of domain score Different weights or logic? Calculating the Score: Stakeholder Input<br>
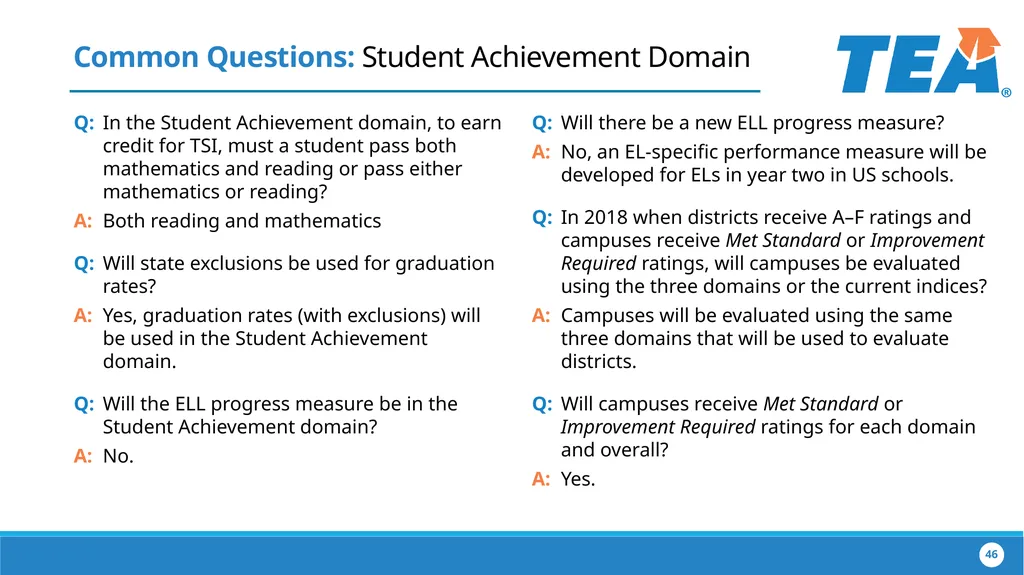
46
Common Questions: Student Achievement Domain 46 Q: In the Student Achievement domain, to earn credit for TSI, must a student pass both mathematics and reading or pass either mathematics or reading?
A: Both reading and mathematics
Q: Will state exclusions be used for graduation rates?
A: Yes, graduation rates (with exclusions) will be used in the Student Achievement domain.
Q: Will the ELL progress measure be in the Student Achievement domain?
A: No. Q: Will there be a new ELL progress measure?
A: No, an EL-specific performance measure will be developed for ELs in year two in US schools.
Q: In 2018 when districts receive A–F ratings and campuses receive Met Standard or Improvement Required ratings, will campuses be evaluated using the three domains or the current indices?
A: Campuses will be evaluated using the same three domains that will be used to evaluate districts.
Q: Will campuses receive Met Standard or Improvement Required ratings for each domain and overall?
A: Yes.<br>
A: Both reading and mathematics
Q: Will state exclusions be used for graduation rates?
A: Yes, graduation rates (with exclusions) will be used in the Student Achievement domain.
Q: Will the ELL progress measure be in the Student Achievement domain?
A: No. Q: Will there be a new ELL progress measure?
A: No, an EL-specific performance measure will be developed for ELs in year two in US schools.
Q: In 2018 when districts receive A–F ratings and campuses receive Met Standard or Improvement Required ratings, will campuses be evaluated using the three domains or the current indices?
A: Campuses will be evaluated using the same three domains that will be used to evaluate districts.
Q: Will campuses receive Met Standard or Improvement Required ratings for each domain and overall?
A: Yes.<br>
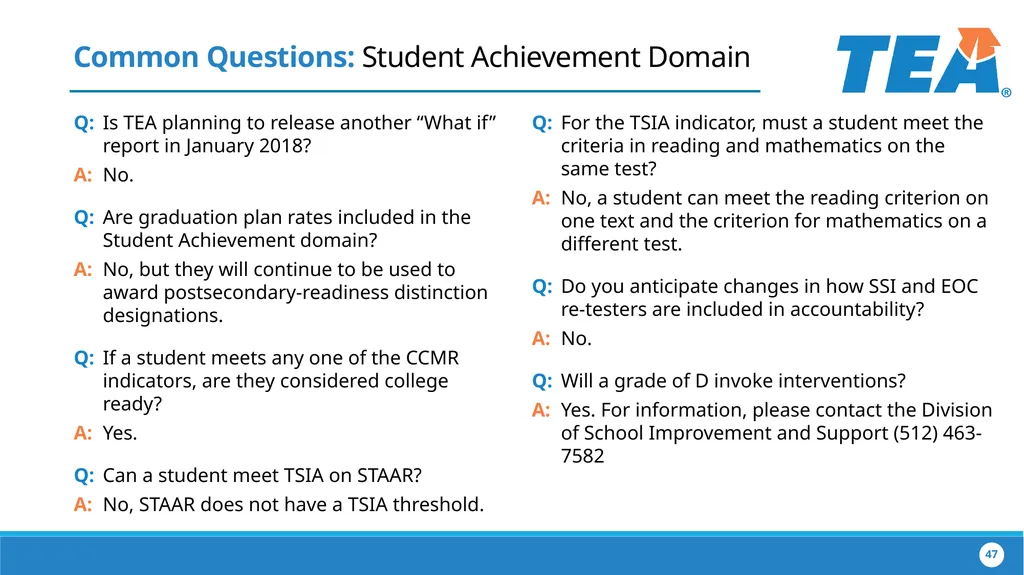
47
Common Questions: Student Achievement Domain 47 Q: Is TEA planning to release another “What if” report in January 2018?
A: No.
Q: Are graduation plan rates included in the Student Achievement domain?
A: No, but they will continue to be used to award postsecondary-readiness distinction designations.
Q: If a student meets any one of the CCMR indicators, are they considered college ready?
A: Yes.
Q: Can a student meet TSIA on STAAR?
A: No, STAAR does not have a TSIA threshold. Q: For the TSIA indicator, must a student meet the criteria in reading and mathematics on the same test?
A: No, a student can meet the reading criterion on one text and the criterion for mathematics on a different test.
Q: Do you anticipate changes in how SSI and EOC re-testers are included in accountability?
A: No.
Q: Will a grade of D invoke interventions?
A: Yes. For information, please contact the Division of School Improvement and Support (512) 463-7582<br>
A: No.
Q: Are graduation plan rates included in the Student Achievement domain?
A: No, but they will continue to be used to award postsecondary-readiness distinction designations.
Q: If a student meets any one of the CCMR indicators, are they considered college ready?
A: Yes.
Q: Can a student meet TSIA on STAAR?
A: No, STAAR does not have a TSIA threshold. Q: For the TSIA indicator, must a student meet the criteria in reading and mathematics on the same test?
A: No, a student can meet the reading criterion on one text and the criterion for mathematics on a different test.
Q: Do you anticipate changes in how SSI and EOC re-testers are included in accountability?
A: No.
Q: Will a grade of D invoke interventions?
A: Yes. For information, please contact the Division of School Improvement and Support (512) 463-7582<br>
48
48 48 ? Questions and Feedback Feedback
Survey Link to come by email
feedbackAF@tea.texas.gov Resources
http://tea.texas.gov/A-F
http://tea.texas.gov/accountability
performance.reporting@tea.texas.gov
(512) 463-9704<br>
Survey Link to come by email
feedbackAF@tea.texas.gov Resources
http://tea.texas.gov/A-F
http://tea.texas.gov/accountability
performance.reporting@tea.texas.gov
(512) 463-9704<br>