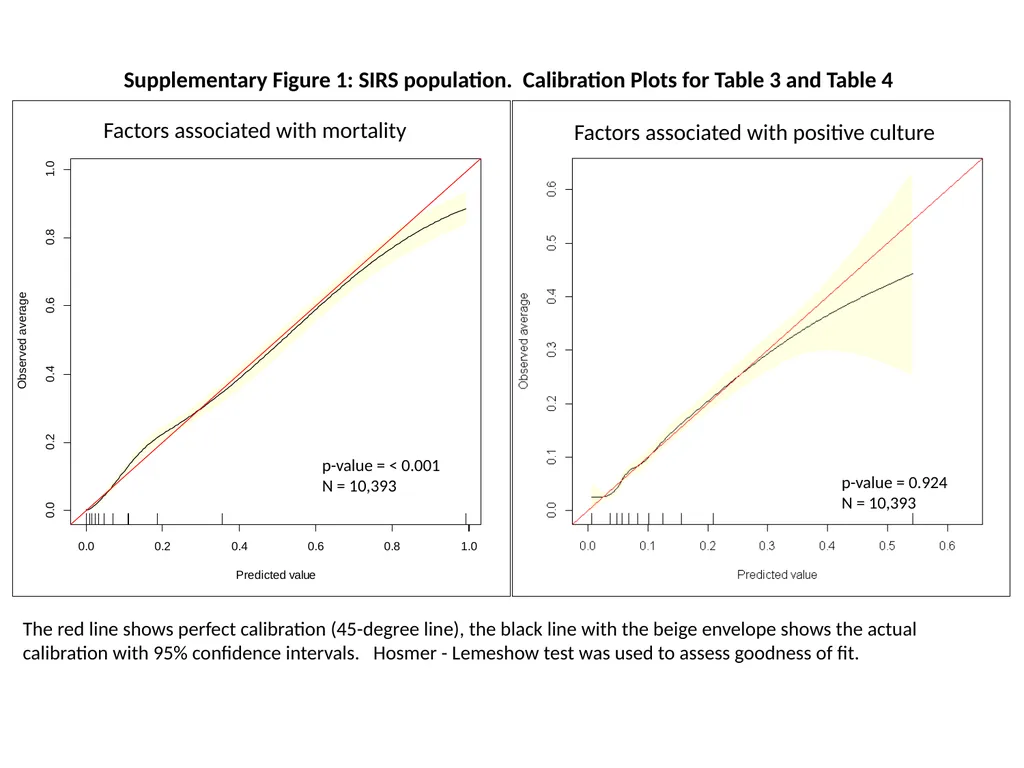
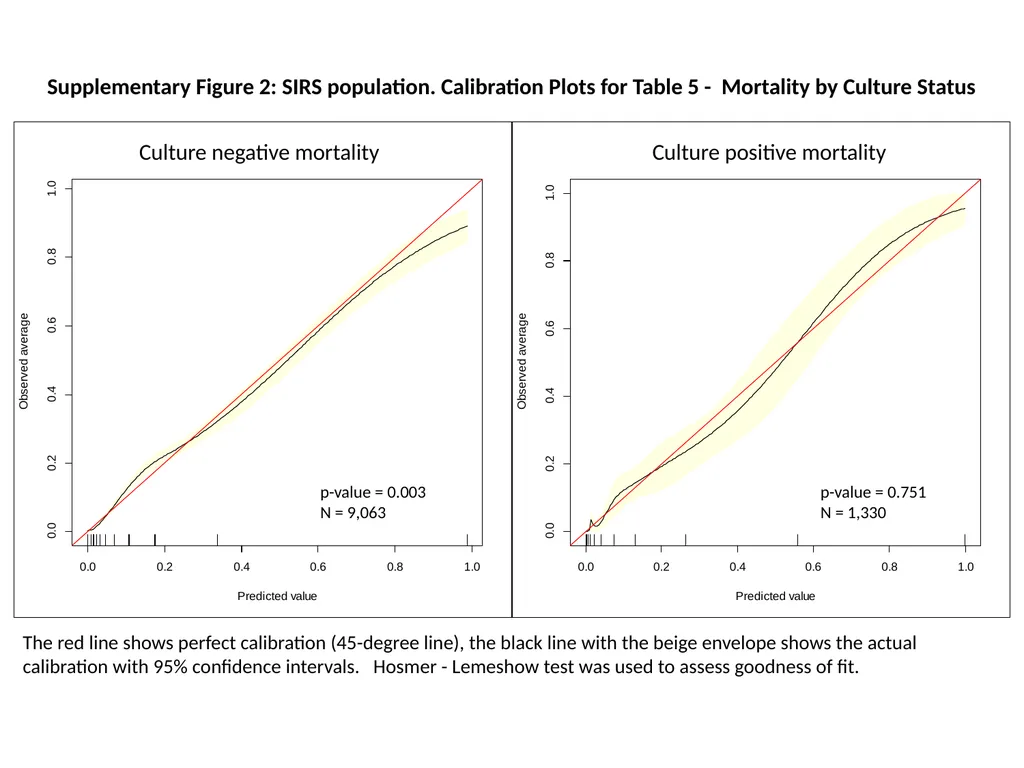
The red line shows perfect calibration (45-degree line), the black line with the beige envelope shows the actual calibration with 95 confidence intervals. Hosmer - Lemeshow test was used to assess goodness of fit. The red line shows
"The red line shows perfect calibration (45-degree" is the property of its rightful owner. Permission is granted to
download and print the materials on this website for personal, non-commercial use only, and to display it
on your personal computer provided you do not modify the materials and that you retain all copyright
notices contained in the materials. By downloading content from our website, you accept the terms of this
agreement.
Presentation Transcript
01
The red line shows perfect calibration (45-degree line), the black line with the beige envelope shows the actual calibration with 95% confidence intervals. Hosmer - Lemeshow test was used to assess goodness of fit.<br>
02
The red line shows perfect calibration (45-degree line), the black line with the beige envelope shows the actual calibration with 95% confidence intervals. Hosmer - Lemeshow test was used to assess goodness of fit.<br>
03
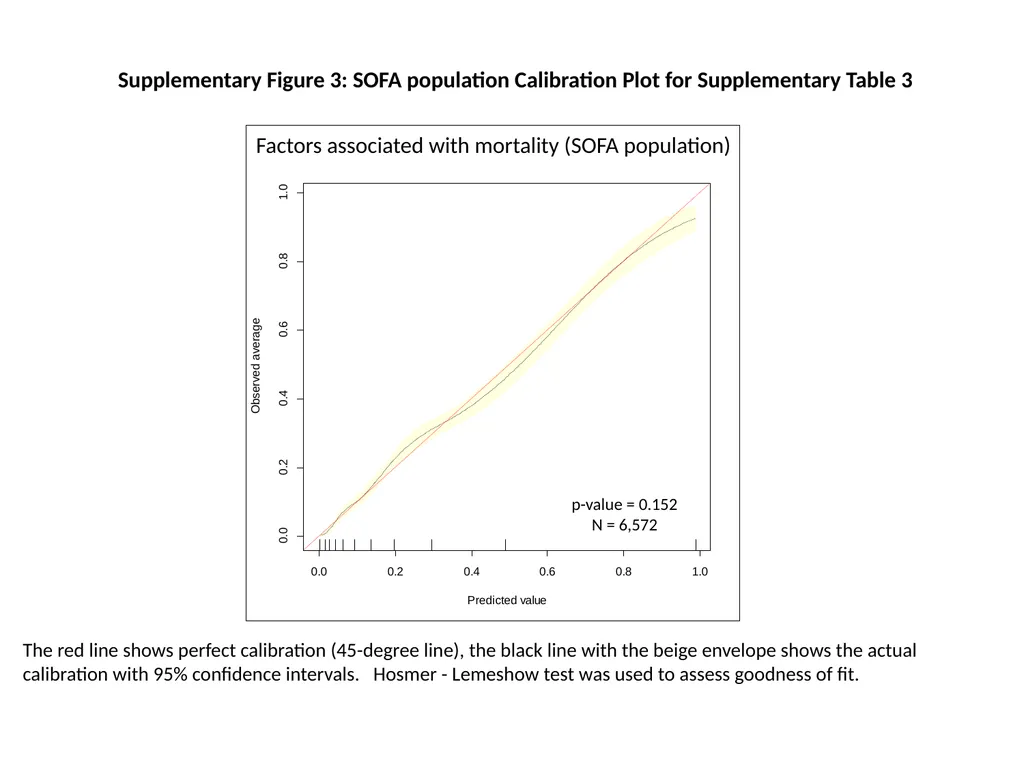
Supplementary Figure 3: SOFA population Calibration Plot for Supplementary Table 3 The red line shows perfect calibration (45-degree line), the black line with the beige envelope shows the actual calibration with 95% confidence intervals. Hosmer - Lemeshow test was used to assess goodness of fit.<br>
04
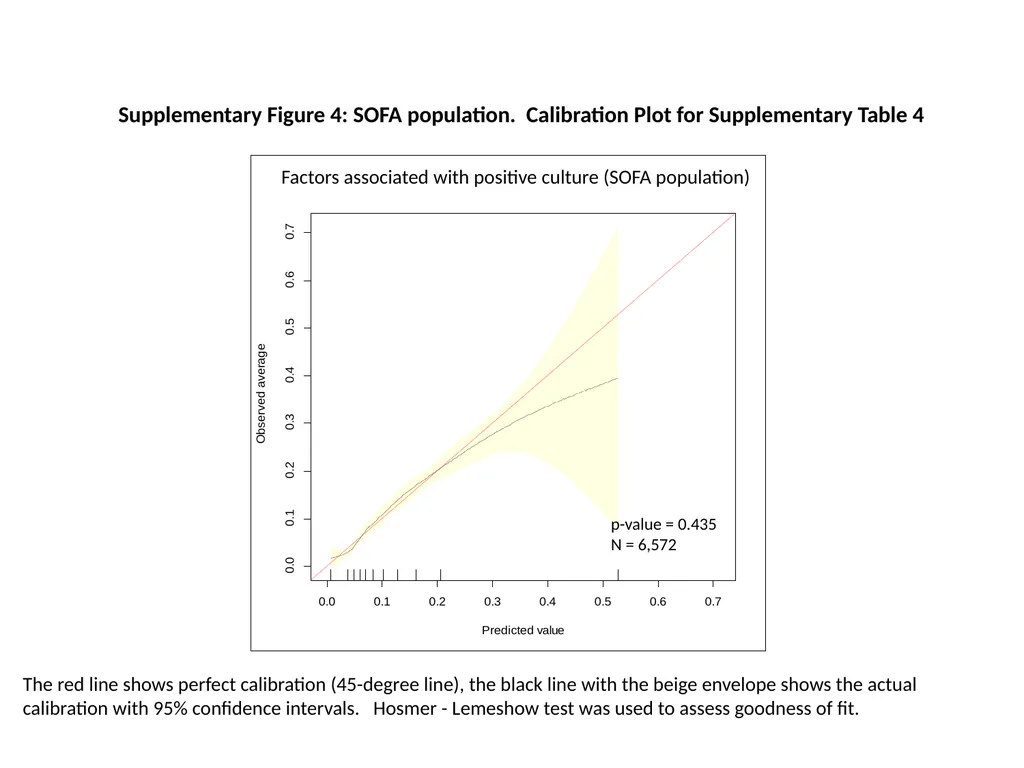
Supplementary Figure 4: SOFA population. Calibration Plot for Supplementary Table 4 The red line shows perfect calibration (45-degree line), the black line with the beige envelope shows the actual calibration with 95% confidence intervals. Hosmer - Lemeshow test was used to assess goodness of fit.<br>
05
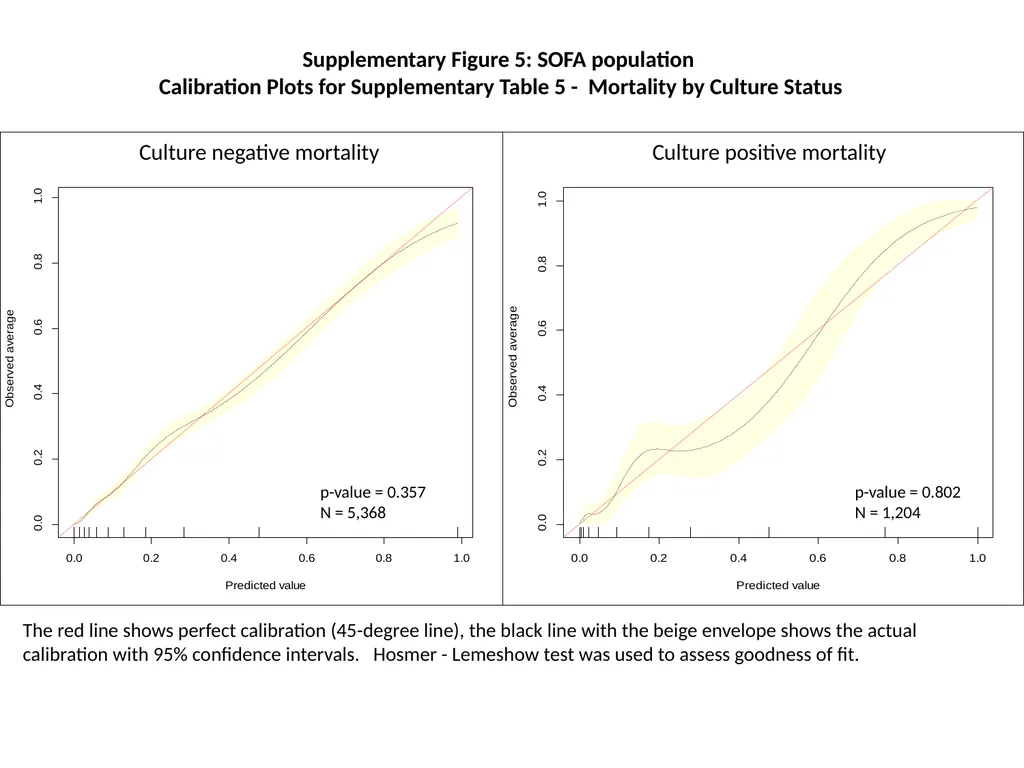
Supplementary Figure 5: SOFA population
Calibration Plots for Supplementary Table 5 - Mortality by Culture Status The red line shows perfect calibration (45-degree line), the black line with the beige envelope shows the actual calibration with 95% confidence intervals. Hosmer - Lemeshow test was used to assess goodness of fit.<br>
06
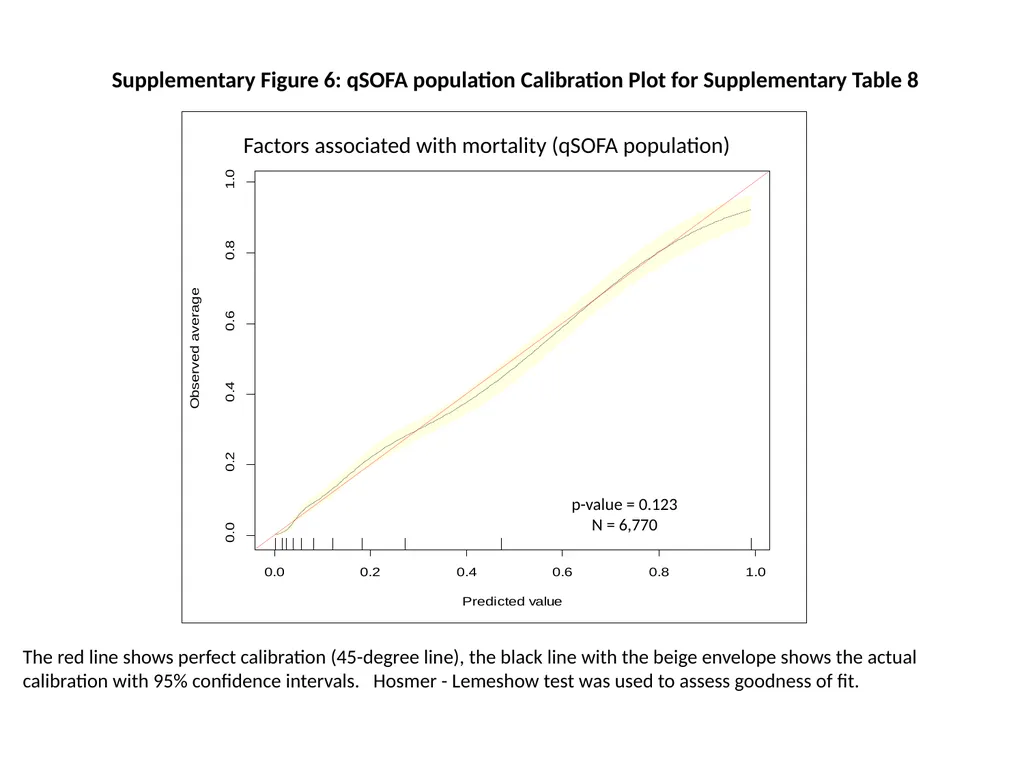
Supplementary Figure 6: qSOFA population Calibration Plot for Supplementary Table 8 The red line shows perfect calibration (45-degree line), the black line with the beige envelope shows the actual calibration with 95% confidence intervals. Hosmer - Lemeshow test was used to assess goodness of fit.<br>
07
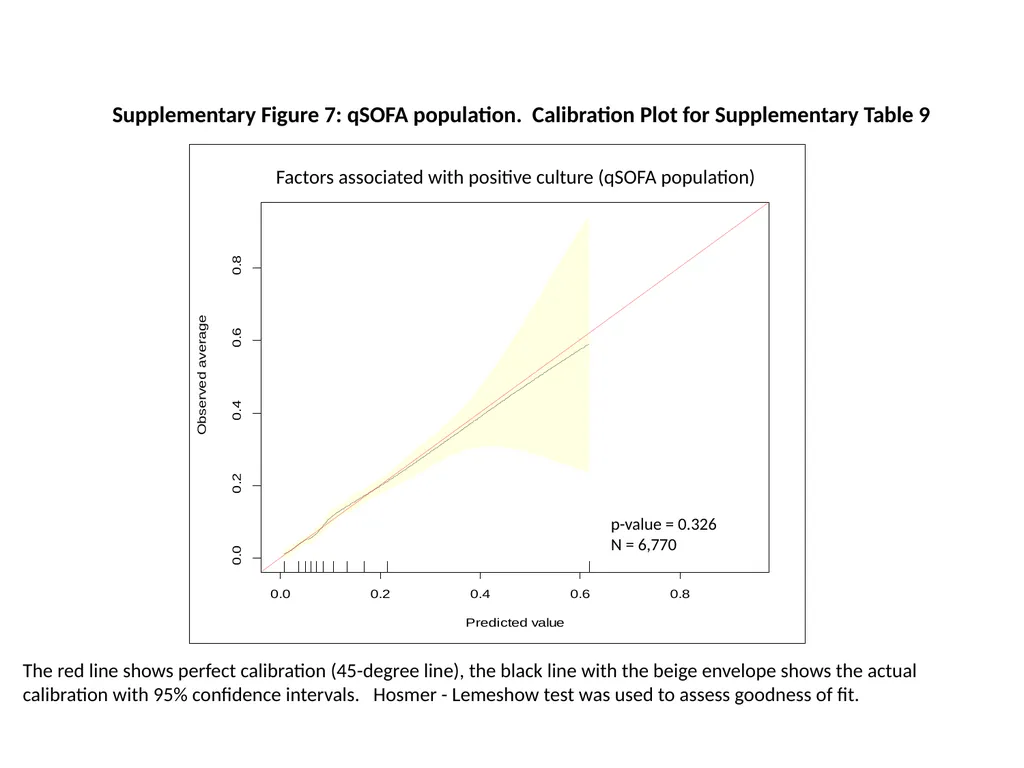
Supplementary Figure 7: qSOFA population. Calibration Plot for Supplementary Table 9 The red line shows perfect calibration (45-degree line), the black line with the beige envelope shows the actual calibration with 95% confidence intervals. Hosmer - Lemeshow test was used to assess goodness of fit.<br>
08
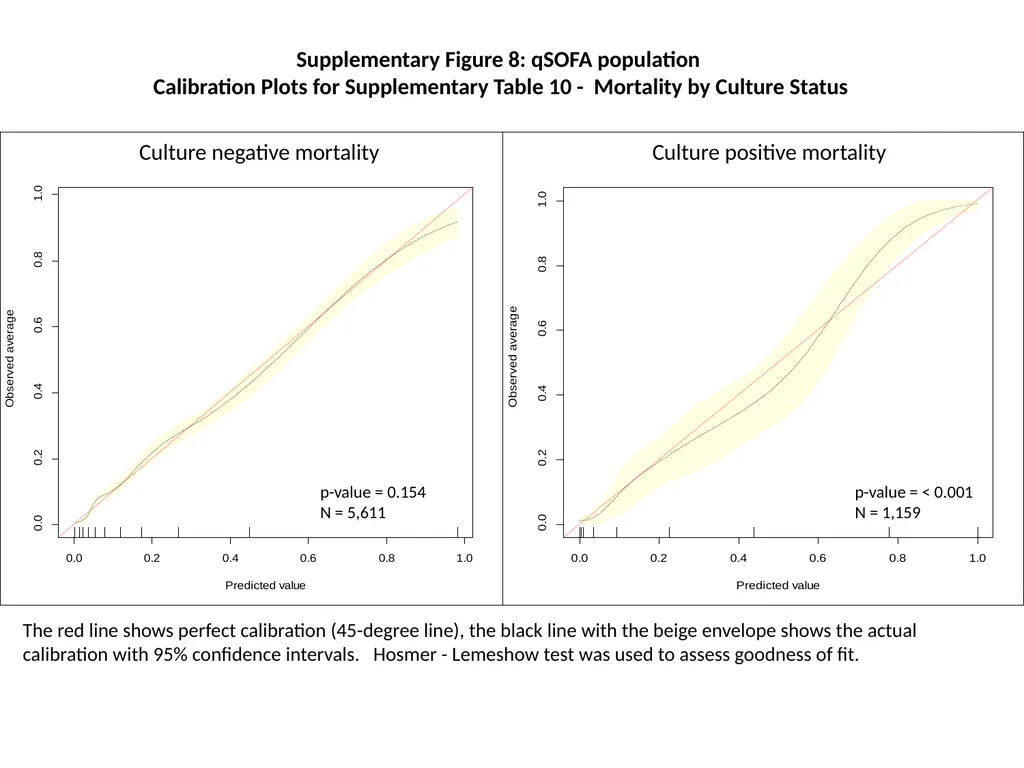
Supplementary Figure 8: qSOFA population
Calibration Plots for Supplementary Table 10 - Mortality by Culture Status The red line shows perfect calibration (45-degree line), the black line with the beige envelope shows the actual calibration with 95% confidence intervals. Hosmer - Lemeshow test was used to assess goodness of fit.<br>
09
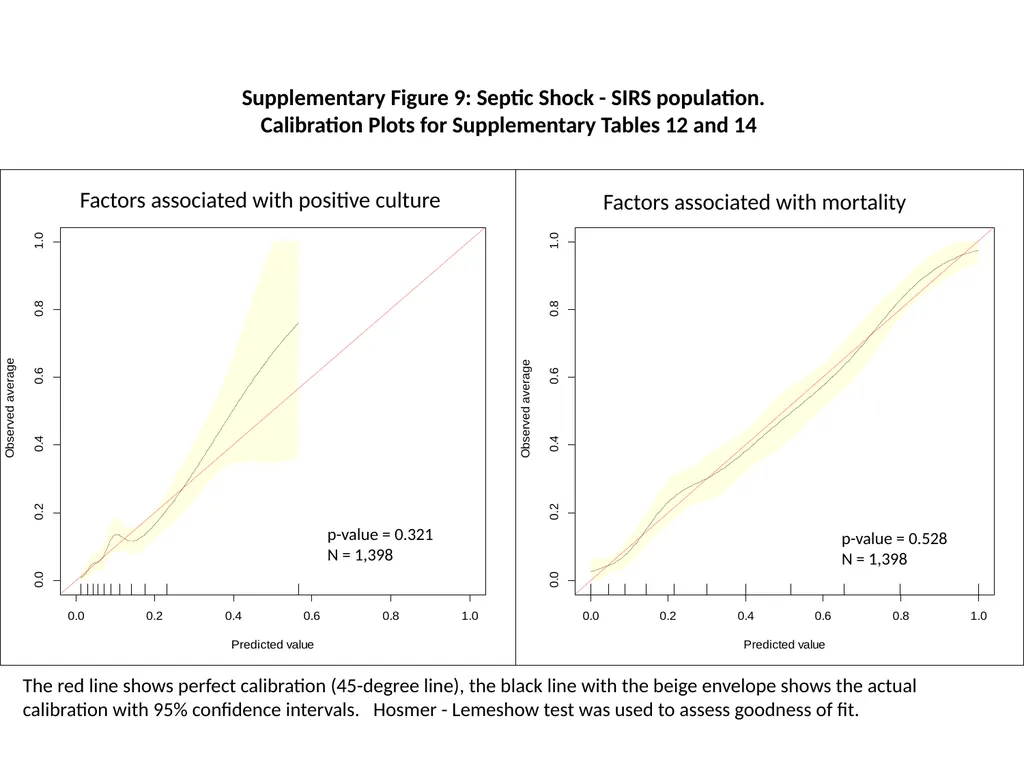
Supplementary Figure 9: Septic Shock - SIRS population.
Calibration Plots for Supplementary Tables 12 and 14 The red line shows perfect calibration (45-degree line), the black line with the beige envelope shows the actual calibration with 95% confidence intervals. Hosmer - Lemeshow test was used to assess goodness of fit.<br>
10
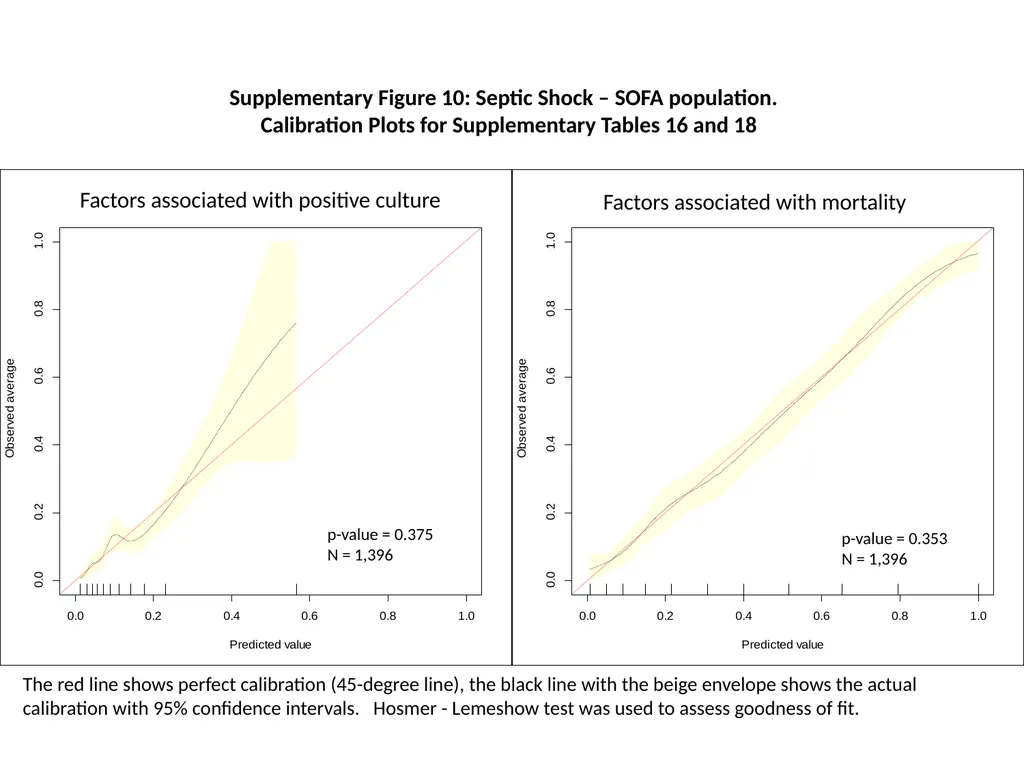
Supplementary Figure 10: Septic Shock – SOFA population.
Calibration Plots for Supplementary Tables 16 and 18 The red line shows perfect calibration (45-degree line), the black line with the beige envelope shows the actual calibration with 95% confidence intervals. Hosmer - Lemeshow test was used to assess goodness of fit.<br>
11
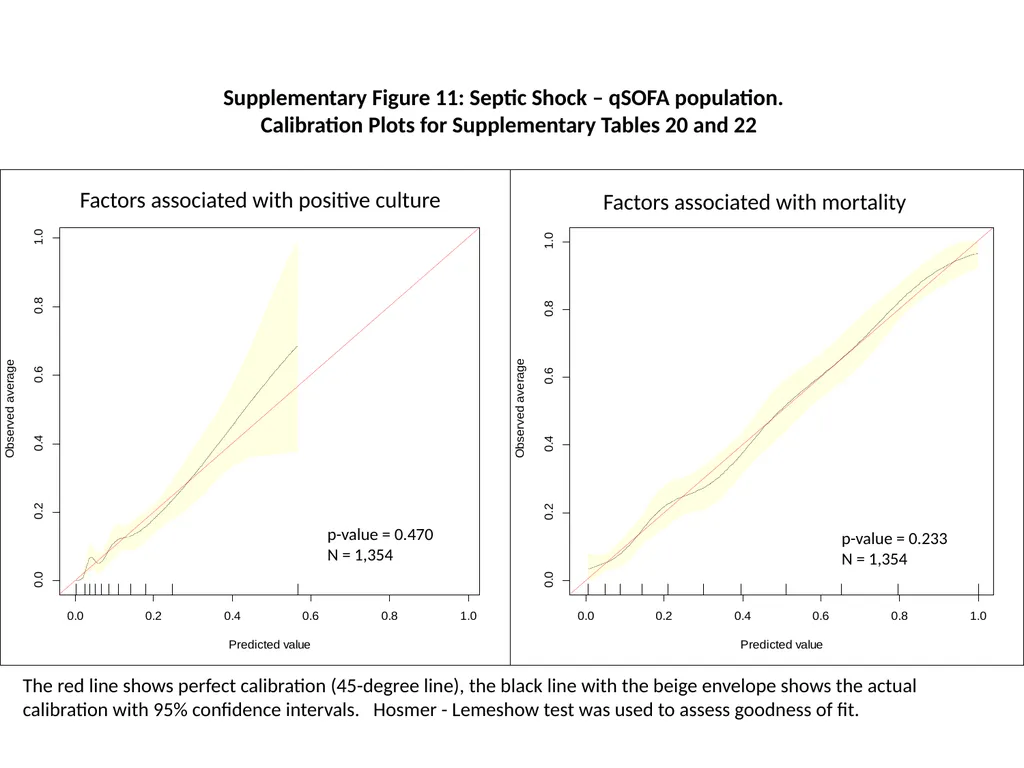
Supplementary Figure 11: Septic Shock – qSOFA population.
Calibration Plots for Supplementary Tables 20 and 22 The red line shows perfect calibration (45-degree line), the black line with the beige envelope shows the actual calibration with 95% confidence intervals. Hosmer - Lemeshow test was used to assess goodness of fit.<br>