
Topic 12: Capital Structure and Leverage Larry


Description: Topic 12: Capital Structure and Leverage Larry Schrenk, Instructor FIN 360: Corporate Finance Topics Leverage Miller-Modigliani Propositions Financial Distress, etc. Bankruptcy Capital Structure and the Pie The value of a firm is defined to
Related Topics
Download Presentation
"Topic 12: Capital Structure and Leverage Larry" is the property of its rightful owner. Permission is granted to download and print the materials on this website for personal, non-commercial use only, and to display it on your personal computer provided you do not modify the materials and that you retain all copyright notices contained in the materials. By downloading content from our website, you accept the terms of this agreement.
Presentation Transcript
slide1. Topic 12: Capital Structure and Leverage
Larry Schrenk, Instructor FIN 360: Corporate Finance<br>
slide2. Topics Leverage
Miller-Modigliani Propositions
Financial Distress, etc.
Bankruptcy<br>
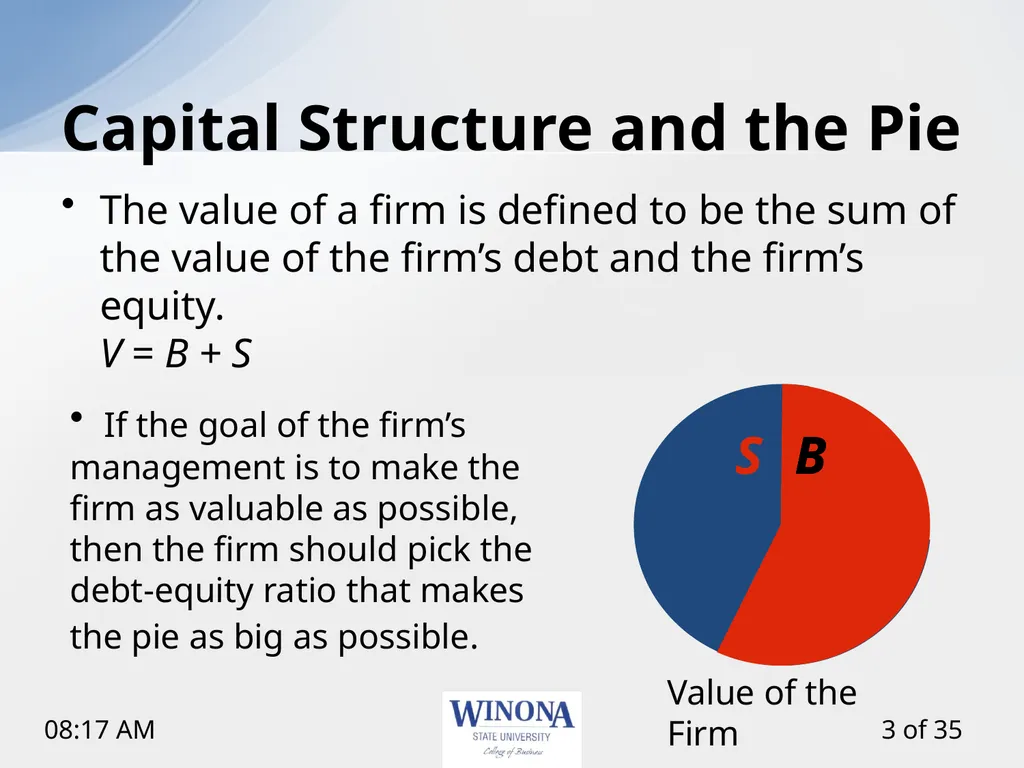
slide3. Capital Structure and the Pie The value of a firm is defined to be the sum of the value of the firm’s debt and the firm’s equity.
V = B + S If the goal of the firm’s management is to make the firm as valuable as possible, then the firm should pick the debt-equity ratio that makes the pie as big as possible. Value of the Firm S B S B<br>
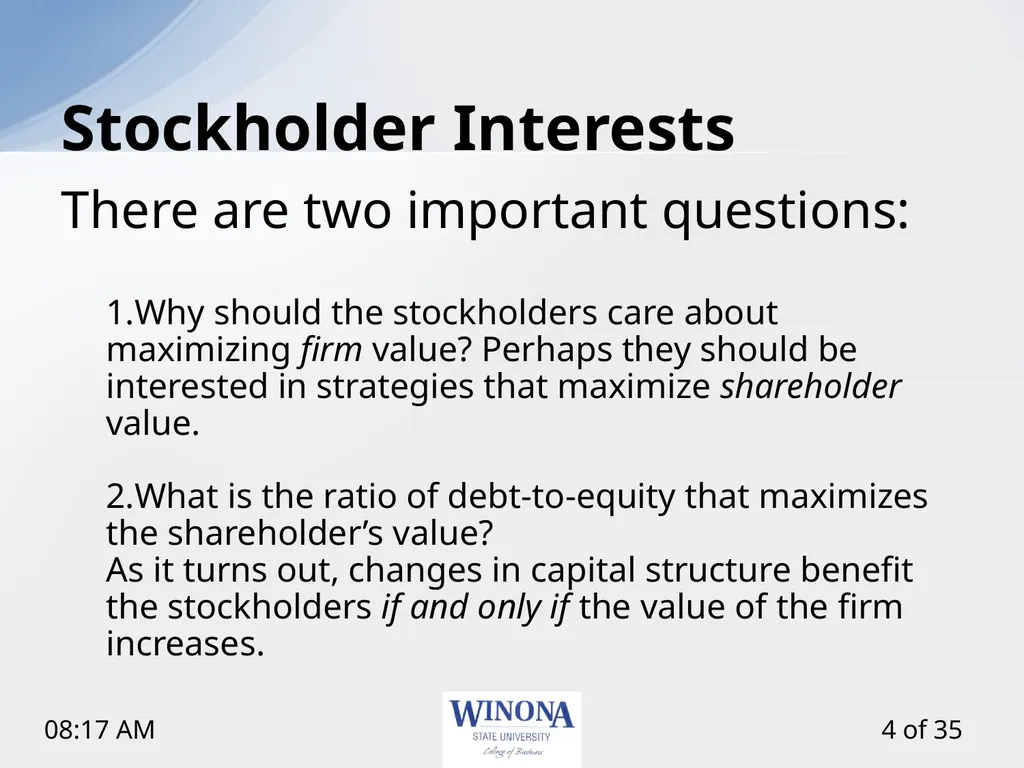
slide4. Stockholder Interests There are two important questions:
Why should the stockholders care about maximizing firm value? Perhaps they should be interested in strategies that maximize shareholder value.
What is the ratio of debt-to-equity that maximizes the shareholder’s value?
As it turns out, changes in capital structure benefit the stockholders if and only if the value of the firm increases.<br>
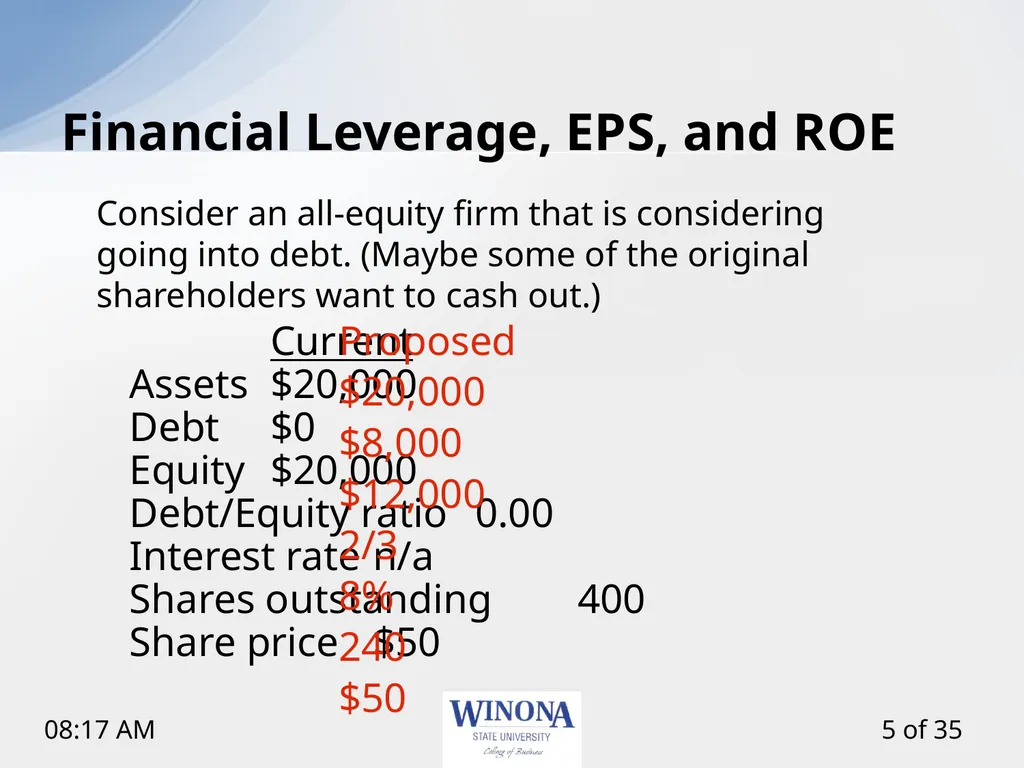
slide5. Financial Leverage, EPS, and ROE Current
Assets $20,000
Debt $0
Equity $20,000
Debt/Equity ratio 0.00
Interest rate n/a
Shares outstanding 400
Share price $50 Proposed
$20,000
$8,000
$12,000
2/3
8%
240
$50 Consider an all-equity firm that is considering going into debt. (Maybe some of the original shareholders want to cash out.)<br>
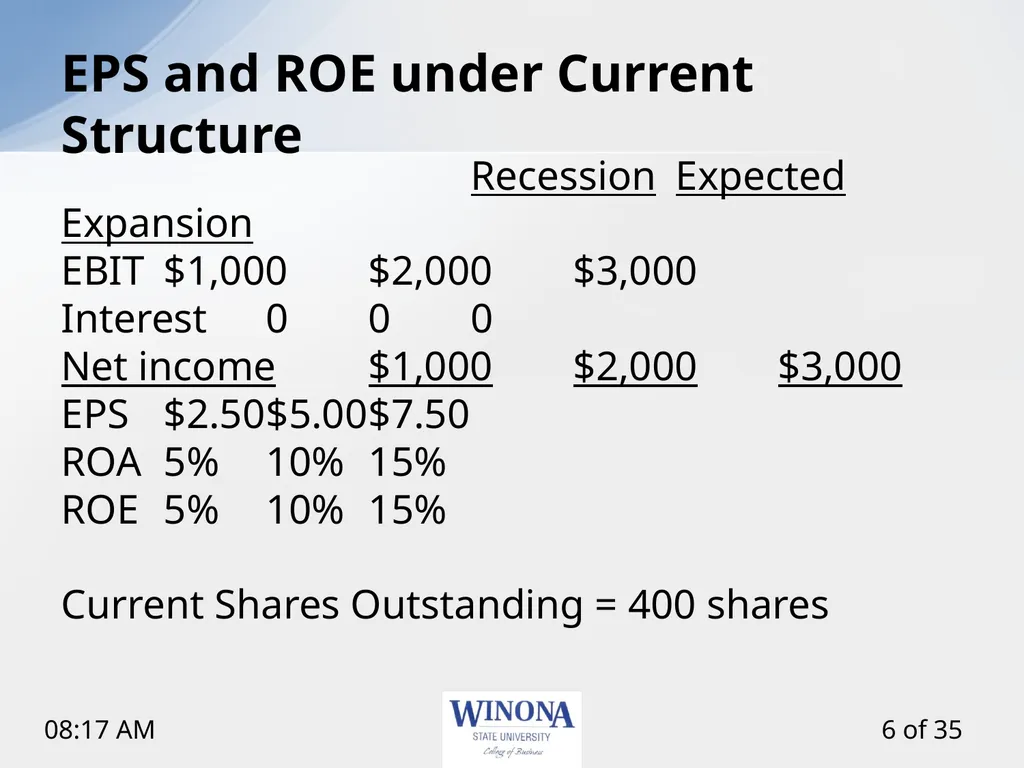
slide6. EPS and ROE under Current Structure Recession Expected Expansion
EBIT $1,000 $2,000 $3,000
Interest 0 0 0
Net income $1,000 $2,000 $3,000
EPS $2.50 $5.00 $7.50
ROA 5% 10% 15%
ROE 5% 10% 15%
Current Shares Outstanding = 400 shares<br>
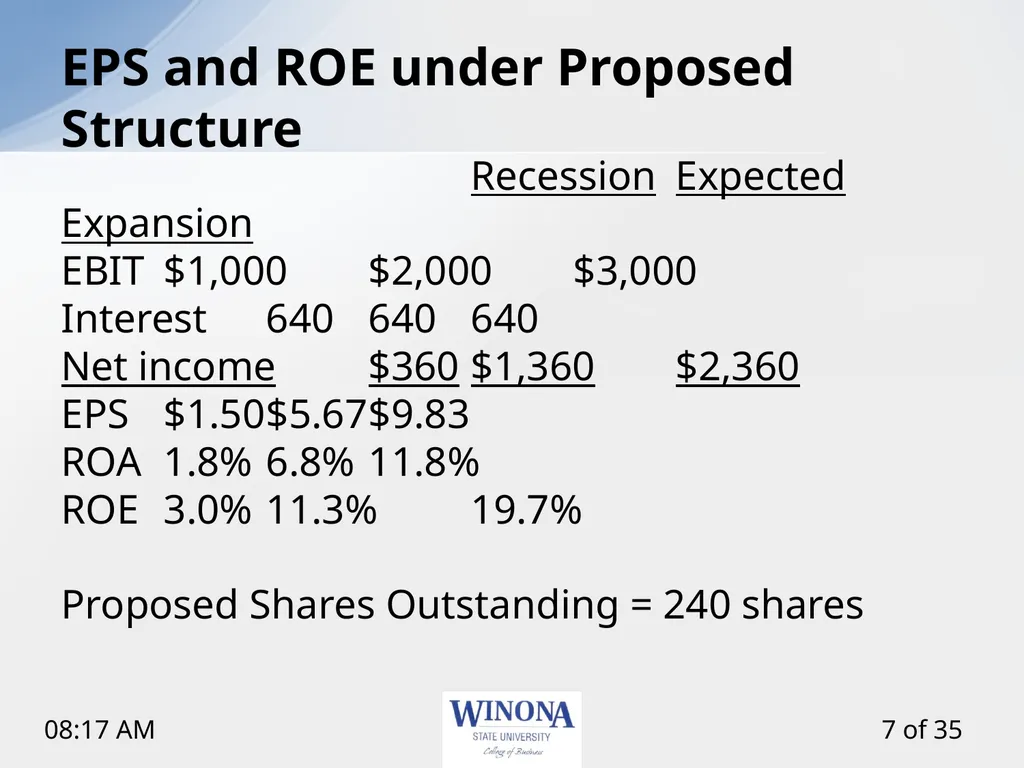
slide7. EPS and ROE under Proposed Structure Recession Expected Expansion
EBIT $1,000 $2,000 $3,000
Interest 640 640 640
Net income $360 $1,360 $2,360
EPS $1.50 $5.67 $9.83
ROA 1.8% 6.8% 11.8%
ROE 3.0% 11.3% 19.7%
Proposed Shares Outstanding = 240 shares<br>
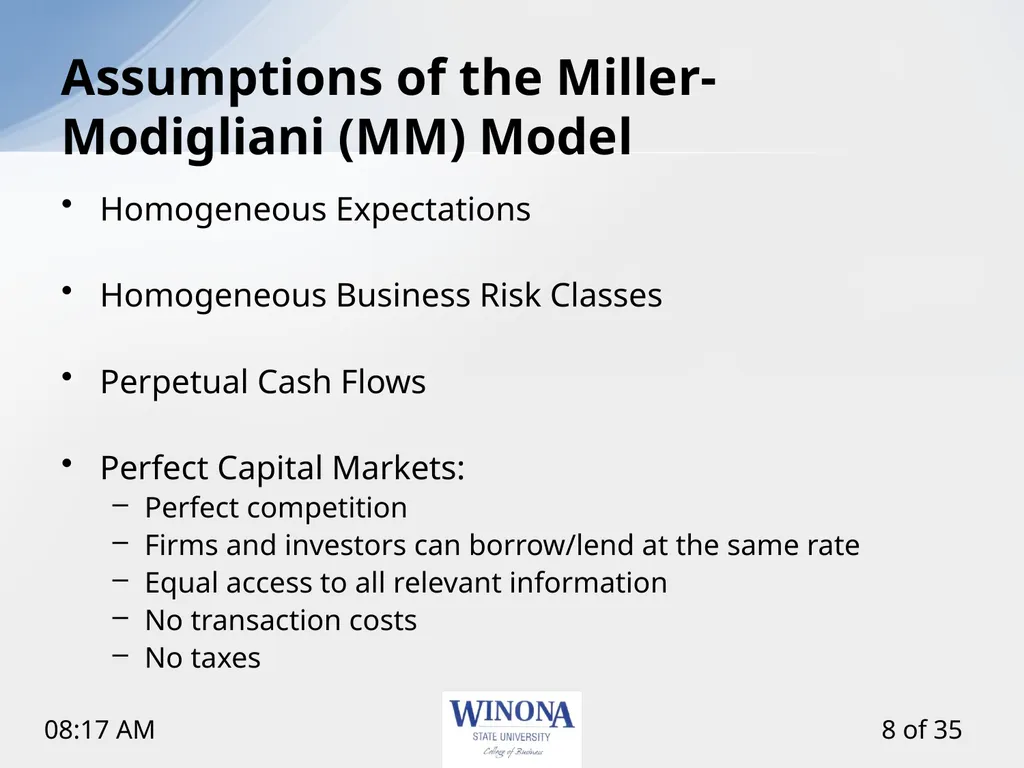
slide8. Assumptions of the Miller-Modigliani (MM) Model Homogeneous Expectations
Homogeneous Business Risk Classes
Perpetual Cash Flows
Perfect Capital Markets:
Perfect competition
Firms and investors can borrow/lend at the same rate
Equal access to all relevant information
No transaction costs
No taxes<br>
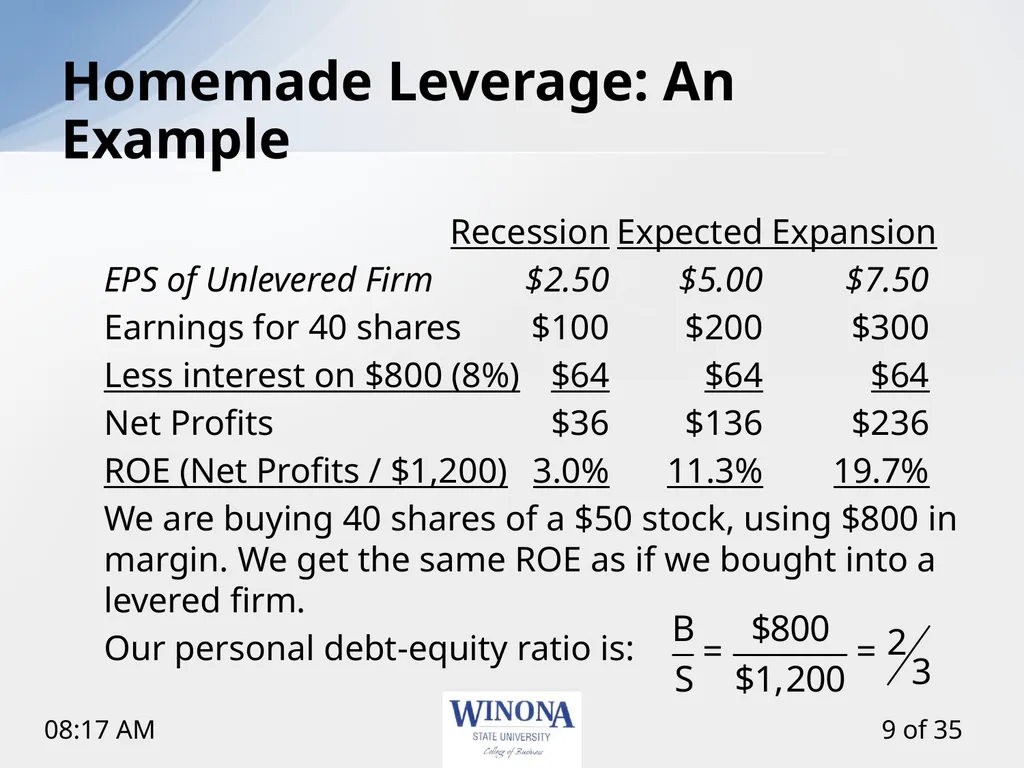
slide9. Homemade Leverage: An Example Recession Expected Expansion
EPS of Unlevered Firm $2.50 $5.00 $7.50
Earnings for 40 shares $100 $200 $300
Less interest on $800 (8%) $64 $64 $64
Net Profits $36 $136 $236
ROE (Net Profits / $1,200) 3.0% 11.3% 19.7%
We are buying 40 shares of a $50 stock, using $800 in margin. We get the same ROE as if we bought into a levered firm.
Our personal debt-equity ratio is:<br>
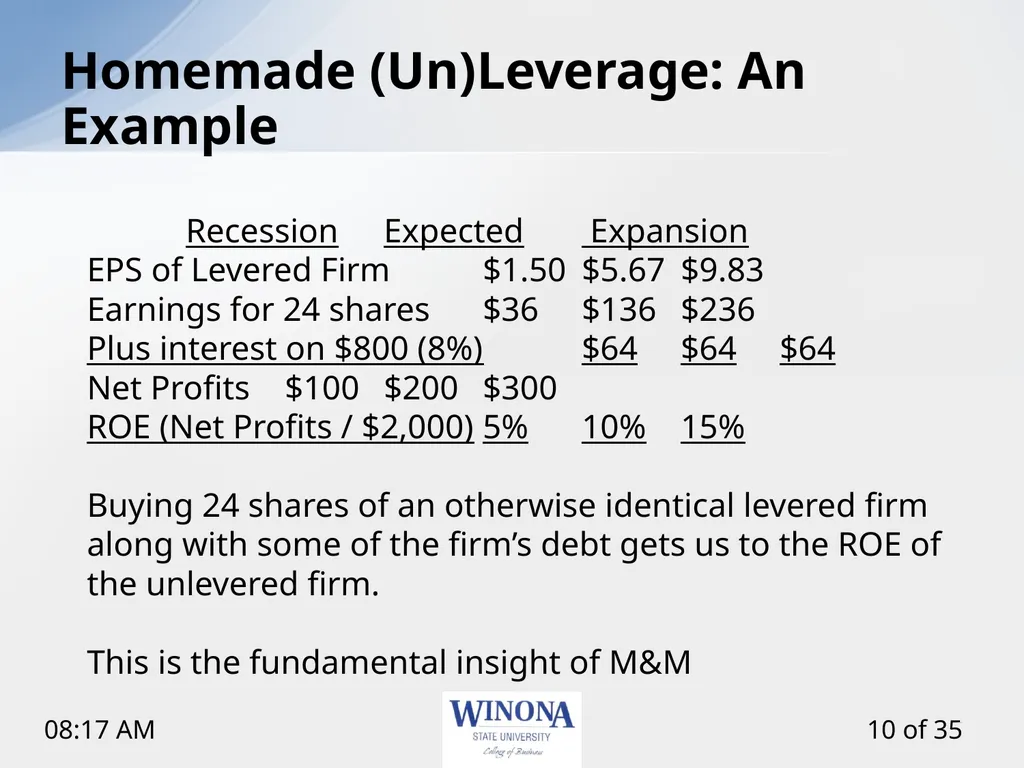
slide10. Homemade (Un)Leverage: An Example Recession Expected Expansion
EPS of Levered Firm $1.50 $5.67 $9.83
Earnings for 24 shares $36 $136 $236
Plus interest on $800 (8%) $64 $64 $64
Net Profits $100 $200 $300
ROE (Net Profits / $2,000) 5% 10% 15%
Buying 24 shares of an otherwise identical levered firm along with some of the firm’s debt gets us to the ROE of the unlevered firm.
This is the fundamental insight of M&M<br>
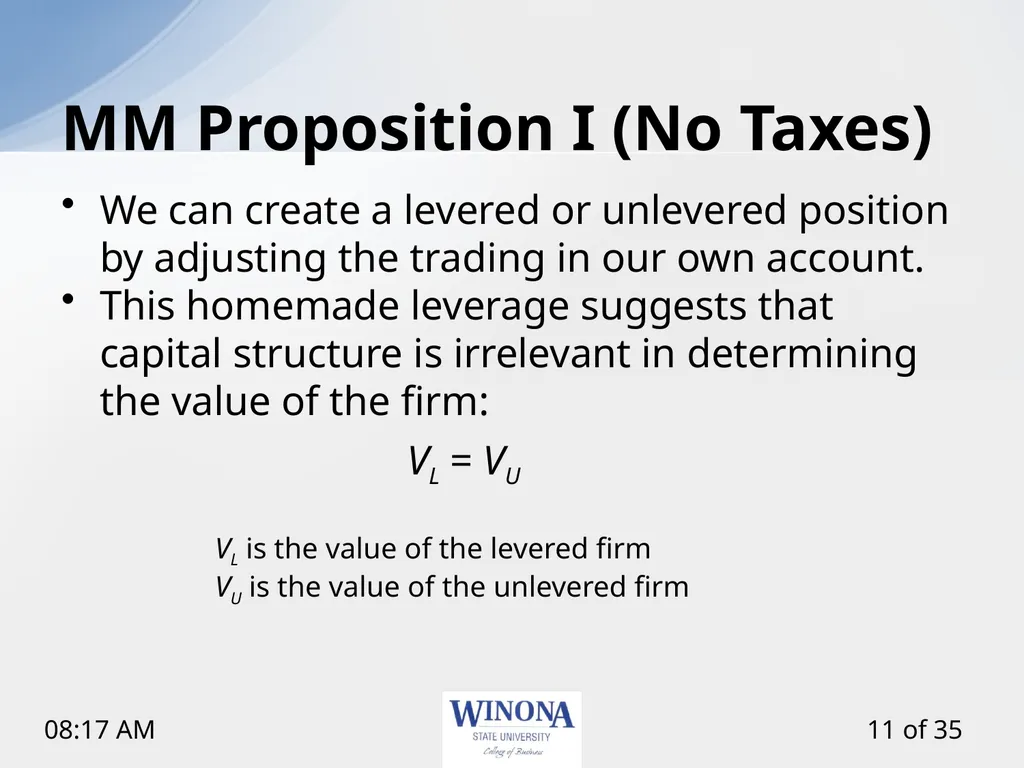
slide11. MM Proposition I (No Taxes) We can create a levered or unlevered position by adjusting the trading in our own account.
This homemade leverage suggests that capital structure is irrelevant in determining the value of the firm:
VL = VU
VL is the value of the levered firm
VU is the value of the unlevered firm<br>
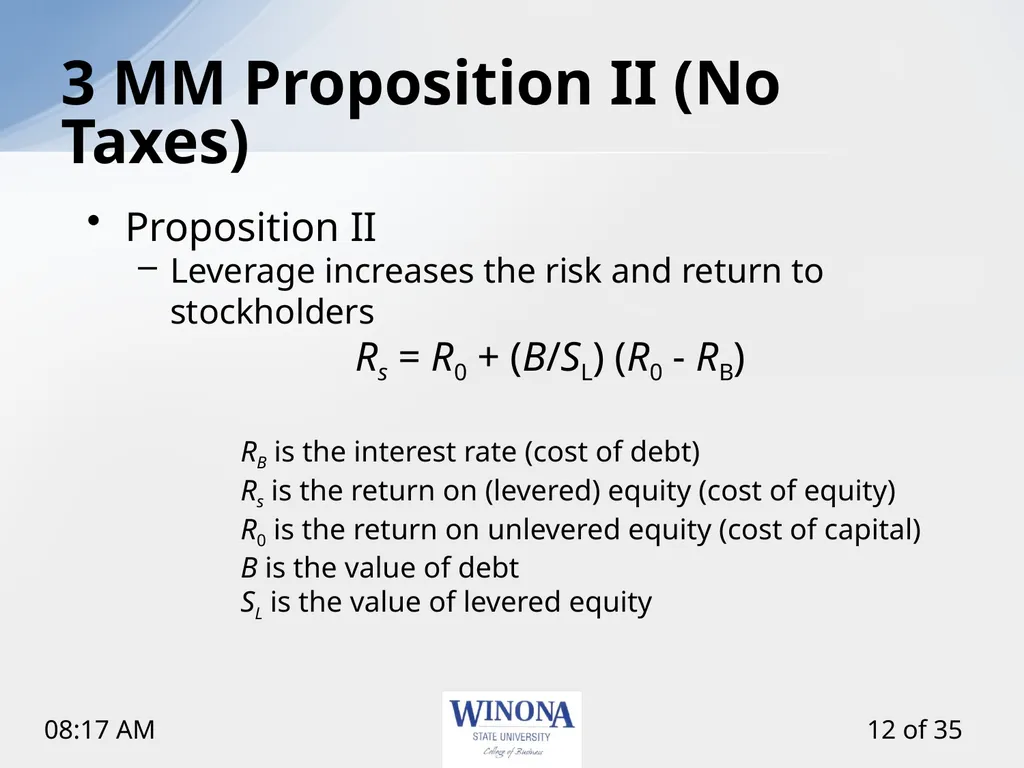
slide12. 3 MM Proposition II (No Taxes) Proposition II
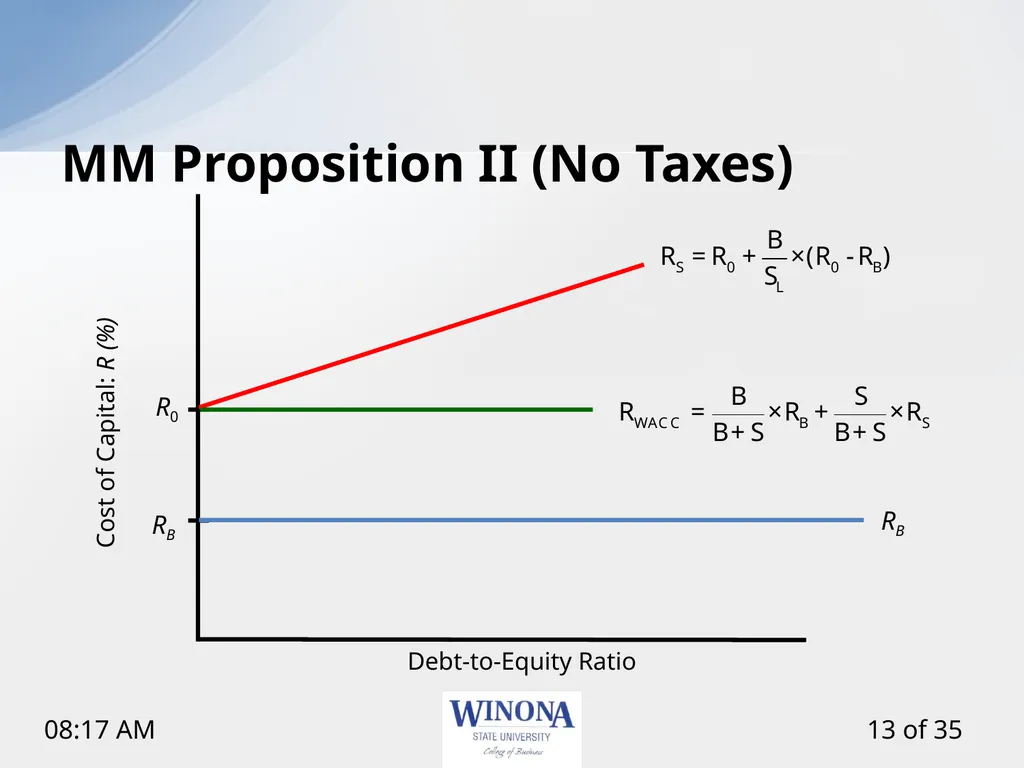
Leverage increases the risk and return to stockholders
Rs = R0 + (B/SL) (R0 - RB)
RB is the interest rate (cost of debt)
Rs is the return on (levered) equity (cost of equity)
R0 is the return on unlevered equity (cost of capital)
B is the value of debt
SL is the value of levered equity<br>
slide13. MM Proposition II (No Taxes) Debt-to-Equity Ratio Cost of Capital: R (%) R0 RB RB<br>
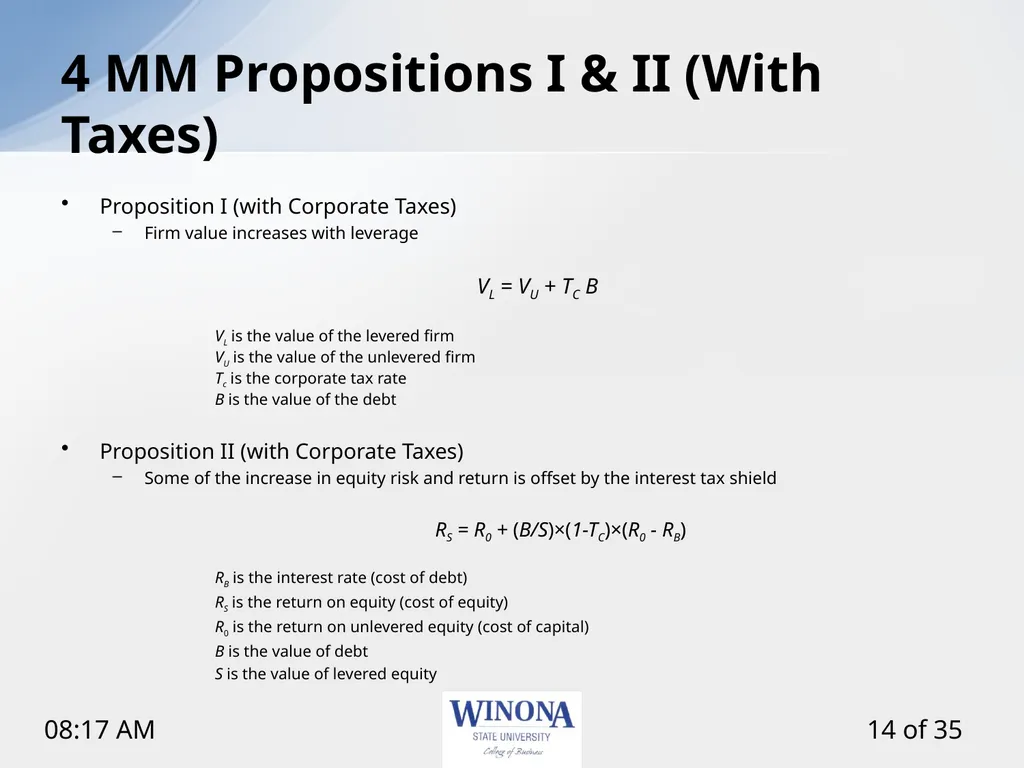
slide14. 4 MM Propositions I & II (With Taxes) Proposition I (with Corporate Taxes)
Firm value increases with leverage
VL = VU + TC B
VL is the value of the levered firm
VU is the value of the unlevered firm
Tc is the corporate tax rate
B is the value of the debt
Proposition II (with Corporate Taxes)
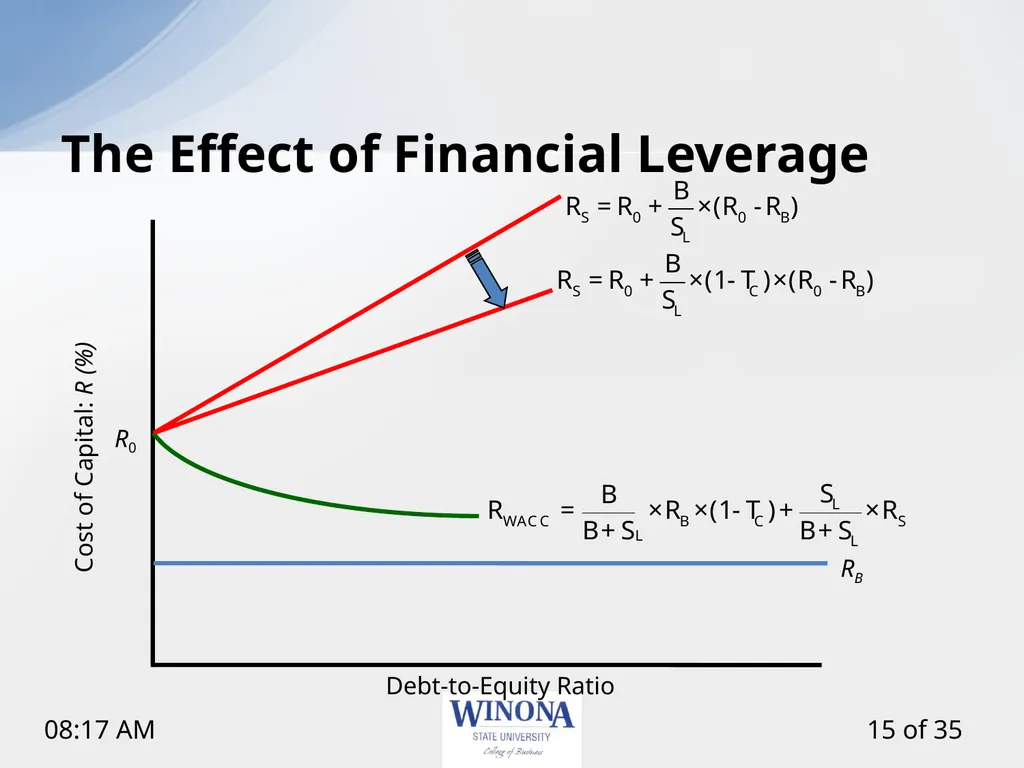
Some of the increase in equity risk and return is offset by the interest tax shield
RS = R0 + (B/S)×(1-TC)×(R0 - RB)
RB is the interest rate (cost of debt)
RS is the return on equity (cost of equity)
R0 is the return on unlevered equity (cost of capital)
B is the value of debt
S is the value of levered equity<br>
slide15. The Effect of Financial Leverage R0 RB Debt-to-Equity Ratio Cost of Capital: R (%)<br>
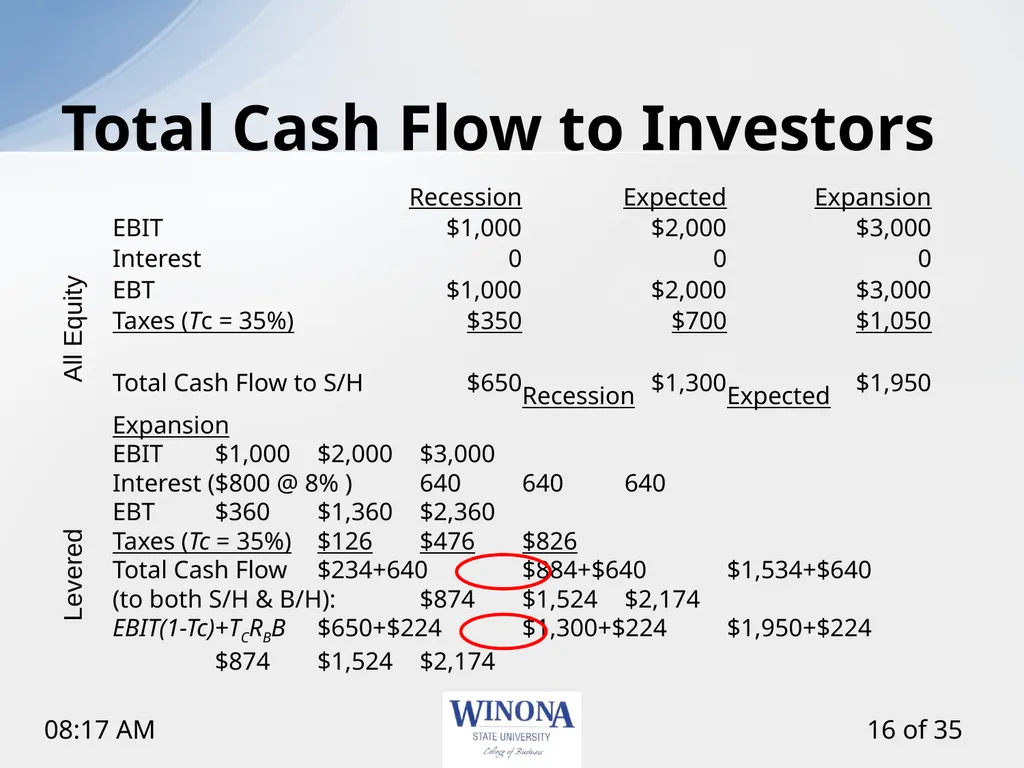
slide16. Total Cash Flow to Investors Recession Expected Expansion
EBIT $1,000 $2,000 $3,000
Interest 0 0 0
EBT $1,000 $2,000 $3,000
Taxes (Tc = 35%) $350 $700 $1,050
Total Cash Flow to S/H $650 $1,300 $1,950 Recession Expected Expansion
EBIT $1,000 $2,000 $3,000
Interest ($800 @ 8% ) 640 640 640
EBT $360 $1,360 $2,360
Taxes (Tc = 35%) $126 $476 $826
Total Cash Flow $234+640 $884+$640 $1,534+$640
(to both S/H & B/H): $874 $1,524 $2,174
EBIT(1-Tc)+TCRBB $650+$224 $1,300+$224 $1,950+$224
$874 $1,524 $2,174 All Equity Levered<br>
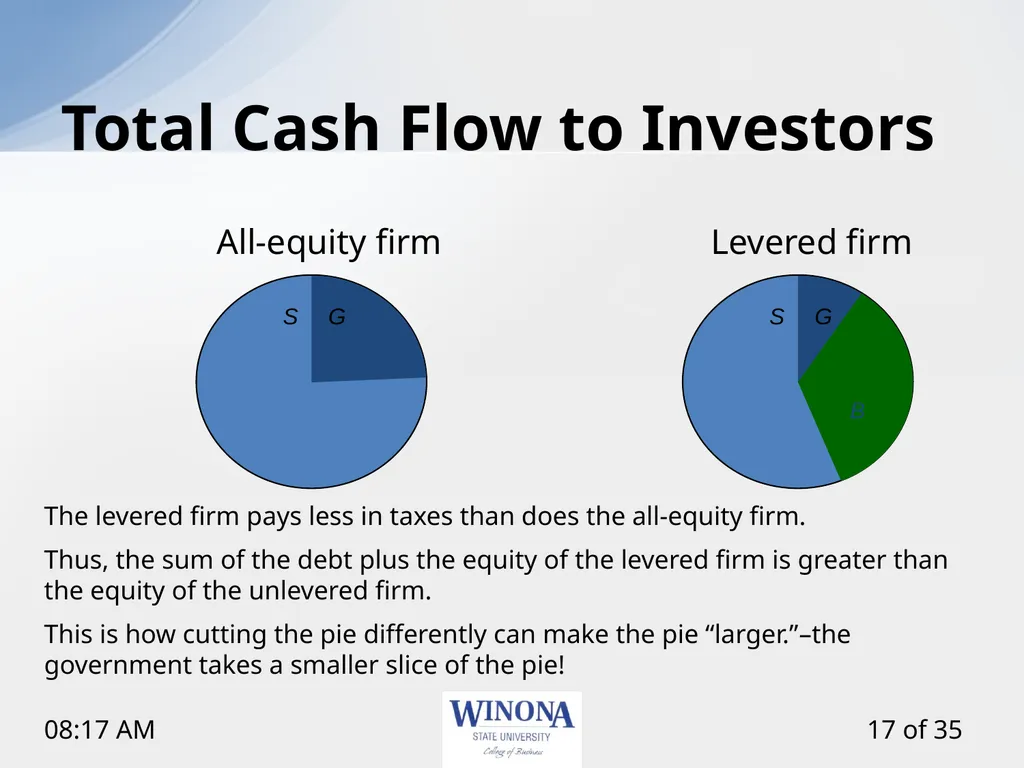
slide17. Total Cash Flow to Investors The levered firm pays less in taxes than does the all-equity firm.
Thus, the sum of the debt plus the equity of the levered firm is greater than the equity of the unlevered firm.
This is how cutting the pie differently can make the pie “larger.”–the government takes a smaller slice of the pie! S G S G B All-equity firm Levered firm<br>
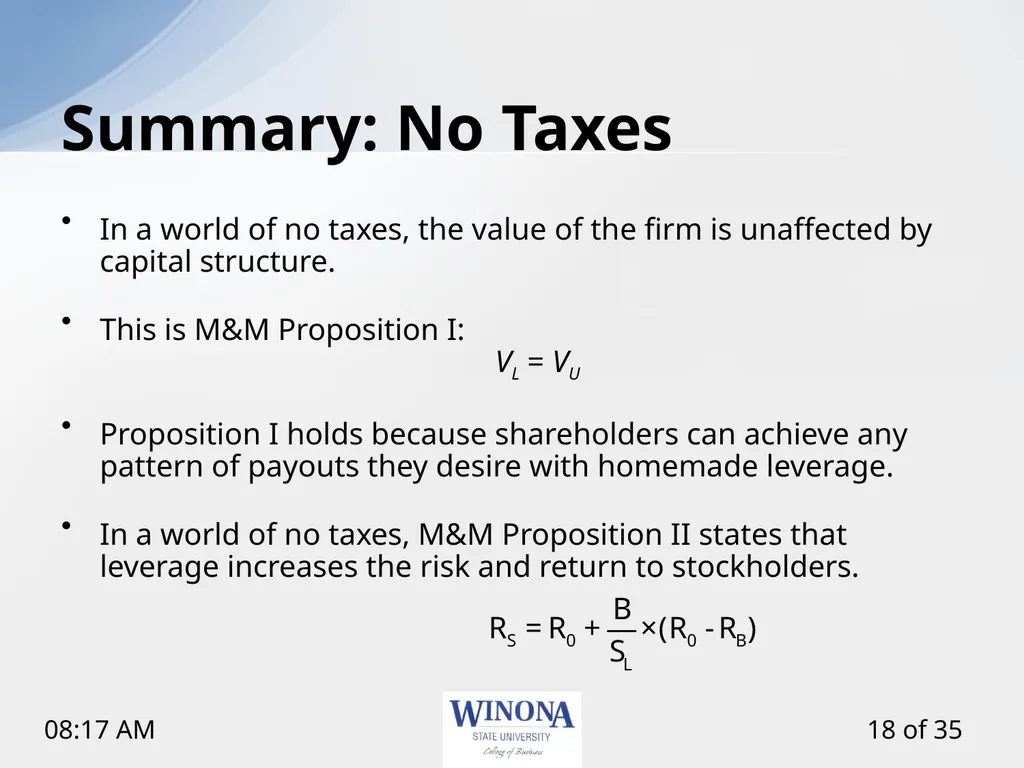
slide18. Summary: No Taxes In a world of no taxes, the value of the firm is unaffected by capital structure.
This is M&M Proposition I:
VL = VU
Proposition I holds because shareholders can achieve any pattern of payouts they desire with homemade leverage.
In a world of no taxes, M&M Proposition II states that leverage increases the risk and return to stockholders.<br>
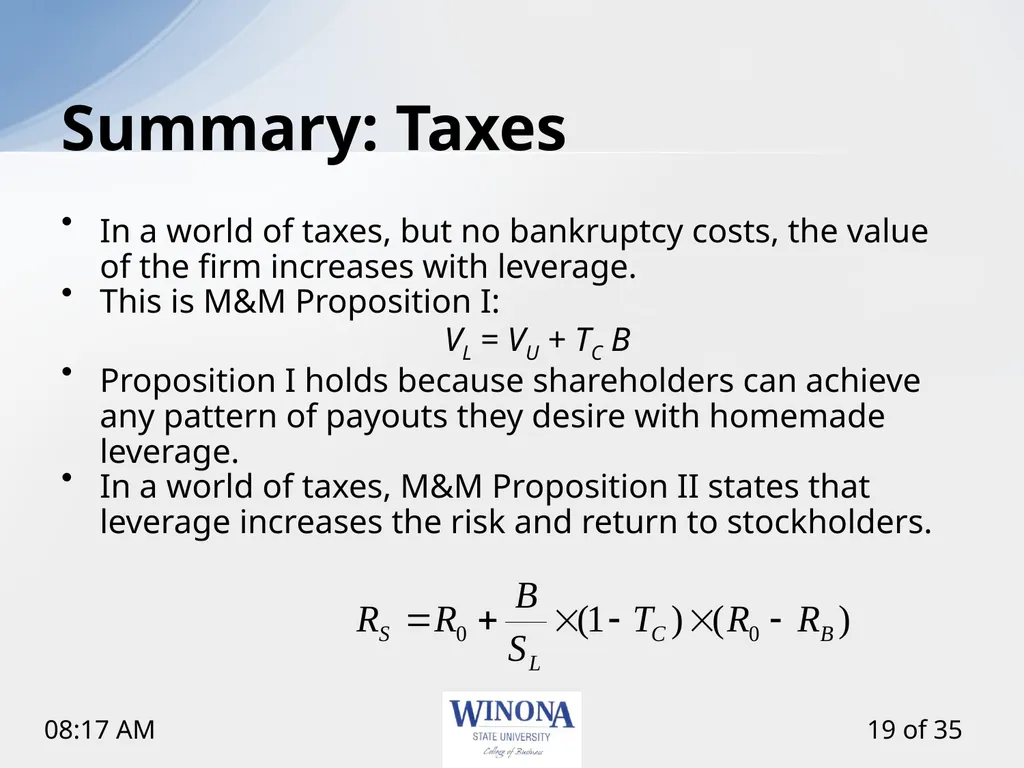
slide19. Summary: Taxes In a world of taxes, but no bankruptcy costs, the value of the firm increases with leverage.
This is M&M Proposition I:
VL = VU + TC B
Proposition I holds because shareholders can achieve any pattern of payouts they desire with homemade leverage.
In a world of taxes, M&M Proposition II states that leverage increases the risk and return to stockholders.<br>
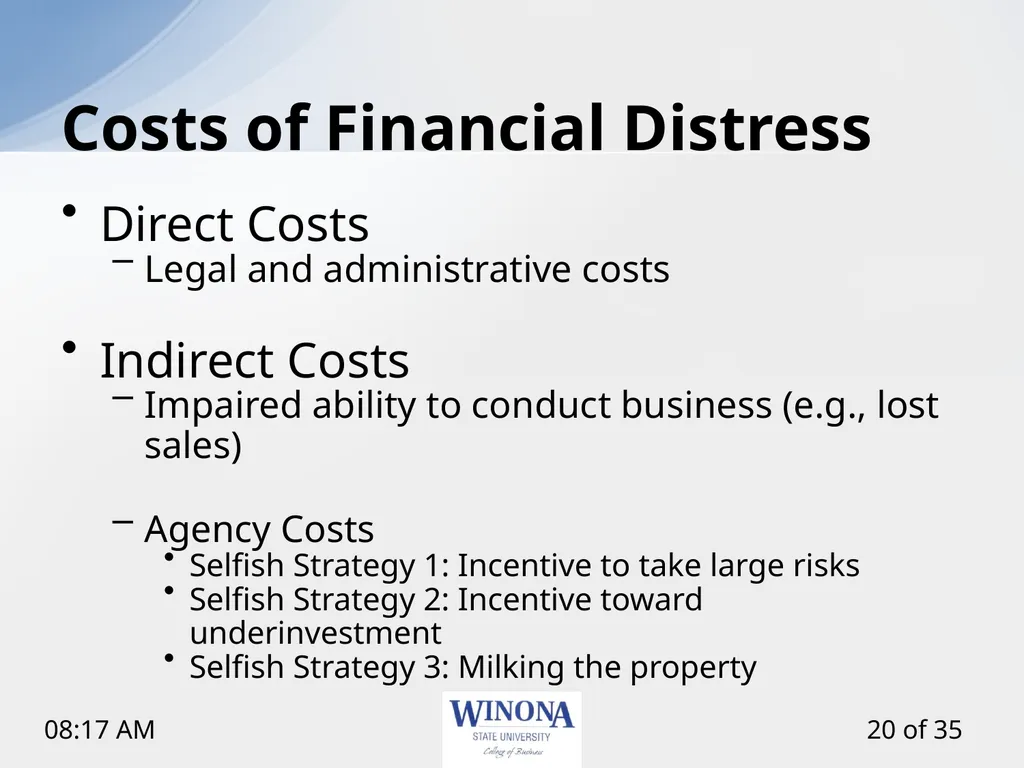
slide20. Costs of Financial Distress Direct Costs
Legal and administrative costs
Indirect Costs
Impaired ability to conduct business (e.g., lost sales)
Agency Costs
Selfish Strategy 1: Incentive to take large risks
Selfish Strategy 2: Incentive toward underinvestment
Selfish Strategy 3: Milking the property<br>
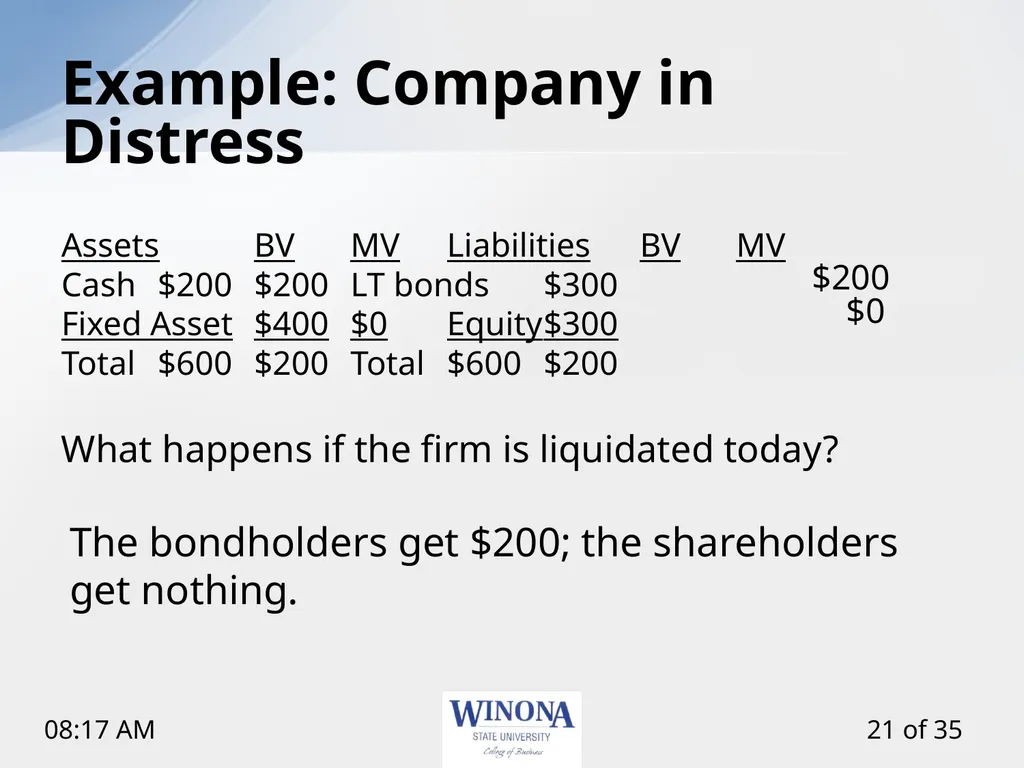
slide21. Example: Company in Distress Assets BV MV Liabilities BV MV
Cash $200 $200 LT bonds $300
Fixed Asset $400 $0 Equity $300
Total $600 $200 Total $600 $200
What happens if the firm is liquidated today? The bondholders get $200; the shareholders get nothing. $200 $0<br>
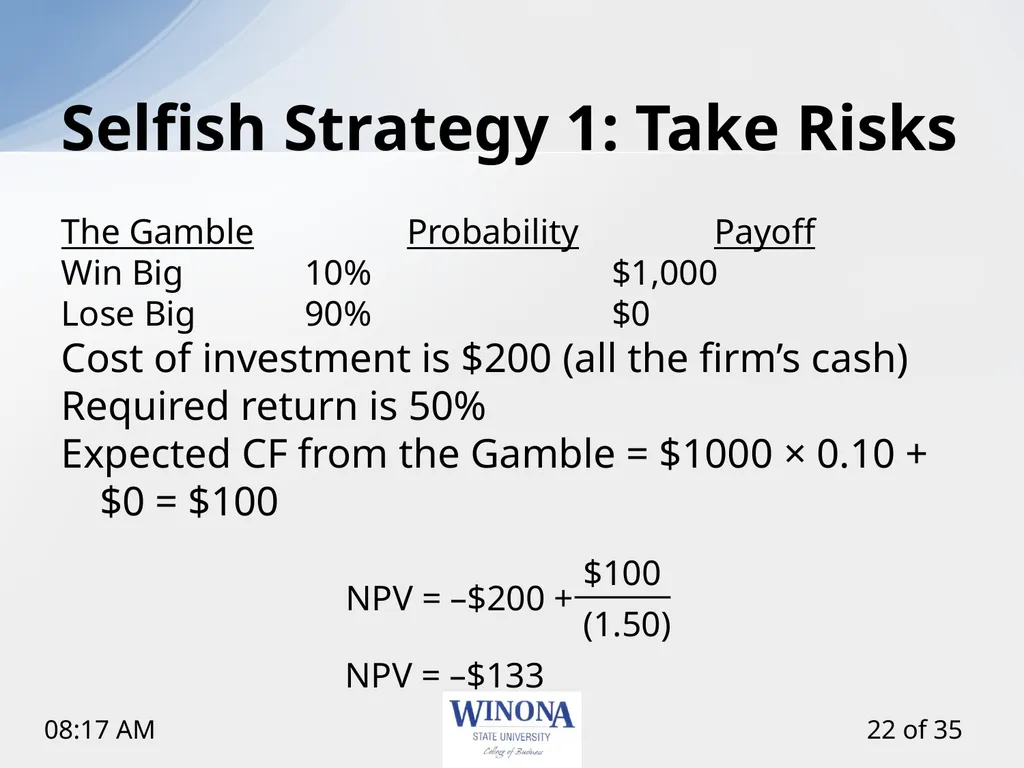
slide22. Selfish Strategy 1: Take Risks The Gamble Probability Payoff
Win Big 10% $1,000
Lose Big 90% $0
Cost of investment is $200 (all the firm’s cash)
Required return is 50%
Expected CF from the Gamble = $1000 × 0.10 + $0 = $100 NPV = –$133<br>
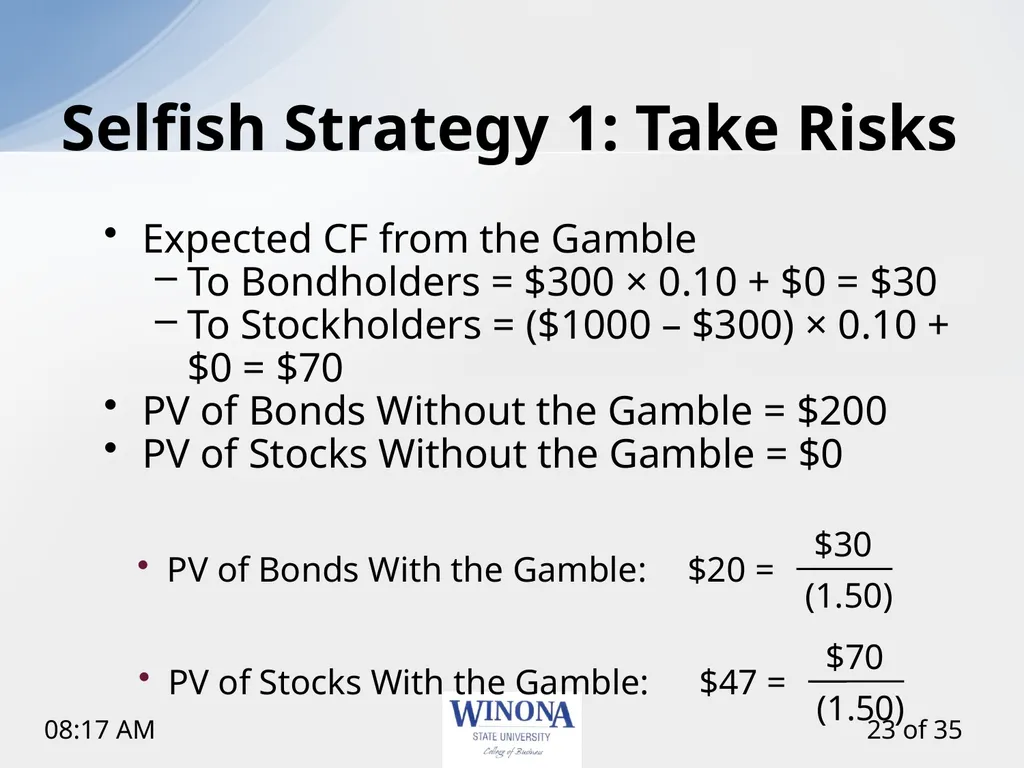
slide23. Selfish Strategy 1: Take Risks Expected CF from the Gamble
To Bondholders = $300 × 0.10 + $0 = $30
To Stockholders = ($1000 – $300) × 0.10 + $0 = $70
PV of Bonds Without the Gamble = $200
PV of Stocks Without the Gamble = $0<br>
slide24. Consider a government-sponsored project that guarantees $350 in one period.
Cost of investment is $300 (the firm only has $200 now), so the stockholders will have to supply an additional $100 to finance the project.
Required return is 10%. Should we accept or reject? NPV = $18.18 Selfish Strategy 2: Underinvestment<br>
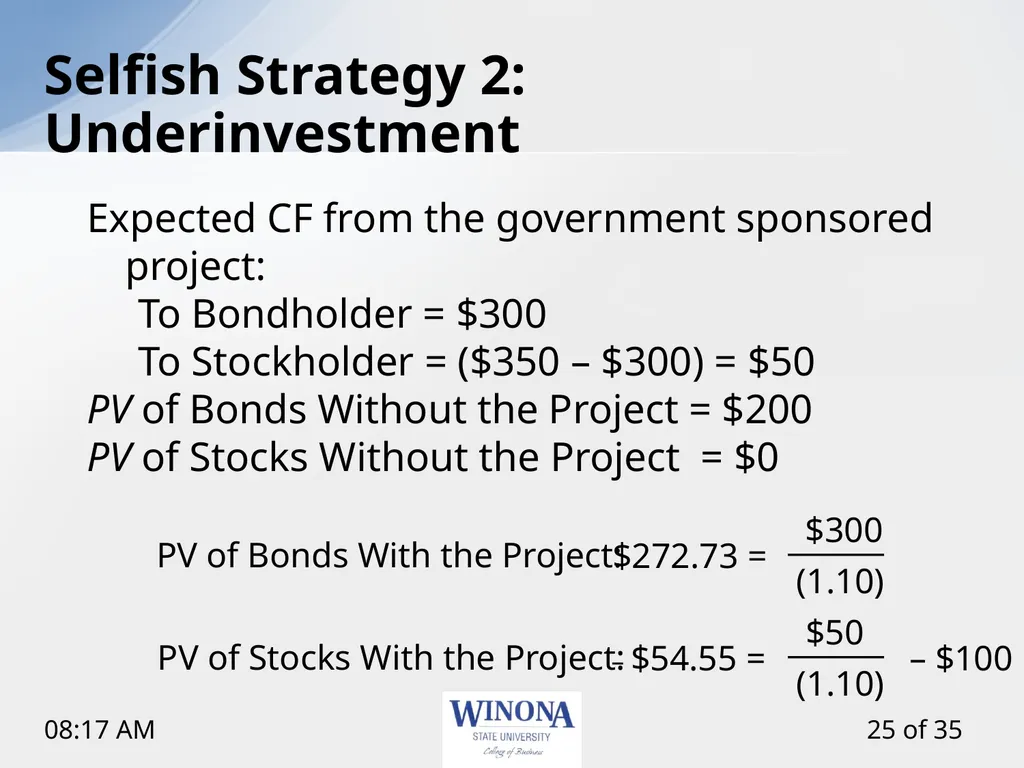
slide25. Selfish Strategy 2: Underinvestment Expected CF from the government sponsored project:
To Bondholder = $300
To Stockholder = ($350 – $300) = $50
PV of Bonds Without the Project = $200
PV of Stocks Without the Project = $0 – $100<br>
slide26. Selfish Strategy 3: Milking the Property Liquidating dividends
Suppose our firm paid out a $200 dividend to the shareholders. This leaves the firm insolvent, with nothing for the bondholders, but plenty for the former shareholders.
Such tactics often violate bond indentures.
Increase perquisites to shareholders and/or management<br>
slide27. Can Costs of Debt Be Reduced? Protective Covenants
Debt Consolidation:
If we minimize the number of parties, contracting costs fall.<br>
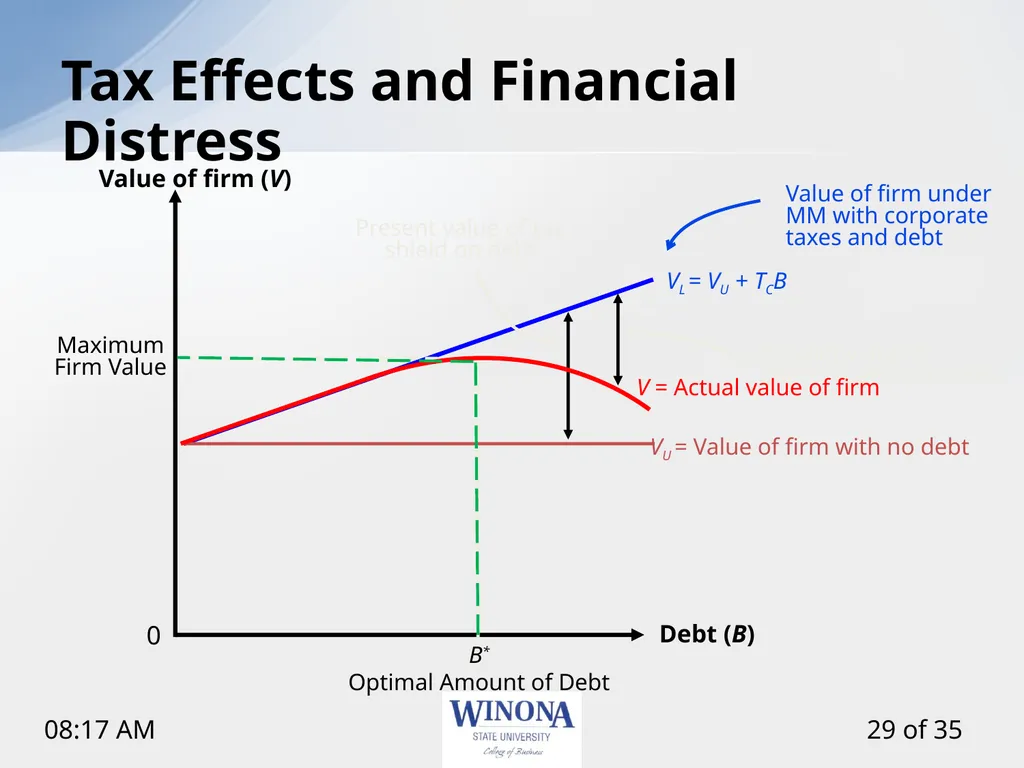
slide28. Tax Effects and Financial Distress There is a trade-off between the tax advantage of debt and the costs of financial distress.
It is difficult to express this with a precise and rigorous formula.<br>
slide29. Tax Effects and Financial Distress Debt (B) Value of firm (V) 0 Present value of tax shield on debt Present value of financial distress costs Value of firm under MM with corporate taxes and debt VL = VU + TCB V = Actual value of firm VU = Value of firm with no debt B* Maximum Firm Value Optimal Amount of Debt<br>
slide30. Taxes and bankruptcy costs can be viewed as just another claim on the cash flows of the firm.
Let G and L stand for payments to the government and bankruptcy lawyers, respectively.
VT = S + B + G + L
Key Ideas:
VT depends on the cash flow of the firm.
Capital structure just slices the pie. The Pie Model Revisited S G B L<br>
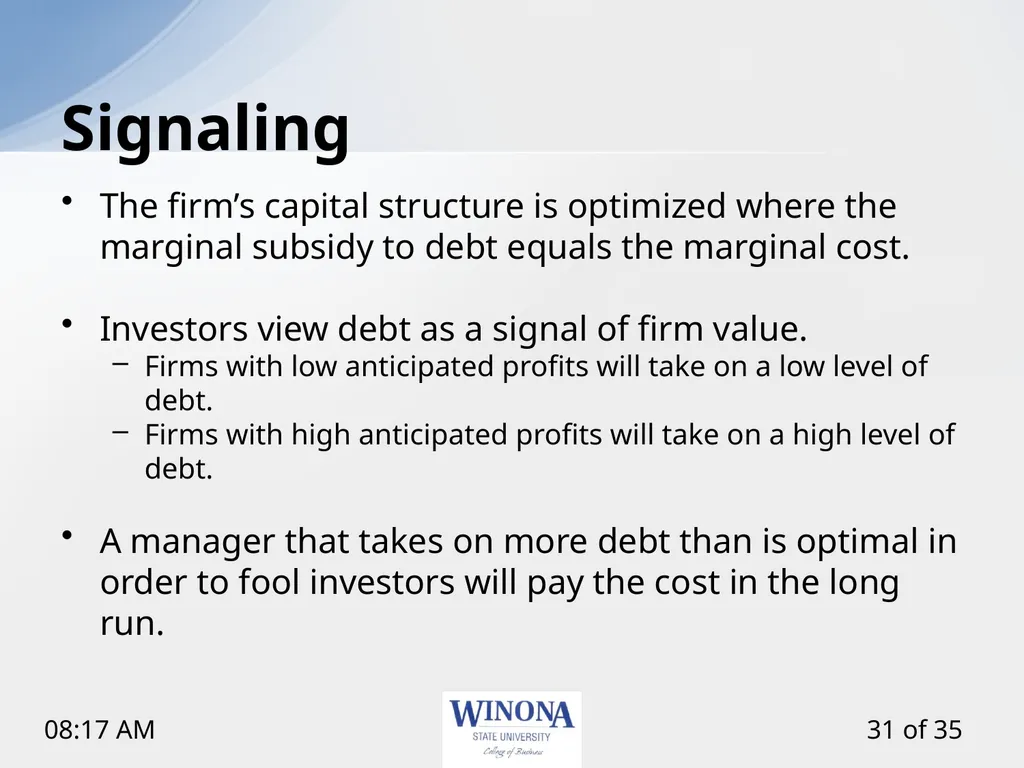
slide31. Signaling The firm’s capital structure is optimized where the marginal subsidy to debt equals the marginal cost.
Investors view debt as a signal of firm value.
Firms with low anticipated profits will take on a low level of debt.
Firms with high anticipated profits will take on a high level of debt.
A manager that takes on more debt than is optimal in order to fool investors will pay the cost in the long run.<br>
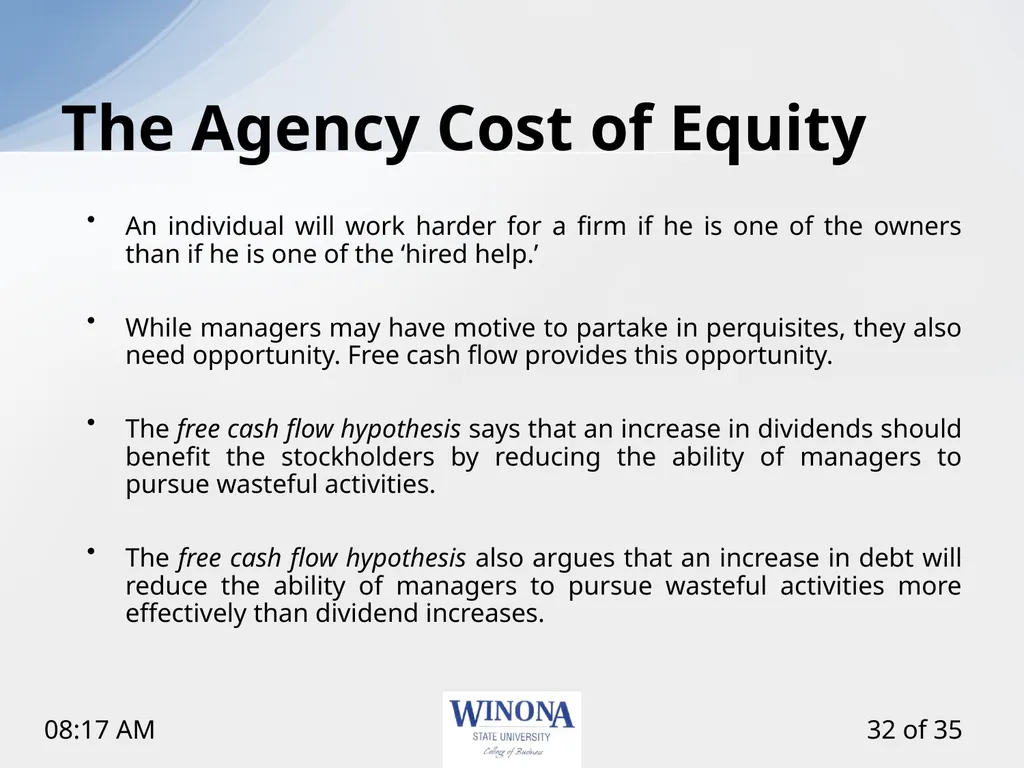
slide32. The Agency Cost of Equity An individual will work harder for a firm if he is one of the owners than if he is one of the ‘hired help.’
While managers may have motive to partake in perquisites, they also need opportunity. Free cash flow provides this opportunity.
The free cash flow hypothesis says that an increase in dividends should benefit the stockholders by reducing the ability of managers to pursue wasteful activities.
The free cash flow hypothesis also argues that an increase in debt will reduce the ability of managers to pursue wasteful activities more effectively than dividend increases.<br>
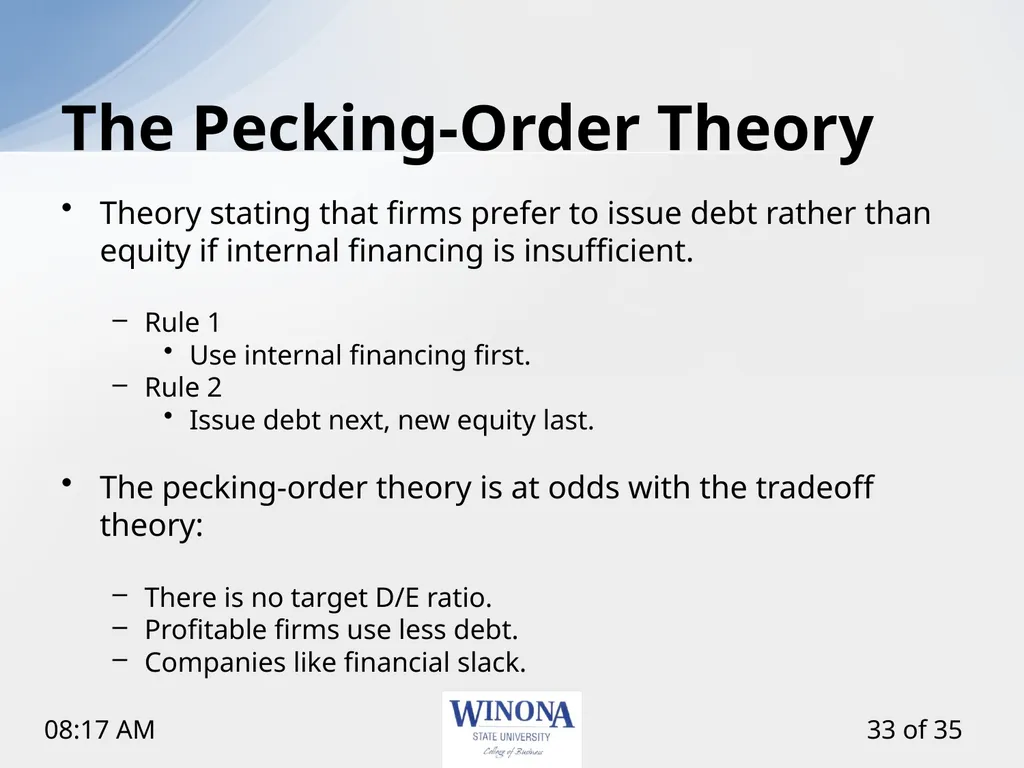
slide33. The Pecking-Order Theory Theory stating that firms prefer to issue debt rather than equity if internal financing is insufficient.
Rule 1
Use internal financing first.
Rule 2
Issue debt next, new equity last.
The pecking-order theory is at odds with the tradeoff theory:
There is no target D/E ratio.
Profitable firms use less debt.
Companies like financial slack.<br>
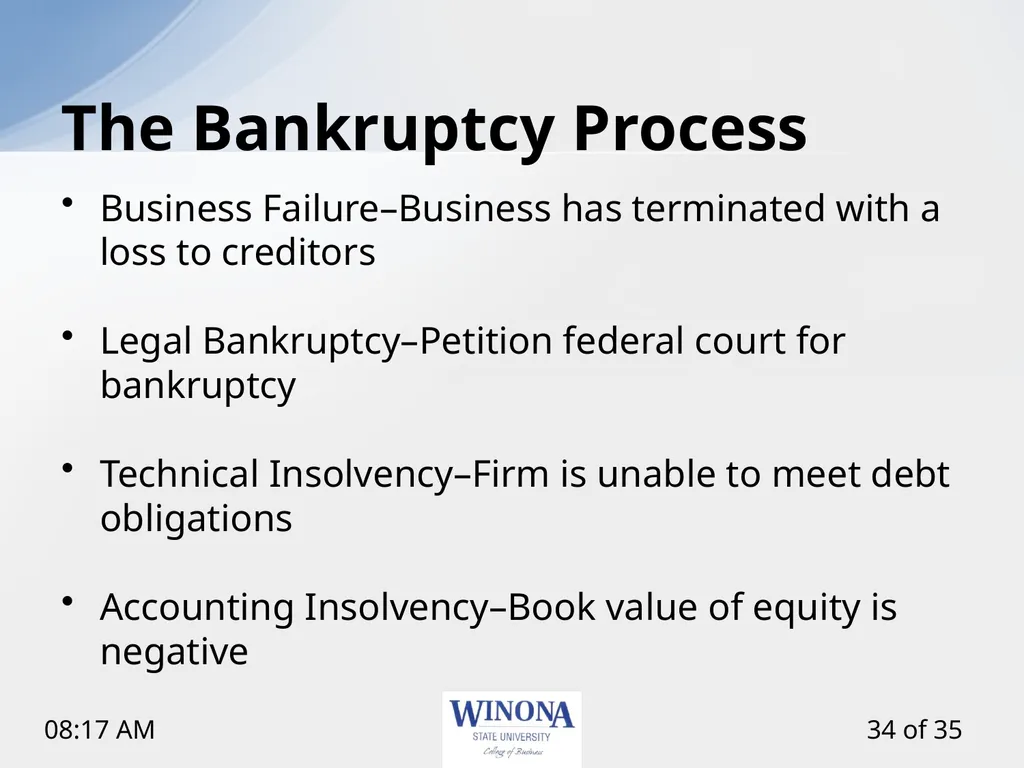
slide34. The Bankruptcy Process Business Failure–Business has terminated with a loss to creditors
Legal Bankruptcy–Petition federal court for bankruptcy
Technical Insolvency–Firm is unable to meet debt obligations
Accounting Insolvency–Book value of equity is negative<br>
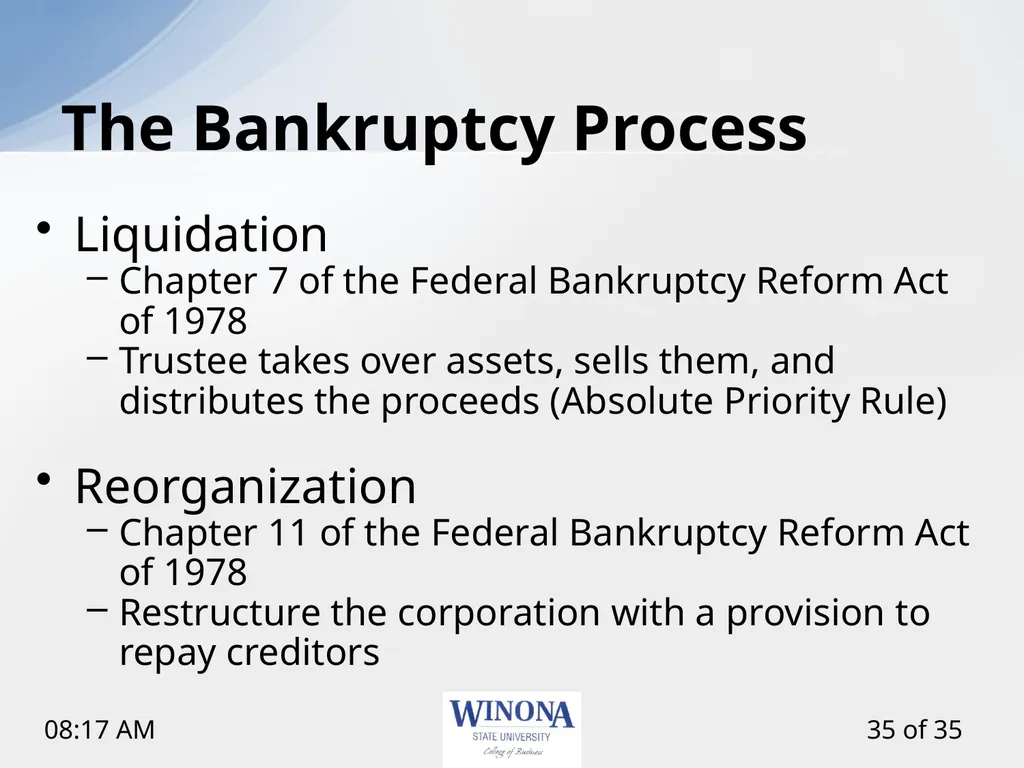
slide35. The Bankruptcy Process Liquidation
Chapter 7 of the Federal Bankruptcy Reform Act of 1978
Trustee takes over assets, sells them, and distributes the proceeds (Absolute Priority Rule)
Reorganization
Chapter 11 of the Federal Bankruptcy Reform Act of 1978
Restructure the corporation with a provision to repay creditors<br>
Larry Schrenk, Instructor FIN 360: Corporate Finance<br>
slide2. Topics Leverage
Miller-Modigliani Propositions
Financial Distress, etc.
Bankruptcy<br>
slide3. Capital Structure and the Pie The value of a firm is defined to be the sum of the value of the firm’s debt and the firm’s equity.
V = B + S If the goal of the firm’s management is to make the firm as valuable as possible, then the firm should pick the debt-equity ratio that makes the pie as big as possible. Value of the Firm S B S B<br>
slide4. Stockholder Interests There are two important questions:
Why should the stockholders care about maximizing firm value? Perhaps they should be interested in strategies that maximize shareholder value.
What is the ratio of debt-to-equity that maximizes the shareholder’s value?
As it turns out, changes in capital structure benefit the stockholders if and only if the value of the firm increases.<br>
slide5. Financial Leverage, EPS, and ROE Current
Assets $20,000
Debt $0
Equity $20,000
Debt/Equity ratio 0.00
Interest rate n/a
Shares outstanding 400
Share price $50 Proposed
$20,000
$8,000
$12,000
2/3
8%
240
$50 Consider an all-equity firm that is considering going into debt. (Maybe some of the original shareholders want to cash out.)<br>
slide6. EPS and ROE under Current Structure Recession Expected Expansion
EBIT $1,000 $2,000 $3,000
Interest 0 0 0
Net income $1,000 $2,000 $3,000
EPS $2.50 $5.00 $7.50
ROA 5% 10% 15%
ROE 5% 10% 15%
Current Shares Outstanding = 400 shares<br>
slide7. EPS and ROE under Proposed Structure Recession Expected Expansion
EBIT $1,000 $2,000 $3,000
Interest 640 640 640
Net income $360 $1,360 $2,360
EPS $1.50 $5.67 $9.83
ROA 1.8% 6.8% 11.8%
ROE 3.0% 11.3% 19.7%
Proposed Shares Outstanding = 240 shares<br>
slide8. Assumptions of the Miller-Modigliani (MM) Model Homogeneous Expectations
Homogeneous Business Risk Classes
Perpetual Cash Flows
Perfect Capital Markets:
Perfect competition
Firms and investors can borrow/lend at the same rate
Equal access to all relevant information
No transaction costs
No taxes<br>
slide9. Homemade Leverage: An Example Recession Expected Expansion
EPS of Unlevered Firm $2.50 $5.00 $7.50
Earnings for 40 shares $100 $200 $300
Less interest on $800 (8%) $64 $64 $64
Net Profits $36 $136 $236
ROE (Net Profits / $1,200) 3.0% 11.3% 19.7%
We are buying 40 shares of a $50 stock, using $800 in margin. We get the same ROE as if we bought into a levered firm.
Our personal debt-equity ratio is:<br>
slide10. Homemade (Un)Leverage: An Example Recession Expected Expansion
EPS of Levered Firm $1.50 $5.67 $9.83
Earnings for 24 shares $36 $136 $236
Plus interest on $800 (8%) $64 $64 $64
Net Profits $100 $200 $300
ROE (Net Profits / $2,000) 5% 10% 15%
Buying 24 shares of an otherwise identical levered firm along with some of the firm’s debt gets us to the ROE of the unlevered firm.
This is the fundamental insight of M&M<br>
slide11. MM Proposition I (No Taxes) We can create a levered or unlevered position by adjusting the trading in our own account.
This homemade leverage suggests that capital structure is irrelevant in determining the value of the firm:
VL = VU
VL is the value of the levered firm
VU is the value of the unlevered firm<br>
slide12. 3 MM Proposition II (No Taxes) Proposition II
Leverage increases the risk and return to stockholders
Rs = R0 + (B/SL) (R0 - RB)
RB is the interest rate (cost of debt)
Rs is the return on (levered) equity (cost of equity)
R0 is the return on unlevered equity (cost of capital)
B is the value of debt
SL is the value of levered equity<br>
slide13. MM Proposition II (No Taxes) Debt-to-Equity Ratio Cost of Capital: R (%) R0 RB RB<br>
slide14. 4 MM Propositions I & II (With Taxes) Proposition I (with Corporate Taxes)
Firm value increases with leverage
VL = VU + TC B
VL is the value of the levered firm
VU is the value of the unlevered firm
Tc is the corporate tax rate
B is the value of the debt
Proposition II (with Corporate Taxes)
Some of the increase in equity risk and return is offset by the interest tax shield
RS = R0 + (B/S)×(1-TC)×(R0 - RB)
RB is the interest rate (cost of debt)
RS is the return on equity (cost of equity)
R0 is the return on unlevered equity (cost of capital)
B is the value of debt
S is the value of levered equity<br>
slide15. The Effect of Financial Leverage R0 RB Debt-to-Equity Ratio Cost of Capital: R (%)<br>
slide16. Total Cash Flow to Investors Recession Expected Expansion
EBIT $1,000 $2,000 $3,000
Interest 0 0 0
EBT $1,000 $2,000 $3,000
Taxes (Tc = 35%) $350 $700 $1,050
Total Cash Flow to S/H $650 $1,300 $1,950 Recession Expected Expansion
EBIT $1,000 $2,000 $3,000
Interest ($800 @ 8% ) 640 640 640
EBT $360 $1,360 $2,360
Taxes (Tc = 35%) $126 $476 $826
Total Cash Flow $234+640 $884+$640 $1,534+$640
(to both S/H & B/H): $874 $1,524 $2,174
EBIT(1-Tc)+TCRBB $650+$224 $1,300+$224 $1,950+$224
$874 $1,524 $2,174 All Equity Levered<br>
slide17. Total Cash Flow to Investors The levered firm pays less in taxes than does the all-equity firm.
Thus, the sum of the debt plus the equity of the levered firm is greater than the equity of the unlevered firm.
This is how cutting the pie differently can make the pie “larger.”–the government takes a smaller slice of the pie! S G S G B All-equity firm Levered firm<br>
slide18. Summary: No Taxes In a world of no taxes, the value of the firm is unaffected by capital structure.
This is M&M Proposition I:
VL = VU
Proposition I holds because shareholders can achieve any pattern of payouts they desire with homemade leverage.
In a world of no taxes, M&M Proposition II states that leverage increases the risk and return to stockholders.<br>
slide19. Summary: Taxes In a world of taxes, but no bankruptcy costs, the value of the firm increases with leverage.
This is M&M Proposition I:
VL = VU + TC B
Proposition I holds because shareholders can achieve any pattern of payouts they desire with homemade leverage.
In a world of taxes, M&M Proposition II states that leverage increases the risk and return to stockholders.<br>
slide20. Costs of Financial Distress Direct Costs
Legal and administrative costs
Indirect Costs
Impaired ability to conduct business (e.g., lost sales)
Agency Costs
Selfish Strategy 1: Incentive to take large risks
Selfish Strategy 2: Incentive toward underinvestment
Selfish Strategy 3: Milking the property<br>
slide21. Example: Company in Distress Assets BV MV Liabilities BV MV
Cash $200 $200 LT bonds $300
Fixed Asset $400 $0 Equity $300
Total $600 $200 Total $600 $200
What happens if the firm is liquidated today? The bondholders get $200; the shareholders get nothing. $200 $0<br>
slide22. Selfish Strategy 1: Take Risks The Gamble Probability Payoff
Win Big 10% $1,000
Lose Big 90% $0
Cost of investment is $200 (all the firm’s cash)
Required return is 50%
Expected CF from the Gamble = $1000 × 0.10 + $0 = $100 NPV = –$133<br>
slide23. Selfish Strategy 1: Take Risks Expected CF from the Gamble
To Bondholders = $300 × 0.10 + $0 = $30
To Stockholders = ($1000 – $300) × 0.10 + $0 = $70
PV of Bonds Without the Gamble = $200
PV of Stocks Without the Gamble = $0<br>
slide24. Consider a government-sponsored project that guarantees $350 in one period.
Cost of investment is $300 (the firm only has $200 now), so the stockholders will have to supply an additional $100 to finance the project.
Required return is 10%. Should we accept or reject? NPV = $18.18 Selfish Strategy 2: Underinvestment<br>
slide25. Selfish Strategy 2: Underinvestment Expected CF from the government sponsored project:
To Bondholder = $300
To Stockholder = ($350 – $300) = $50
PV of Bonds Without the Project = $200
PV of Stocks Without the Project = $0 – $100<br>
slide26. Selfish Strategy 3: Milking the Property Liquidating dividends
Suppose our firm paid out a $200 dividend to the shareholders. This leaves the firm insolvent, with nothing for the bondholders, but plenty for the former shareholders.
Such tactics often violate bond indentures.
Increase perquisites to shareholders and/or management<br>
slide27. Can Costs of Debt Be Reduced? Protective Covenants
Debt Consolidation:
If we minimize the number of parties, contracting costs fall.<br>
slide28. Tax Effects and Financial Distress There is a trade-off between the tax advantage of debt and the costs of financial distress.
It is difficult to express this with a precise and rigorous formula.<br>
slide29. Tax Effects and Financial Distress Debt (B) Value of firm (V) 0 Present value of tax shield on debt Present value of financial distress costs Value of firm under MM with corporate taxes and debt VL = VU + TCB V = Actual value of firm VU = Value of firm with no debt B* Maximum Firm Value Optimal Amount of Debt<br>
slide30. Taxes and bankruptcy costs can be viewed as just another claim on the cash flows of the firm.
Let G and L stand for payments to the government and bankruptcy lawyers, respectively.
VT = S + B + G + L
Key Ideas:
VT depends on the cash flow of the firm.
Capital structure just slices the pie. The Pie Model Revisited S G B L<br>
slide31. Signaling The firm’s capital structure is optimized where the marginal subsidy to debt equals the marginal cost.
Investors view debt as a signal of firm value.
Firms with low anticipated profits will take on a low level of debt.
Firms with high anticipated profits will take on a high level of debt.
A manager that takes on more debt than is optimal in order to fool investors will pay the cost in the long run.<br>
slide32. The Agency Cost of Equity An individual will work harder for a firm if he is one of the owners than if he is one of the ‘hired help.’
While managers may have motive to partake in perquisites, they also need opportunity. Free cash flow provides this opportunity.
The free cash flow hypothesis says that an increase in dividends should benefit the stockholders by reducing the ability of managers to pursue wasteful activities.
The free cash flow hypothesis also argues that an increase in debt will reduce the ability of managers to pursue wasteful activities more effectively than dividend increases.<br>
slide33. The Pecking-Order Theory Theory stating that firms prefer to issue debt rather than equity if internal financing is insufficient.
Rule 1
Use internal financing first.
Rule 2
Issue debt next, new equity last.
The pecking-order theory is at odds with the tradeoff theory:
There is no target D/E ratio.
Profitable firms use less debt.
Companies like financial slack.<br>
slide34. The Bankruptcy Process Business Failure–Business has terminated with a loss to creditors
Legal Bankruptcy–Petition federal court for bankruptcy
Technical Insolvency–Firm is unable to meet debt obligations
Accounting Insolvency–Book value of equity is negative<br>
slide35. The Bankruptcy Process Liquidation
Chapter 7 of the Federal Bankruptcy Reform Act of 1978
Trustee takes over assets, sells them, and distributes the proceeds (Absolute Priority Rule)
Reorganization
Chapter 11 of the Federal Bankruptcy Reform Act of 1978
Restructure the corporation with a provision to repay creditors<br>