Towards the development of a Student Satisfaction Index for the Tertiary Education Sector of Trinidad and Tobago Nyron Seaton Accreditation Officer The Accreditation Council of Trinidad and Tobago Structure of Presentation Introduction and
"Towards the development of a Student Satisfaction" is the property of its rightful owner. Permission is granted to
download and print the materials on this website for personal, non-commercial use only, and to display it
on your personal computer provided you do not modify the materials and that you retain all copyright
notices contained in the materials. By downloading content from our website, you accept the terms of this
agreement.
Presentation Transcript
01
Towards the development of a Student Satisfaction Index for the Tertiary Education Sector of Trinidad and Tobago Nyron Seaton
Accreditation Officer
The Accreditation Council of Trinidad and Tobago<br>
02
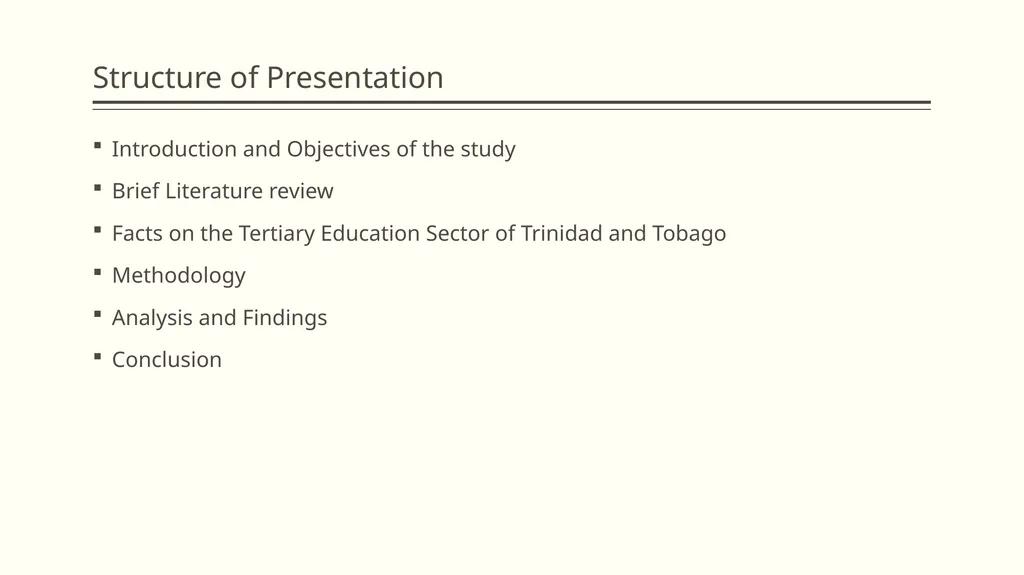
Structure of Presentation Introduction and Objectives of the study
Brief Literature review
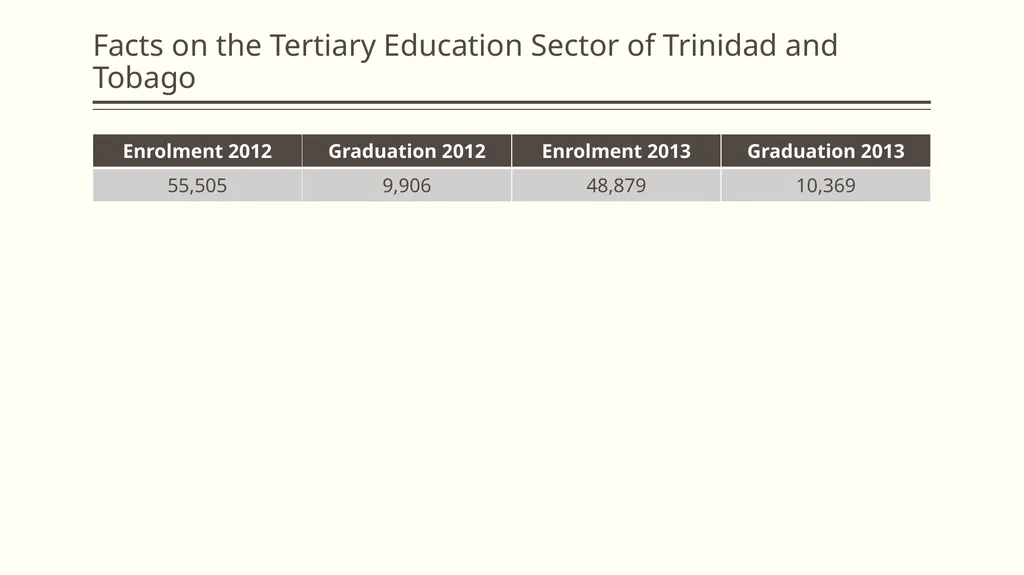
Facts on the Tertiary Education Sector of Trinidad and Tobago
Methodology
Analysis and Findings
Conclusion<br>
03
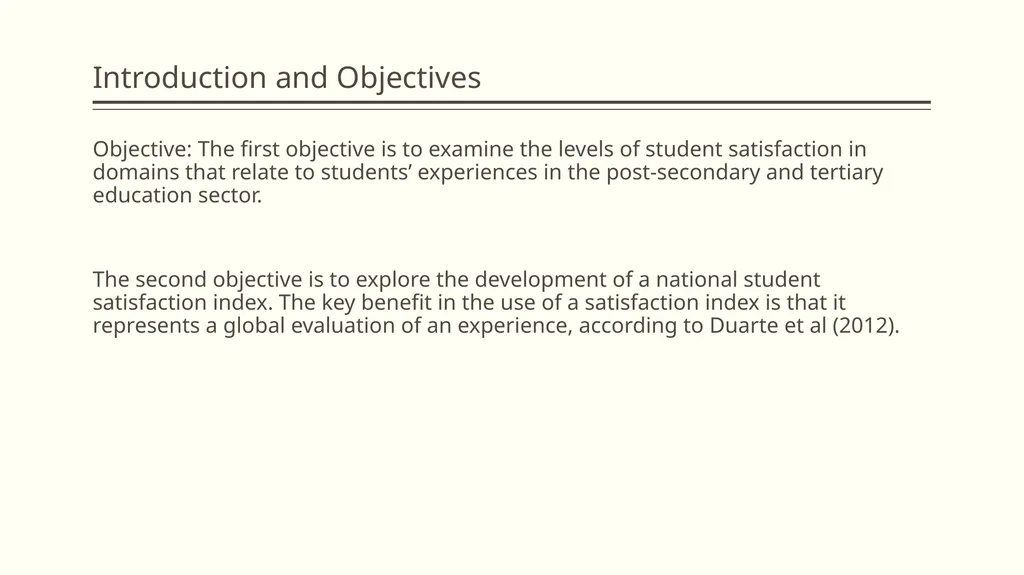
Introduction and Objectives Objective: The first objective is to examine the levels of student satisfaction in domains that relate to students’ experiences in the post-secondary and tertiary education sector.
The second objective is to explore the development of a national student satisfaction index. The key benefit in the use of a satisfaction index is that it represents a global evaluation of an experience, according to Duarte et al (2012).<br>
04
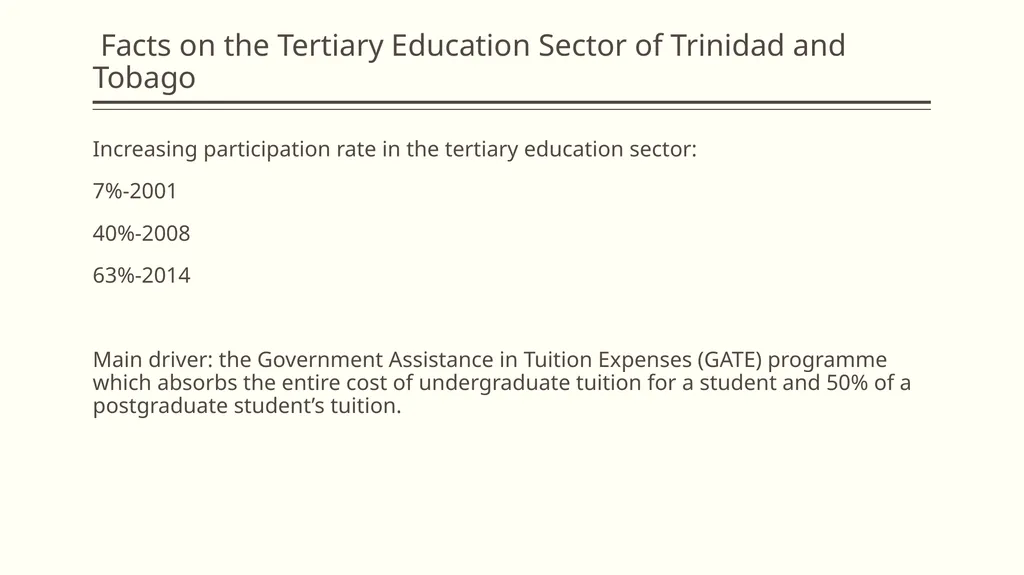
Facts on the Tertiary Education Sector of Trinidad and Tobago Increasing participation rate in the tertiary education sector:
7%-2001
40%-2008
63%-2014
Main driver: the Government Assistance in Tuition Expenses (GATE) programme which absorbs the entire cost of undergraduate tuition for a student and 50% of a postgraduate student’s tuition.<br>
05
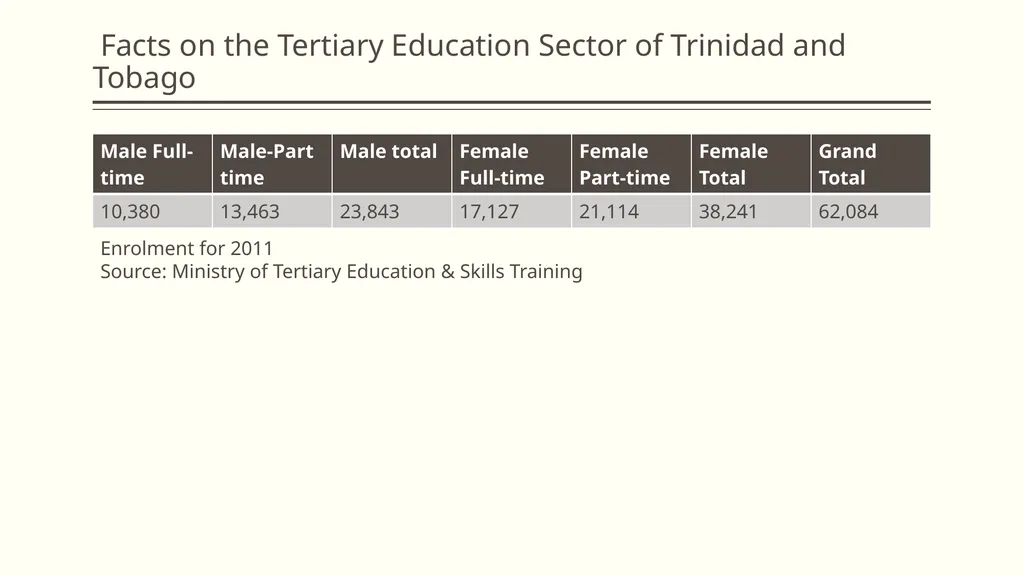
Facts on the Tertiary Education Sector of Trinidad and Tobago Enrolment for 2011
Source: Ministry of Tertiary Education & Skills Training<br>
06
Facts on the Tertiary Education Sector of Trinidad and Tobago<br>
07
Introduction and Objectives Silk et al (2006) noted tertiary education “is increasingly recognizing that it is a service industry and is placing greater emphasis on meeting the expectations and needs of students”.<br>
08
Student Consumerism Steele (2007)
Commoditisation of tertiary education: education is no longer viewed as a public good.
………“another phenomenon that is driving student consumerism is the number of higher education institutions that are in business for making money”.
“Stakeholders are demanding that higher education institutions operate in a more business-like manner”.<br>
09
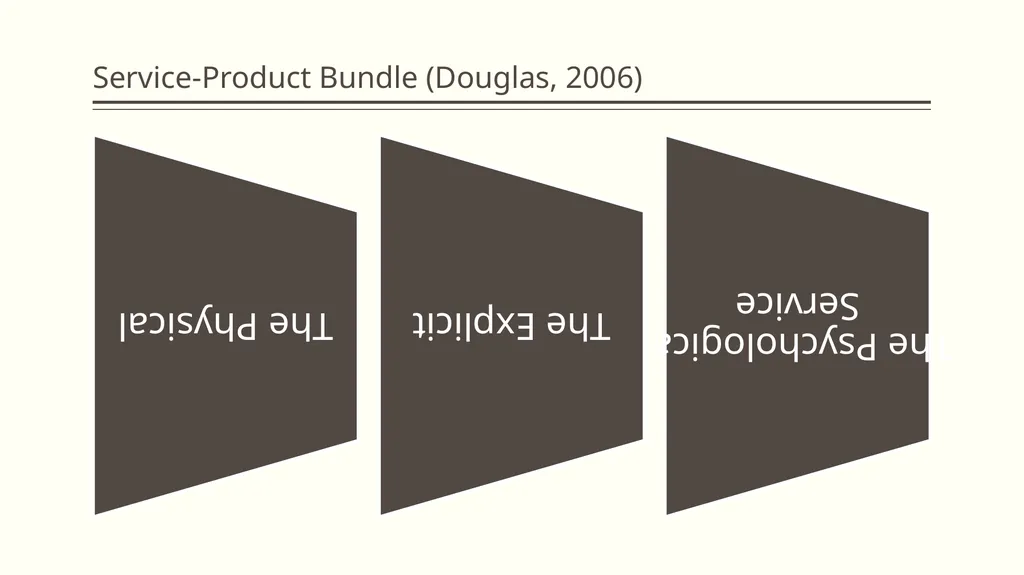
Service-Product Bundle (Douglas, 2006)<br>
10
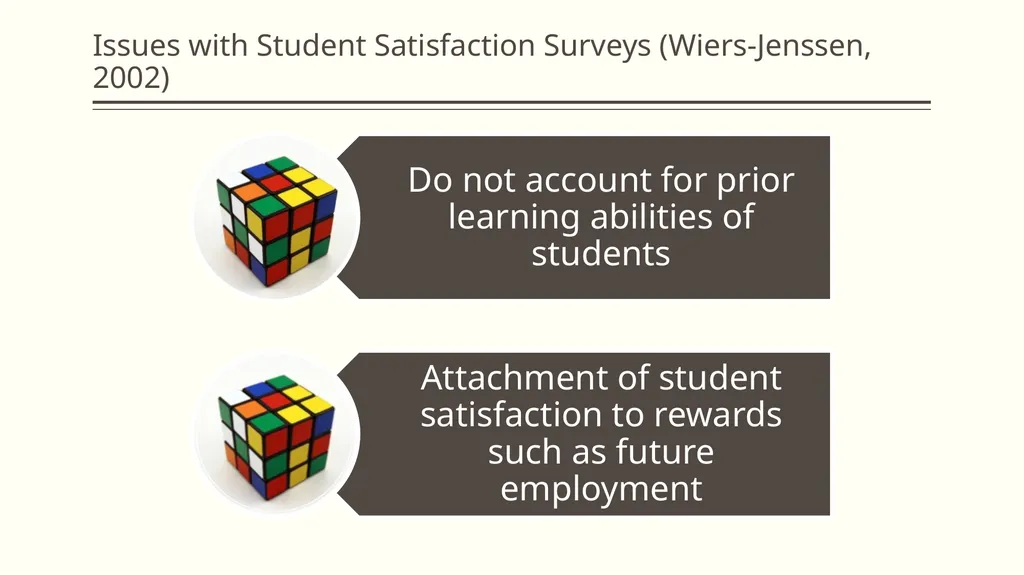
Issues with Student Satisfaction Surveys (Wiers-Jenssen, 2002)<br>
11
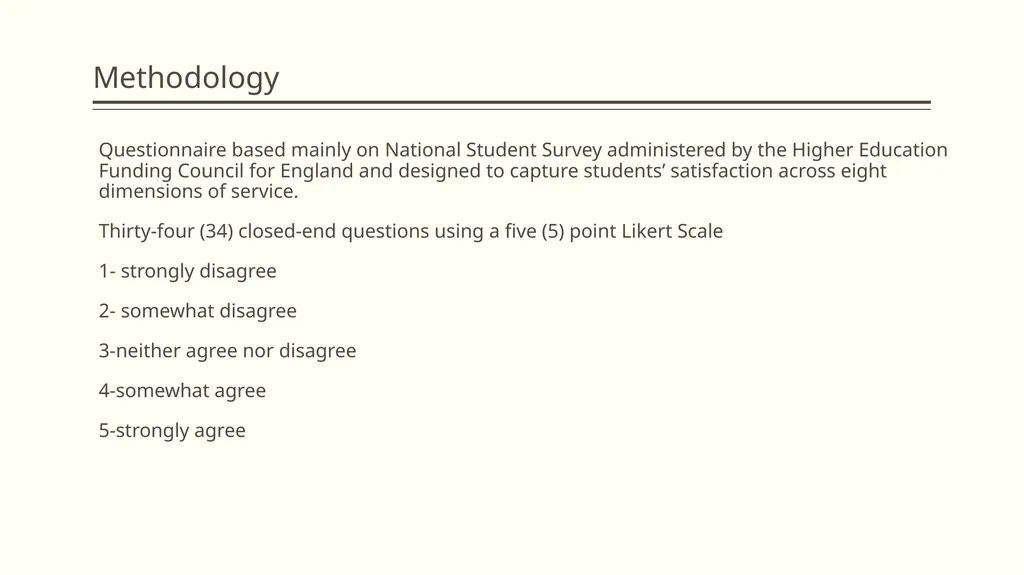
Methodology Questionnaire based mainly on National Student Survey administered by the Higher Education Funding Council for England and designed to capture students’ satisfaction across eight dimensions of service.
Thirty-four (34) closed-end questions using a five (5) point Likert Scale
1- strongly disagree
2- somewhat disagree
3-neither agree nor disagree
4-somewhat agree
5-strongly agree<br>
12
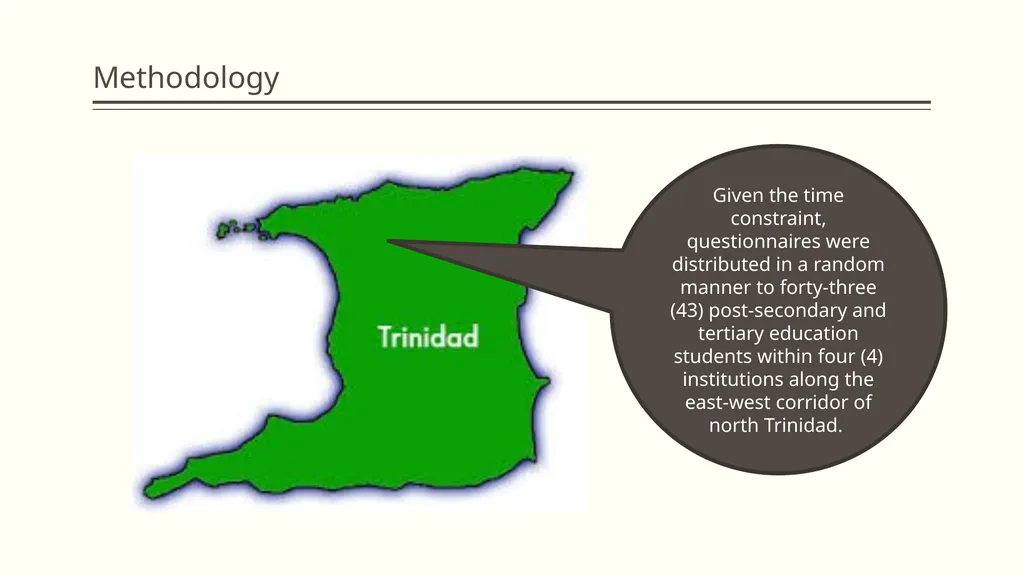
Methodology Given the time constraint, questionnaires were distributed in a random manner to forty-three (43) post-secondary and tertiary education students within four (4) institutions along the east-west corridor of north Trinidad.<br>
13
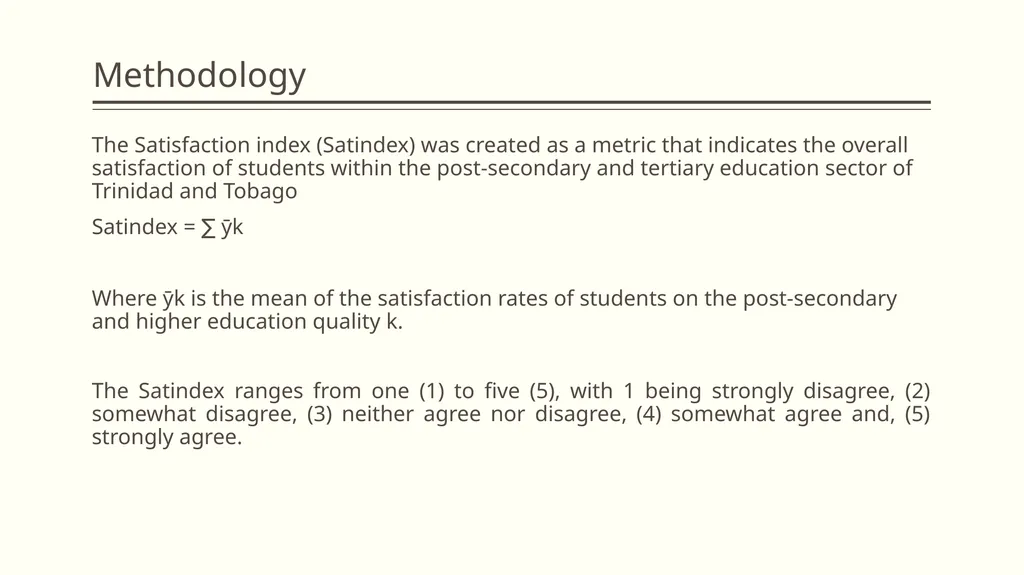
Methodology The Satisfaction index (Satindex) was created as a metric that indicates the overall satisfaction of students within the post-secondary and tertiary education sector of Trinidad and Tobago
Satindex = ∑ ȳk
Where ȳk is the mean of the satisfaction rates of students on the post-secondary and higher education quality k.
The Satindex ranges from one (1) to five (5), with 1 being strongly disagree, (2) somewhat disagree, (3) neither agree nor disagree, (4) somewhat agree and, (5) strongly agree.<br>
14
Limitations of the study The small number of respondents, only forty-three (43) in total
The representativeness of the students
The exclusion of students from the sister island of Tobago, and other areas of Trinidad
With respect to multi-campus institutions, only students at the main campuses were approached.<br>
15
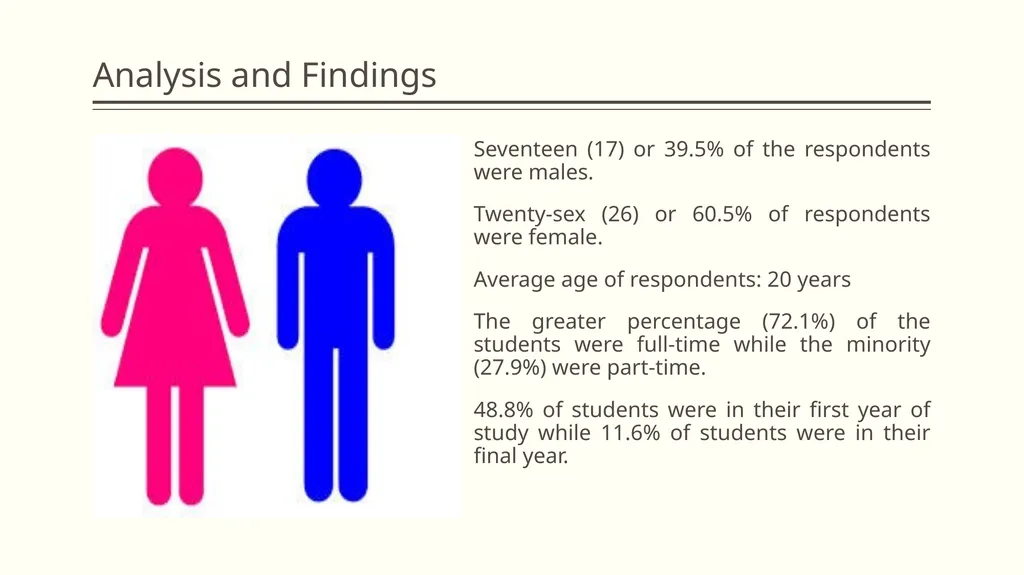
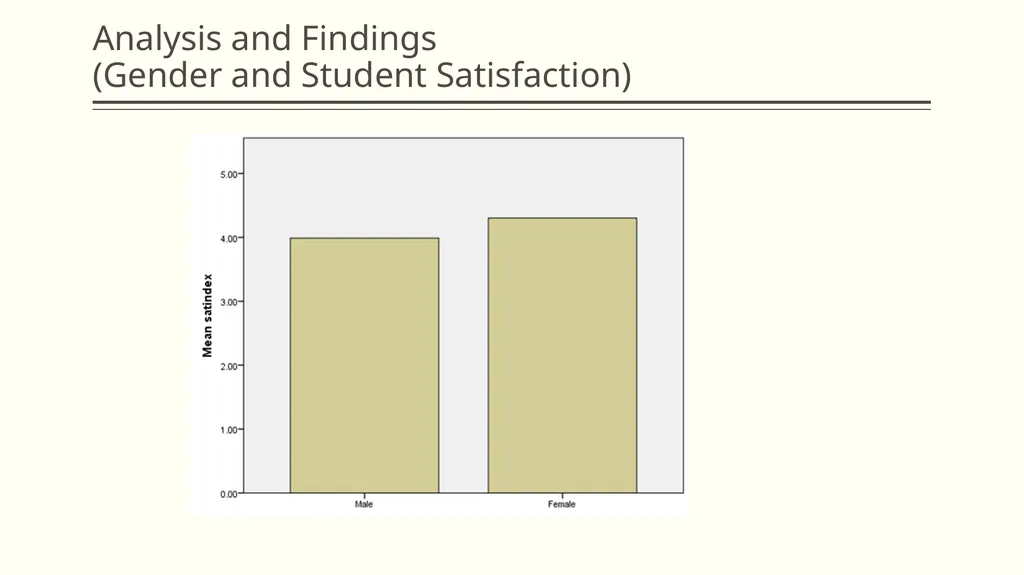
Analysis and Findings Seventeen (17) or 39.5% of the respondents were males.
Twenty-sex (26) or 60.5% of respondents were female.
Average age of respondents: 20 years
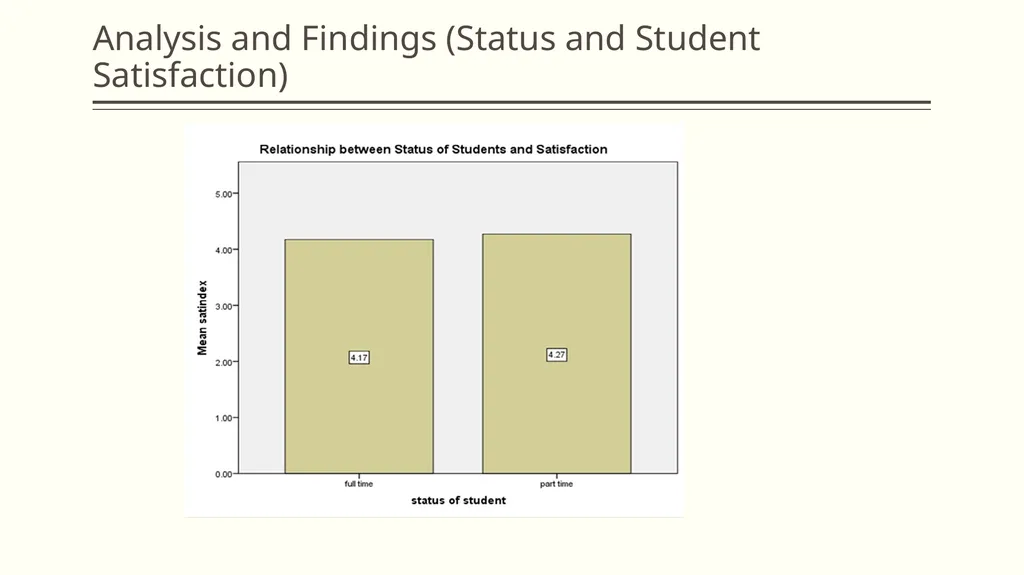
The greater percentage (72.1%) of the students were full-time while the minority (27.9%) were part-time.
48.8% of students were in their first year of study while 11.6% of students were in their final year.<br>
16
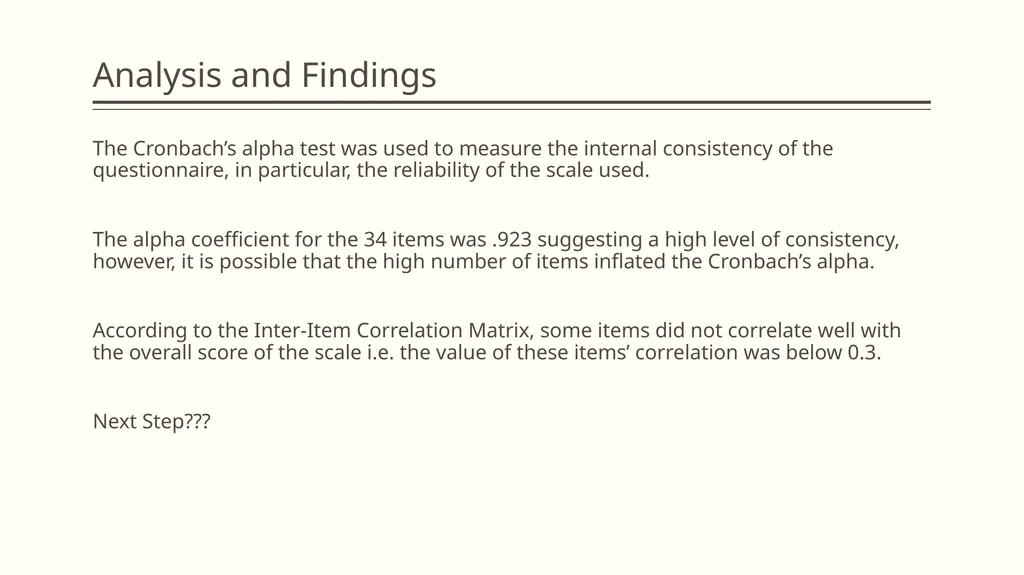
Analysis and Findings The Cronbach’s alpha test was used to measure the internal consistency of the questionnaire, in particular, the reliability of the scale used.
The alpha coefficient for the 34 items was .923 suggesting a high level of consistency, however, it is possible that the high number of items inflated the Cronbach’s alpha.
According to the Inter-Item Correlation Matrix, some items did not correlate well with the overall score of the scale i.e. the value of these items’ correlation was below 0.3.
Next Step???<br>
17
Analysis and Findings ……………..Factor analysis can be helpful
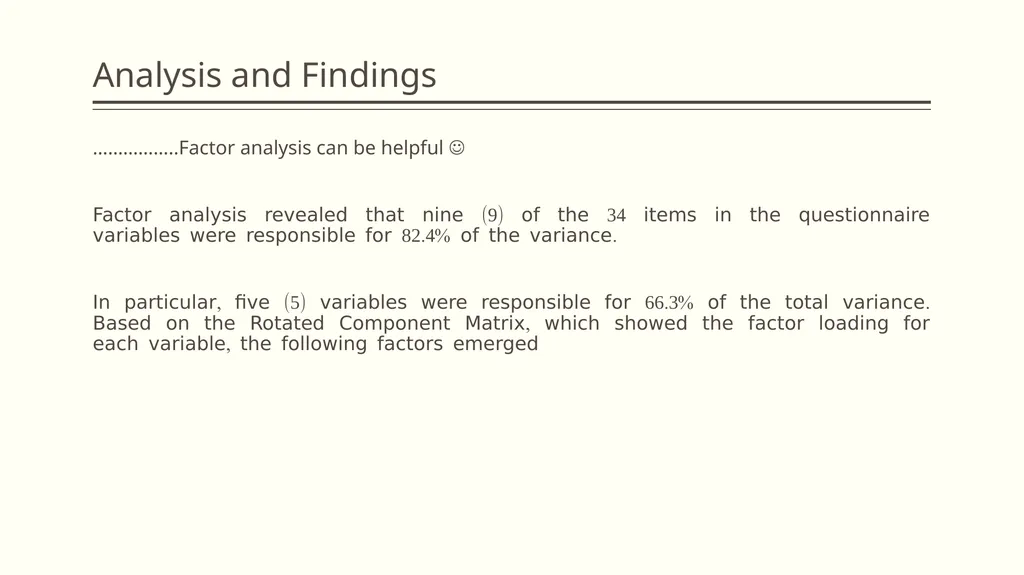
Factor analysis revealed that nine (9) of the 34 items in the questionnaire variables were responsible for 82.4% of the variance.
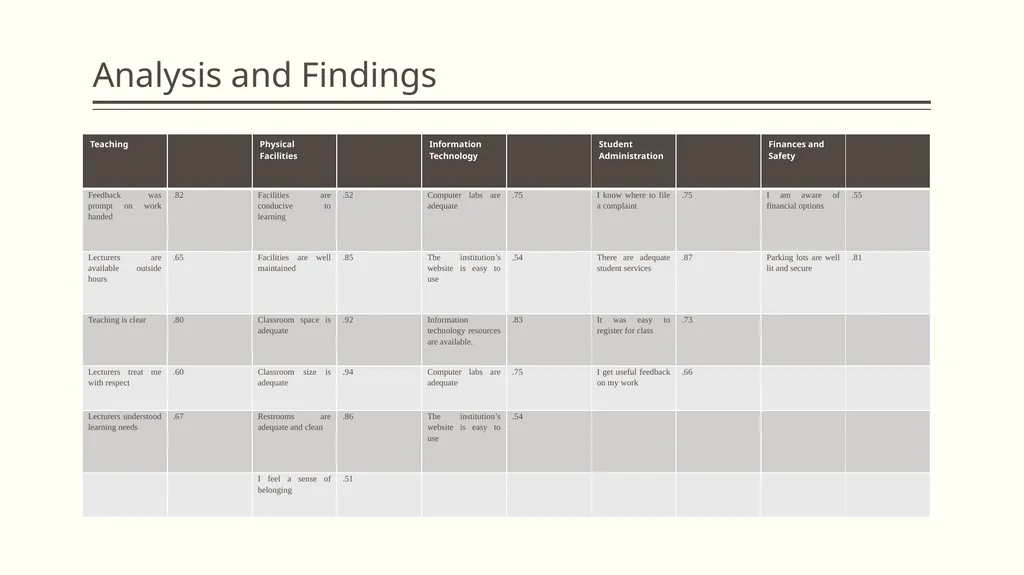
In particular, five (5) variables were responsible for 66.3% of the total variance. Based on the Rotated Component Matrix, which showed the factor loading for each variable, the following factors emerged<br>
18
Analysis and Findings<br>
19
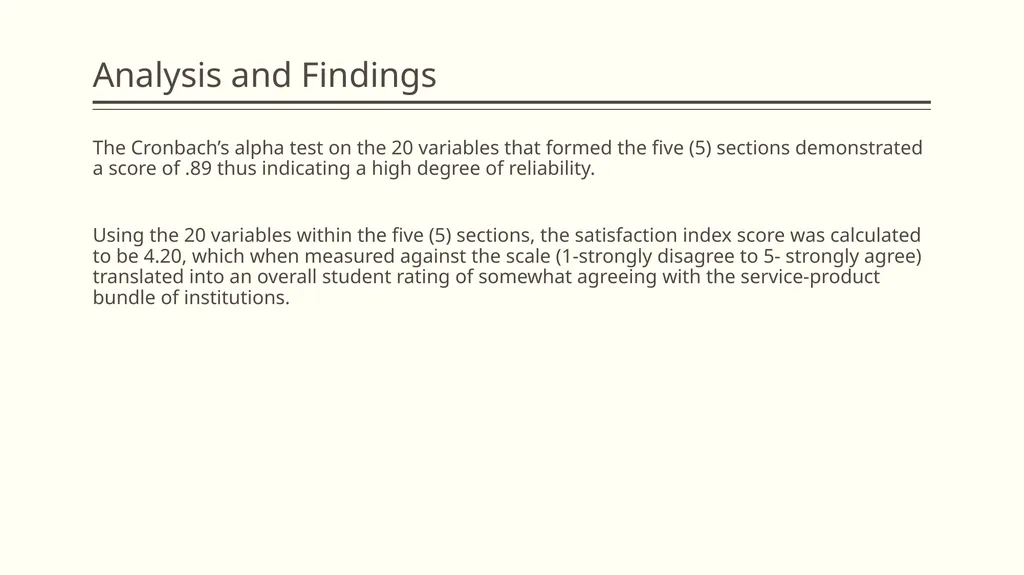
Analysis and Findings The Cronbach’s alpha test on the 20 variables that formed the five (5) sections demonstrated a score of .89 thus indicating a high degree of reliability.
Using the 20 variables within the five (5) sections, the satisfaction index score was calculated to be 4.20, which when measured against the scale (1-strongly disagree to 5- strongly agree) translated into an overall student rating of somewhat agreeing with the service-product bundle of institutions.<br>
20
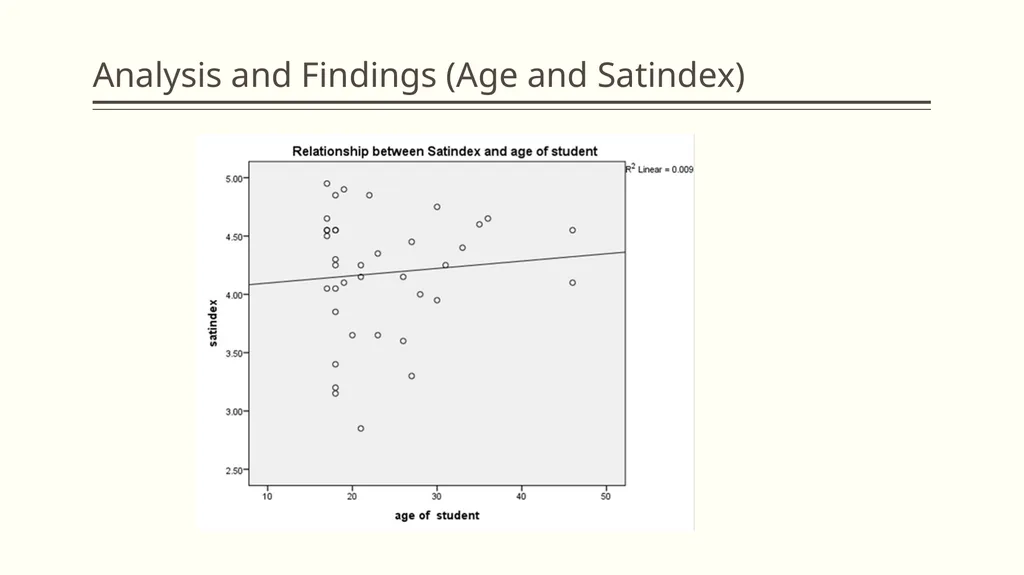
Analysis and Findings (Age and Satindex)<br>
21
Analysis and Findings (Status and Student Satisfaction)<br>
22
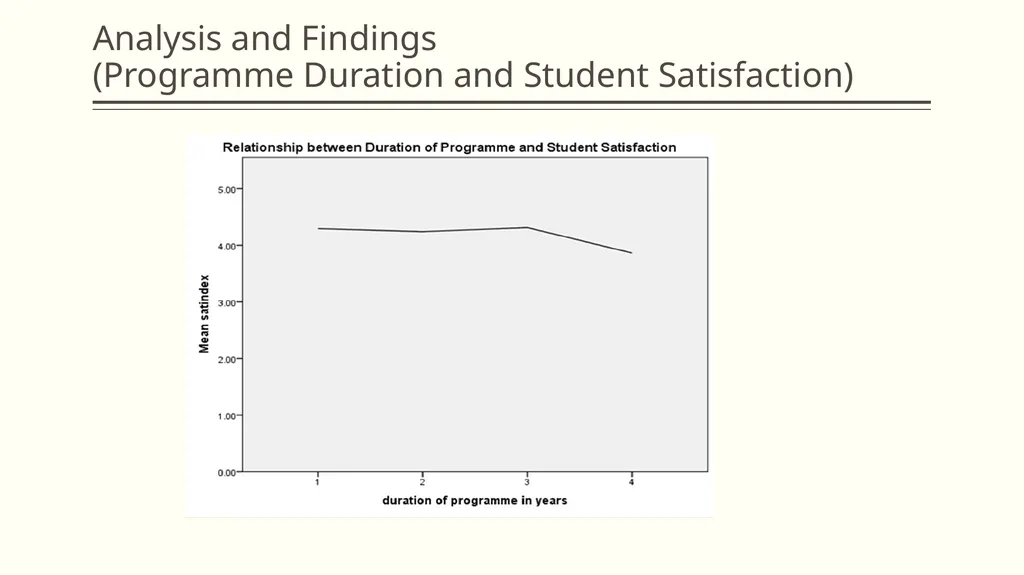
Analysis and Findings (Programme Duration and Student Satisfaction)<br>
23
Analysis and Findings (Gender and Student Satisfaction)<br>
24
Conclusion The embryonic stage of development of a national satisfaction index for the post-secondary and tertiary education sector of Trinidad and Tobago is the first step towards the development of a suite of national quality indicators.
Despite the limitations, one can surmise that in a general sense students are somewhat satisfied with the service-product bundle of the post-secondary institutions.<br>